Support and Resistance
FHE Analysis (4H)A major structure in FHE has turned bearish, and the price is currently pulling back to a fresh and untouched order block. Additionally, the price is trading below supply zones on higher timeframes.
A drop toward the specified targets and the green zone is expected, as long as the red box is maintained.
A daily candle closing above the invalidation level will invalidate this analysis.
For risk management, please don't forget stop loss and capital management
When we reach the first target, save some profit and then change the stop to entry
Comment if you have any questions
Thank You

My UNH Thesis: Betting on a Healthcare Giant's Come BackThe healthcare sector has been in decline, which creates interesting opportunities. I recently talked about a few pharma plays - Eli Lilly, Novo Nordisk, and Pfizer.
Here's why I'm investing in NYSE:UNH :
UnitedHealth Group (UNH) has tanked ~50% in the past year, but the July 29 (VERY SOON) earnings could flip the script. As a historically dominant player, UNH is now undervalued amid sector weakness, offering massive upside if regulatory fears ease.
Here's my full bull case. 👇 FUNDAMENTAL ANALYSIS
Why the Sell-Off? A Perfect Storm of Bad News
UNH crushed the market for 15 straight years (2009-2023) with positive returns, predictable EPS growth, and 134% gains over the last decade.
But 2024 brought chaos:
Feb: Massive cyber attack caused a one-time EPS hit (non-recurring).
Ongoing: DOJ antitrust probe, criminal fraud investigation, rising Medicare costs, and Optum losses.
April: Disastrous Q1 earnings miss + lowered guidance.
Leadership drama: CEO death.
This erased gains (down 7% over 5 years), amplified by healthcare sector outflows—the biggest since 2020. But is this overblown? Signs point to yes. The markets almost always overreact to bad news.
Bullish Signals: Insiders Betting Big
The tide is turning:
Insider Buying Boom: $32M+ in 2024 (vs. $6.6M in 2019), including new CEO/CFO—highest in 15 years.
Congress Buying: Q2 2024 saw net purchases for the first time in 5 years (vs. historical selling).
DOJ Shift: Probe refocusing on pharmacy benefits (PBM) unit, dropping acquisition/monopoly scrutiny—implies no major findings. Great news!
Sector Tailwinds: Healthcare is one of 3 S&P sectors below historical valuations. Super investors (usually tech-obsessed) are piling in, despite the sector's -10% YTD vs. S&P's +13%.
Plus, UNH's dividend yield is at a record ~3% (vs. 1.5% avg), with 16%+ historical growth and 100%+ free cash flow conversion. Rare combo of yield + growth!
Valuation: Screaming Buy?
UNH trades at PE ~11.9 (vs. 10-year avg 23)—a steal.
Analysts project 16.7% EPS CAGR through 2029.
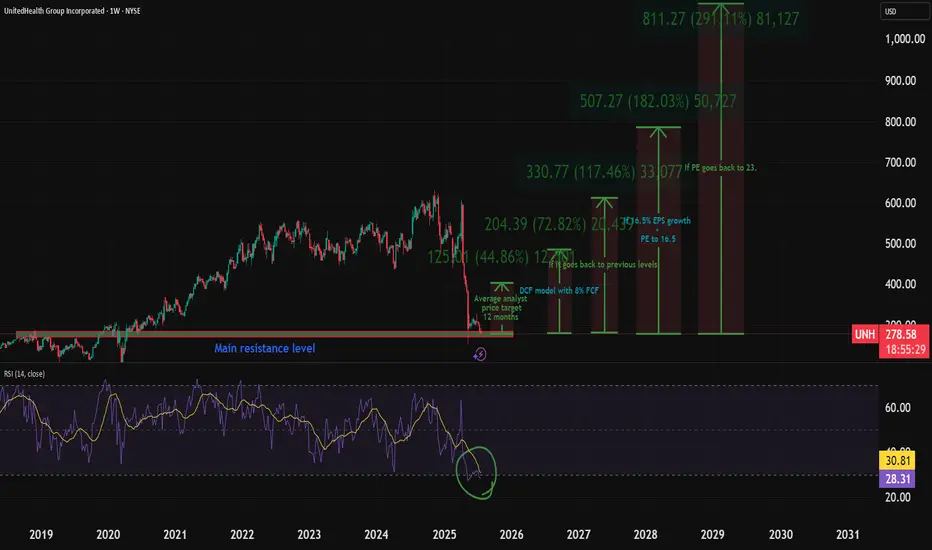
Conservative Scenario: 16.5% EPS growth + PE to 16.5 = $780/share by 2030 (173% total return, 18% CAGR ex-dividends).
Optimistic: PE back to 23 = $1,084/share (280% return).
Models confirm:
DCF (8% FCF growth): ~$484/share (70% upside).
DDM (7% div growth): ~$607/share (112% upside).
Blended Fair Value: ~$545/share (75-90% upside from ~$300). Buy below $436 for 20% safety margin.
Still, there is fear of DOJ uncertainty—investors hate unpredictability and that's why the stock is so low.
Key Catalyst: July 29 Earnings
This could be UNH's "most important report ever." Watch for:
Regulatory/legal updates (DOJ progress).
Full-year guidance revisions.
Metrics like medical loss ratio and PBM performance.
Positive news = potential rocket 🚀. Expectations are low (20 bearish EPS revisions vs. 0 bullish), so a beat could spark volatility... upward.
Risks: Not Without Bumps
Regulatory escalation (e.g., PBM issues) could tank it further.
Short-term headwinds: Medicare costs, sector selling.
Mitigants: DOJ de-risking, strong FCF buffer, insider confidence. Enter cautiously—size positions small.
TECHNICAL ANALYSIS
I also did a little technical analysis:
UNH price is at a resistance level
My EVaR indicator tells me we are in a low-risk area
RSI says the stock is oversold
I added the different price targets for better visualization
THE PLAN
My plan:
Later today, I will allocate 1% to 1.5% of my portfolio to the stock. If it drops, I will continue to DCA. The stock is already really beaten down, and I think a company this large cannot drop much more.
Quick note: I'm just sharing my journey - not financial advice! 😊
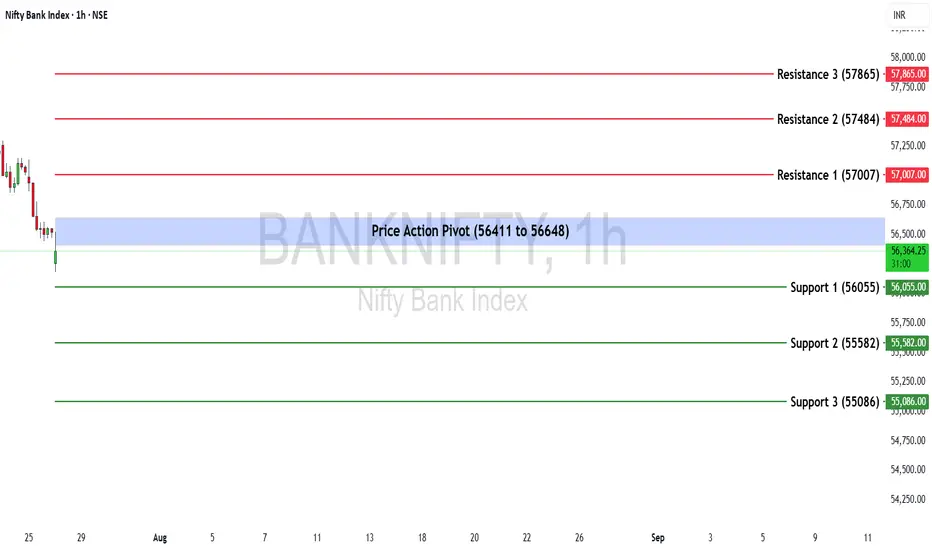
Bank Nifty Weekly Insights: Key Levels & TrendsBank Nifty ended the week at 56,528.90, registering a marginal gain of +0.44%.
🔹 Key Levels for the Upcoming Week
📌 Price Action Pivot Zone:
The critical zone to monitor for potential trend reversals or continuation lies between 56,411 and 56,648.
🔻 Support Levels:
Support 1 (S1): 56,055
Support 2 (S2): 55,582
Support 3 (S3): 55,086
🔺 Resistance Levels:
Resistance 1 (R1): 57,007
Resistance 2 (R2): 57,484
Resistance 3 (R3): 57,865
📈 Market Outlook
✅ Bullish Scenario:
If Bank Nifty sustains above the pivot zone (56,648), it may trigger renewed buying interest, potentially pushing the index toward R1 (57,007) and higher levels like R2 (57,484) and R3 (57,865).
❌ Bearish Scenario:
A breakdown below the lower end of the pivot zone at 56,411 may attract selling pressure, dragging the index towards S1 (56,055) and possibly lower levels like S2 (55,582) and S3 (55,086).
Disclaimer: lnkd.in
SIGN buy/long setup (4H)A tight consolidation range has been broken to the upside, and price has not yet pulled back to it.
On the chart, we have a trigger line breakout and the formation of a bullish change of character (CH).
When the price reaches the green zone, we can look for buy/long positions.
Targets are marked on the chart.
For risk management, please don't forget stop loss and capital management
Comment if you have any questions
Thank You

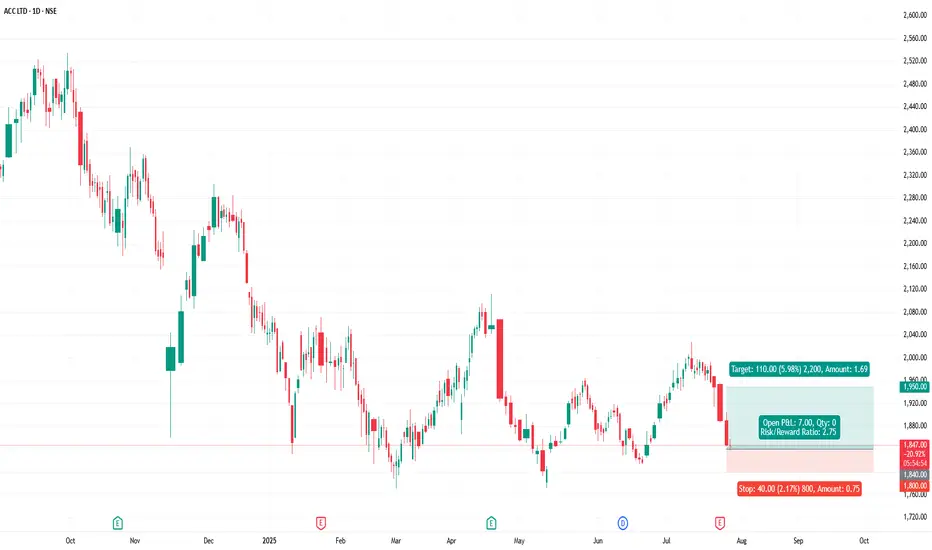
ACC - ACC Ltd (Daily chart, NSE) - Long PositionACC - ACC Ltd (Daily chart, NSE) - Long Position
Risk assessment: Medium {support structure integrity risk}
Risk/Reward ratio ~ 2.75
Current Market Price (CMP) ~ 1848
Entry limit ~ 1845 to 1835 (Avg. - 1840) on July 28, 2025
Target limit ~1950 (+5.98%; +110 points)
Stop order limit ~ 1800 (-2.17%; -40 points)
Disclaimer: Investments in securities markets are subject to market risks. All information presented in this group is strictly for reference and personal study purposes only and is not a recommendation and/or a solicitation to act upon under any interpretation of the letter.
LEGEND:
{curly brackets} = observation notes
= important updates
(parentheses) = information details
~ tilde/approximation = variable value
-hyphen = fixed value
MEBL - PSX - Technical AnalysisMEBL is in sideways for almost seven months now. It is very much likely to continue in that fashion as interest rates cut is expected further.
Therefore, buy on parallel channel's bottom and sell on its top is recommended.
GANN support & Resistance fanes and Fib retracement tools have been used. Price has honoured both GANN and Fibonacci for this SCRIPT. Therefore, one can draw confluence while taking trades in this SCRIPT.
RSI is at a mid-range emphasizing on continuation of small uptrend and then fall down. KVO is also a bit bullish (above Zero), but KVO indicator line has crossed its trigger line as well which may hint at price going up.
Trade Values
Scenario ONE:
Buy-1 (Mkt): 246.64
TP: 271.75
Scenario TWO:
Buy-2: 284 (If price breaks the resistance)
TP-2: 327
Stop Loss: 207

Gold Breakout Failed – Bearish Reversal in Play?Last week was both interesting and revealing for Gold.
After breaking above the key $3375 resistance—which also marked the upper boundary of a large triangle—price quickly accelerated higher, reaching the $3440 resistance zone.
However, instead of a bullish continuation, we witnessed a false breakout and sharp reversal. What initially looked like a healthy pullback turned into a full bearish rejection by week’s end.
________________________________________
📉 Current Technical Picture:
• On the daily chart, we now see a clear Three Black Crows formation
• On the weekly chart, a strong bearish Pin Bar confirms rejection
• And if we add the failed breakout above 3375, the bias tilts decisively bearish
________________________________________
📌 Key Zones and Trading Plan:
• Gold is currently bouncing from the ascending trendline zone, which is natural after dropping more than 1,000 pips in just 3 days
• The $3375–3380 area has regained importance as a key resistance zone, and that’s where I’ll be looking to sell rallies
• A bullish invalidation would only come if price manages to stabilize above $3400
Until then, this remains a bear-dominated market, and a drop below $3300 is on the table.
________________________________________
🧭 Support levels to watch:
• First support: $3280
• Major support: $3250 zone
________________________________________
📉 Conclusion:
The failed breakout, bearish candle formations, and current price structure all point to a market that's shifting in favor of sellers.
I’m looking to sell spikes into resistance, with a clear invalidation above $3400.
Disclosure: I am part of TradeNation's Influencer program and receive a monthly fee for using their TradingView charts in my analyses and educational articles.

Nice Bounce for GRT - What's next? *4 Hour Charting*I re-entered a trade at the 50ma (on the 4-hour) for a significantly smaller position than my previous trade where I went 40x long. There is no leverage here - not because I lack confidence in the trade, but because risk management is the single most important think you can do to protect yourself... and the best way to risk manage is to POSITION SIZE CORRECTLY.
I bought a traunch (about 1/6 the size of my 40x trade), using all of the profits from from my prior trade. I entered at .102 and feel pretty confident we won't go lower. Thus far we have seen a 7% bounce off the 100ma retest.
If we go lower, the 200ma will act as major support around 0.092 ... If that happened, I would probably re-enter on leverage knowing that this is going to re-test the .12-.13 level again.
Something to note... other coins got crushed much harderr and have yet to rebound...
GRT's rebound shows relative strength - and the higher than normal volume supports his thesis.
Short-Term capitulation likely occurred today with people taking profits and avoiding additional risk.
I will exit this trade on a retest of .12, but as you all know, the more we re-test, the higher the probability we break through it, so I might not actually exit the trade depending on the price action. The longer it takes to hit .12, the less likely I am to close the trade. If we see a re-test to the upside in the next 72-hours, I would likely exit this particular trade.
I have a large core position here that I've been holding since 2021 that I don't intend to sell until we see alt-season in full bloom

MOB eyes on $3.57: Break should POP and run OR Double TopMOB with a nice recovery from much needed retrace.
Once again testing the proven Golden Genesis fib at $3.57
If/when it breaks it should be a quick pop and then some.

EURUSD InsightWelcome, everyone.
Please share your personal opinions in the comments. Don’t forget to hit the boost and subscribe buttons.
Key Points
- The U.S. and the EU have reached a trade agreement to impose a 15% tariff on EU goods, including automobiles. However, President Trump stated that pharmaceuticals, steel, and aluminum would be exempt from the 15% tariff. Both sides also agreed to mutually waive tariffs on "strategic items" such as aircraft and semiconductor equipment. Additionally, the EU has agreed to purchase $750 billion worth of U.S. energy and to invest an additional $600 billion in the U.S.
- High-level trade talks between the U.S. and China will be held on July 28–29, with the market expecting an extension of the current trade truce.
- Ahead of the FOMC meeting scheduled for July 29, markets are projecting an interest rate cut more likely in September rather than July.
Key Economic Events This Week
+ July 29: U.S. Department of Labor JOLTS
+ July 30: Germany Q2 GDP, U.S. July ADP Non-Farm Employment Change, U.S. Q2 GDP, Bank of Canada interest rate decision, FOMC meeting outcome
+ July 31: Bank of Japan interest rate decision, Germany July CPI, U.S. June Core PCE Price Index
+ August 1: Eurozone July CPI, U.S. July Non-Farm Payrolls, U.S. July Unemployment Rate
EURUSD Chart Analysis
The pair is showing an upward trend after finding support near the 1.16000 level. However, with resistance at the 1.18000 level—where the price previously faced rejection—the overall bias still appears bearish. That said, a breakout above this resistance line could signal a continuation of the uptrend, warranting close monitoring. For now, the outlook remains bearish toward the 1.15000 level. Should a breakout be confirmed, we will promptly revise our strategy.

GBP/CAD 4H Setup – Bearish Rejection at Key ZonePrice retested the 1.8420–1.8437 supply zone and showed a clear rejection, aligning with the previous trendline break. We're now seeing lower highs forming with bearish momentum.
🔻 Entry: Around 1.8410 – 1.8400
🎯 Target: 1.8313 (previous demand zone)
🛑 Stop Loss: 1.8437 (above structure)
Bias: Bearish below 1.8437 zone
If momentum continues, price could drop toward the 1.8310 support zone. Structure shows clean bearish control unless a breakout occurs back above the supply area.

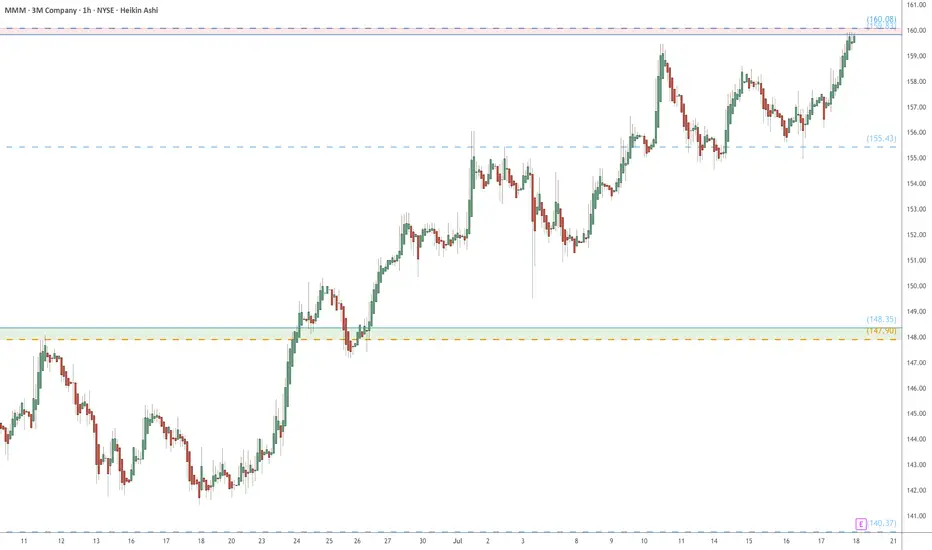
MMM eyes on $160: Resistance Zone waiting for Earnings reportMMM has been crawling off a decade long bottom.
Testing a significant resistance at $159.83-160.08
Earnings report tomorrow, so a key 24 hours here.
.
Previous analysis that caught the BREAK OUT:
Hit the BOOST and FOLLOW for more PRECISE and TIMELY charts.
========================================================
.
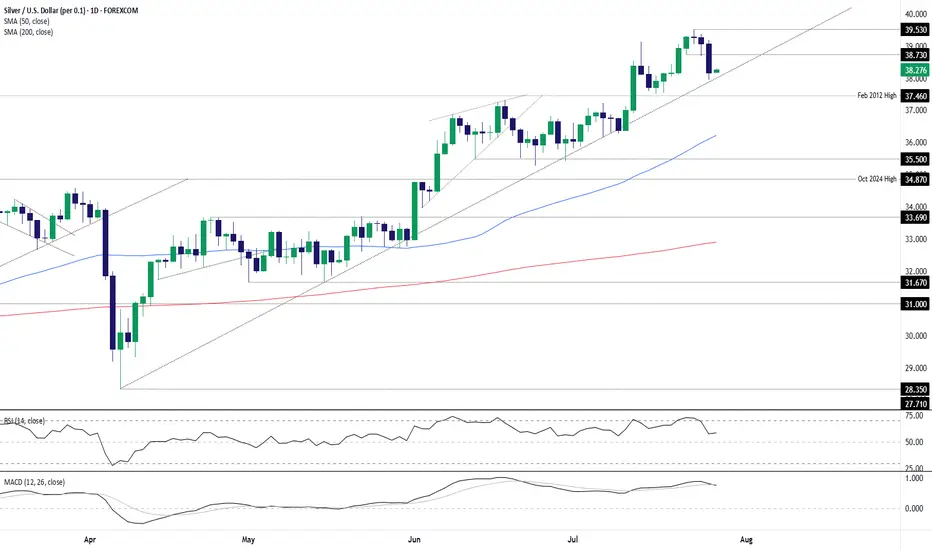
Silver dips to trendline, bulls eye bounceSilver’s latest pullback has seen it move back towards long-running uptrend support, creating a decent entry level for longs with price momentum favouring buying dips over selling rips.
Longs could be established above the trendline with a stop beneath for protection, targeting minor resistance at $38.73 initially and, if broken, the July 23 swing high of $39.53. If the latter were to be achieved, price and momentum signals at the time should dictate whether to hold for a potential test of the psychologically important $40 level.
The price has already bounced off the uptrend on numerous occasions since being established, enhancing the appeal of the setup. While RSI (14) and MACD are not screaming buy when it comes to market momentum, they’re tilted bullish rather than bearish, favouring upside.
If silver were to break and close beneath the uptrend, the bullish bias would be invalidated.
Good luck!
DS
Z eyes on $68.80-69.75: Resistance even the Fib-Blind can SEEZillow has bounced into a major landmark of its lifetime.
Zone is defined by a Golden Covid and a Minor Genesis fib.
This has been tested from both sides many times already.
$ 68.60-69.75 is the exact resistance to watch.
$ 61.82-62.50 is the first support below to hold.
$ 76.18-7./00 is a good first Target for longs.
===================================================
.

AIQ heads up at $44.37/67: Double Golden fib zone will be strongAIQ has been floating up towards a Double Golden zone.
$44.37 is a Golden Covid and $44.67 a Golden Genesis fib.
High-Gravity area is likely to hold this in orbit for some time.
.
Previous analysis that caught a PERFECT BREAK OUT:
=======================================================
.

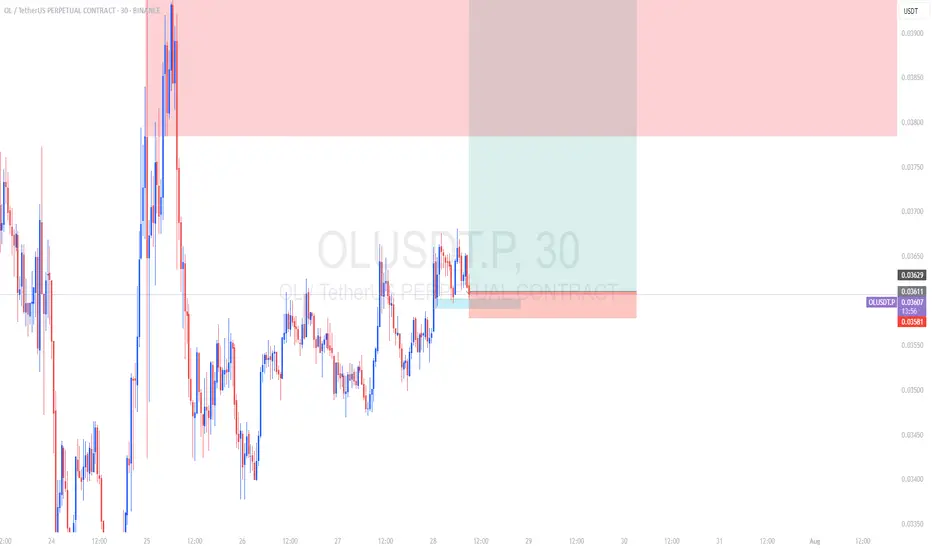
OLUSDT LONGSnR bro!
basic setup resistant become support, previously the support zone can push the price and now pull back again, so I see this as an opportyniti to long
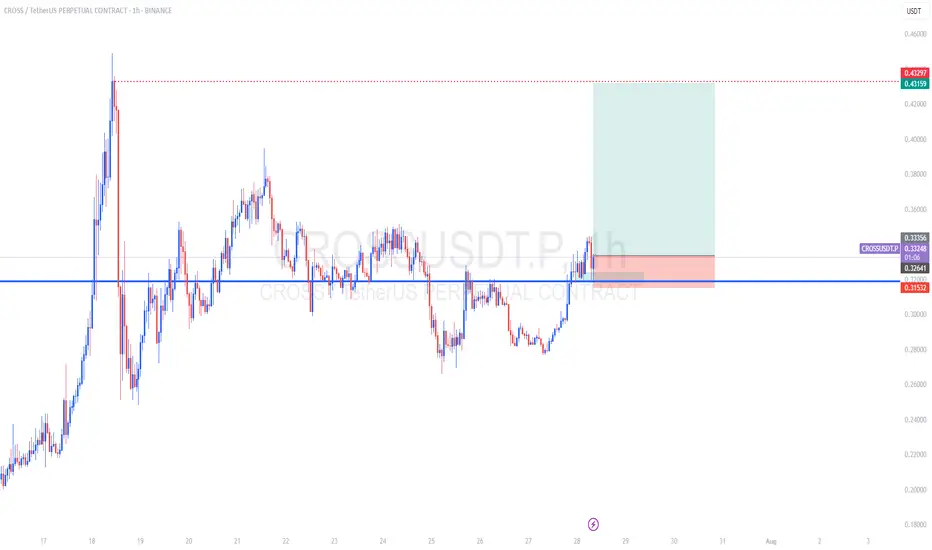
CROSSUSDT LONGSNR BRO!
price break power full Snr reverse and currently bounce up from there, I see this as an opportunity so I buy.
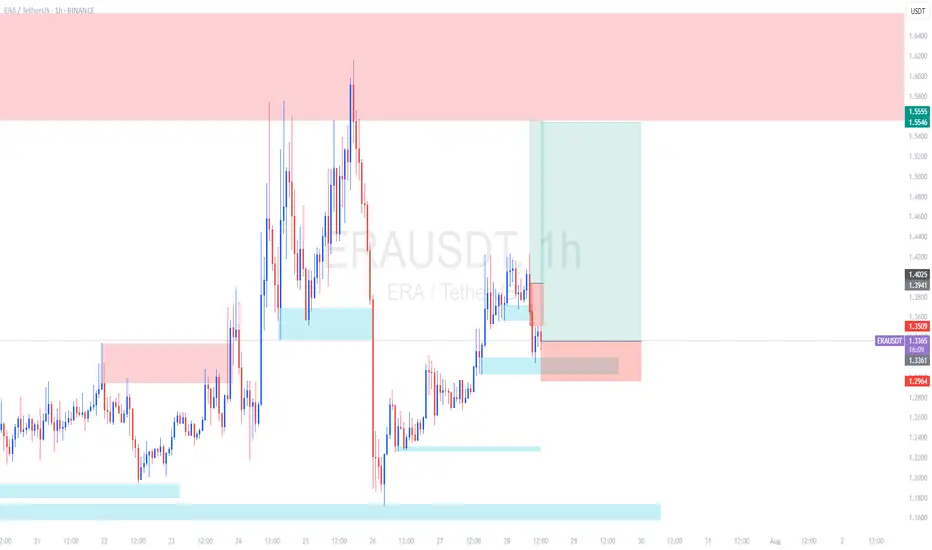
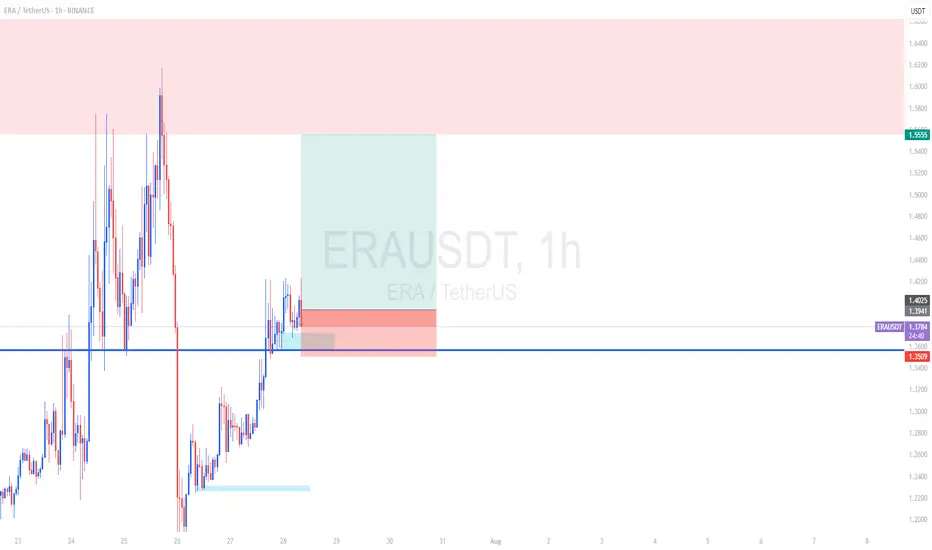
ERAUSDT LONGSNR BRO!!
a power full resistant zone 3x break and confirmed bouncing up from the zone. so I see this as long opportunity
NVDA-the AI TitanNVIDIA (NVDA) continues to dominate the AI semiconductor space and remains one of the strongest momentum names in the market. After reaching new highs, price action is now offering a clean multi-tiered entry opportunity for swing traders positioning for the next leg up.
Entry Points
✅ $160 – Breakout retest zone
✅ $145 – Key technical support
✅ $130 – Strong demand zone from prior consolidation
Profit Targets
📈 TP1: $180
🚀 TP2: $190
💰 TP3: $200+
📌 Disclaimer: This is not financial advice. Just sharing my view and trade idea. Always do your own research and manage risk accordingly.

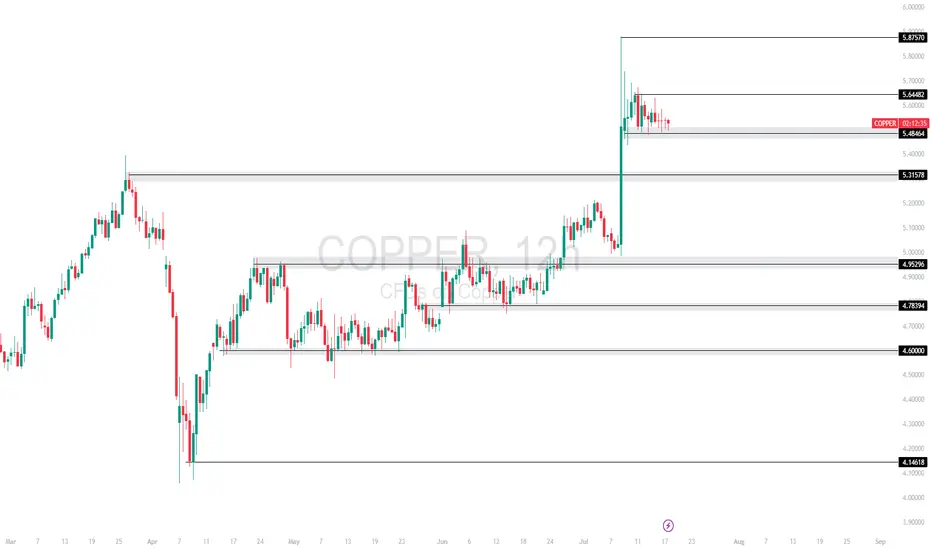
COPPER TECHNICAL ANALYSISCopper spiked into 5.8750 but is now consolidating just below short-term resistance at 5.6448, showing signs of a bullish continuation pattern. Price remains supported at the 5.4864 zone.
Currently trading at 5.4864, with
Support at: 5.4864 / 5.3157 / 4.9929 🔽
Resistance at: 5.6448 / 5.8750 🔼
🔎 Bias:
🔼 Bullish: Break above 5.6448 could push price toward 5.8750 and beyond.
🔽 Bearish: Loss of 5.4864 may trigger downside toward 5.3157.
📛 Disclaimer: This is not financial advice. Trade at your own risk.