S&P 500 (ES1): Buyers In Control Amid Tariff Deals & EarningsWelcome back to the Weekly Forex Forecast for the week of July 28 - Aug 1st.
In this video, we will analyze the following FX market:
S&P 500 (ES1!)
The S&P 500 rose Friday to fresh highs, following a busy week of tariff updates and earnings. The S&P ended the week with its fifth straight record close, its longest such streak in over a year.
No reason to consider selling. Wait for pullbacks to FVGs for high probability buys.
FOMC and NFP loom. Be careful to avoid new entries during news times.
Enjoy!
May profits be upon you.
Leave any questions or comments in the comment section.
I appreciate any feedback from my viewers!
Like and/or subscribe if you want more accurate analysis.
Thank you so much!
Disclaimer:
I do not provide personal investment advice and I am not a qualified licensed investment advisor.
All information found here, including any ideas, opinions, views, predictions, forecasts, commentaries, suggestions, expressed or implied herein, are for informational, entertainment or educational purposes only and should not be construed as personal investment advice. While the information provided is believed to be accurate, it may include errors or inaccuracies.
I will not and cannot be held liable for any actions you take as a result of anything you read here.
Conduct your own due diligence, or consult a licensed financial advisor or broker before making any and all investment decisions. Any investments, trades, speculations, or decisions made on the basis of any information found on this channel, expressed or implied herein, are committed at your own risk, financial or otherwise.
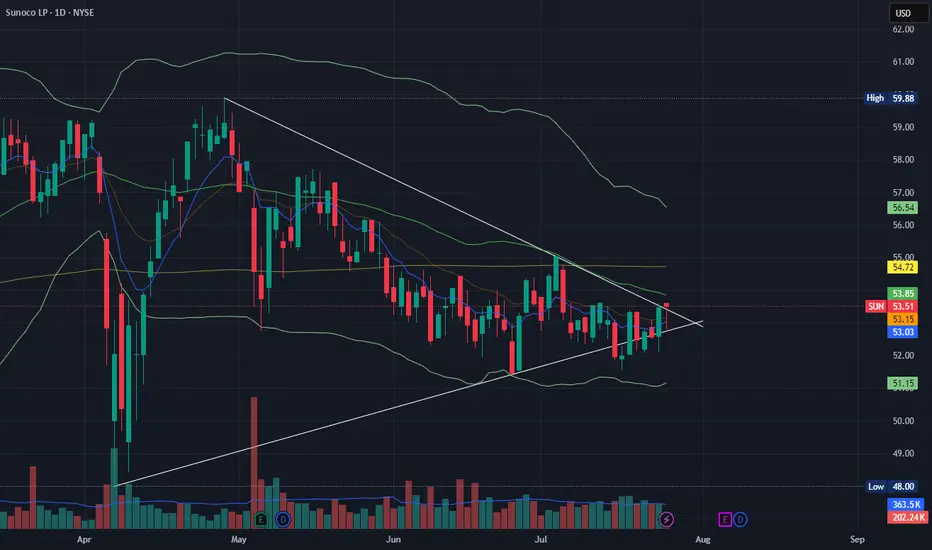
Support and Resistance

KBE watch $48.16/18: Double fib to End Bounce or Break-n-Run?KBE and financials trying to recover from tariff dump.
Currently testing a double fib zone at $48.16-48.18.
Look for Rejection or Break-n-Retest for entries soon.

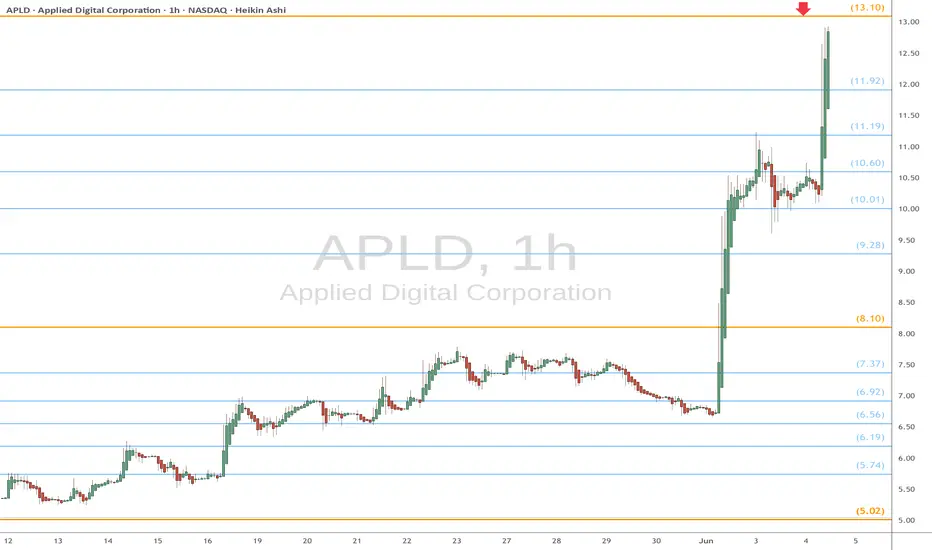
APLD heads up at $13.10: Golden Genesis fib may stop the SurgeAPLD on a massive surge over various company news.
Currently about to hit a Golden Genesis fib at $8.10
Looking for usual Dip-to-Fib or Break-and-Retest to buy.
It is PROBABLE that we "orbit" this fib a few times.
It is POSSIBLE that we get a significant dip from here.
It is PLAUSIBLE that we break and run if bulls are hyper.
.
See "Related Publications" for previous EXACT plots --------------------->>>>>>>
.
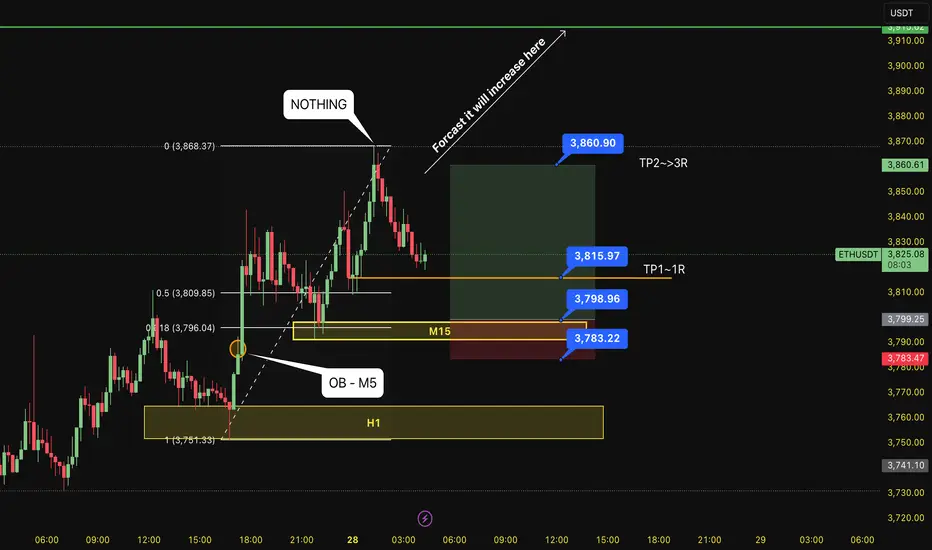
BUY ETH 28.7.2025Confluence order: BUY at M15
Type of order: Limit order
Reason:
- The current top is not touching anything, expected to rise to the H1 above.
- M15~FIBO 0,5-0,618 (same position)
Note:
- Management of money carefully at the last bottom (3,815)
Set up entry:
- Entry buy at 3,798
- SL at 3,783 (below OB NOT USED of M5)
- TP1: 3,815 (~1R)
- TP2: 3,860
Trading Method: Price action (No indicator, only trend and candles)
USDCHF CLEAR BEARISH WEEKLY OBJECTIVEUSD/CHF is showing clear bearish sentiment heading into the early part of the week. The pair exhibits signs of a potential sharp decline, with momentum favoring the downside. Traders should keep a close watch on this pair for possible breakdown opportunities throughout the week.

ETHEREUM (ETHUSD): Bullish Move After BreakoutIt looks like Ethereum has completed its bearish correctional movement.
Analyzing the price movement on a 4H timeframe, the market formed an inverted head and shoulders pattern on a retest of a horizontal support.
The neckline of this pattern is broken, which suggests a strong likelihood of a bullish trend resuming, with the price expected to reach the psychological level of 4000 soon.

EURUSD: Buyers Like the New Trade Deals With The US!Welcome back to the Weekly Forex Forecast for the week of July 28 - Aug 1st.
In this video, we will analyze the following FX market:
EURUSD
Buyers reacting positively to the announcements of trade deals with the US.
Longs are the play until we see a bearish break of significant structure.
FOMC and NFP looming, so be careful the markets don't reverse on your trades!
Wait patiently for buy setups.
Enjoy!
May profits be upon you.
Leave any questions or comments in the comment section.
I appreciate any feedback from my viewers!
Like and/or subscribe if you want more accurate analysis.
Thank you so much!
Disclaimer:
I do not provide personal investment advice and I am not a qualified licensed investment advisor.
All information found here, including any ideas, opinions, views, predictions, forecasts, commentaries, suggestions, expressed or implied herein, are for informational, entertainment or educational purposes only and should not be construed as personal investment advice. While the information provided is believed to be accurate, it may include errors or inaccuracies.
I will not and cannot be held liable for any actions you take as a result of anything you read here.
Conduct your own due diligence, or consult a licensed financial advisor or broker before making any and all investment decisions. Any investments, trades, speculations, or decisions made on the basis of any information found on this channel, expressed or implied herein, are committed at your own risk, financial or otherwise.

GBPUSD: Sellers Are Taking ControlWelcome back to the Weekly Forex Forecast for the week of July 28 - Aug 1st
In this video, we will analyze the following FX market:
GBPUSD
GBP is weak vs USD. GU is heading lower with a bit of steam.
The Monthly and the Weekly are still bullish, but the Daily and 4H indicate weakness. I would not entertain longs until I see a bullish BOS.
Look for the CISD on the 4H in the beginning of the week, confirming sells are the way to go.
Enjoy!
May profits be upon you.
Leave any questions or comments in the comment section.
I appreciate any feedback from my viewers!
Like and/or subscribe if you want more accurate analysis.
Thank you so much!
Disclaimer:
I do not provide personal investment advice and I am not a qualified licensed investment advisor.
All information found here, including any ideas, opinions, views, predictions, forecasts, commentaries, suggestions, expressed or implied herein, are for informational, entertainment or educational purposes only and should not be construed as personal investment advice. While the information provided is believed to be accurate, it may include errors or inaccuracies.
I will not and cannot be held liable for any actions you take as a result of anything you read here.
Conduct your own due diligence, or consult a licensed financial advisor or broker before making any and all investment decisions. Any investments, trades, speculations, or decisions made on the basis of any information found on this channel, expressed or implied herein, are committed at your own risk, financial or otherwise.

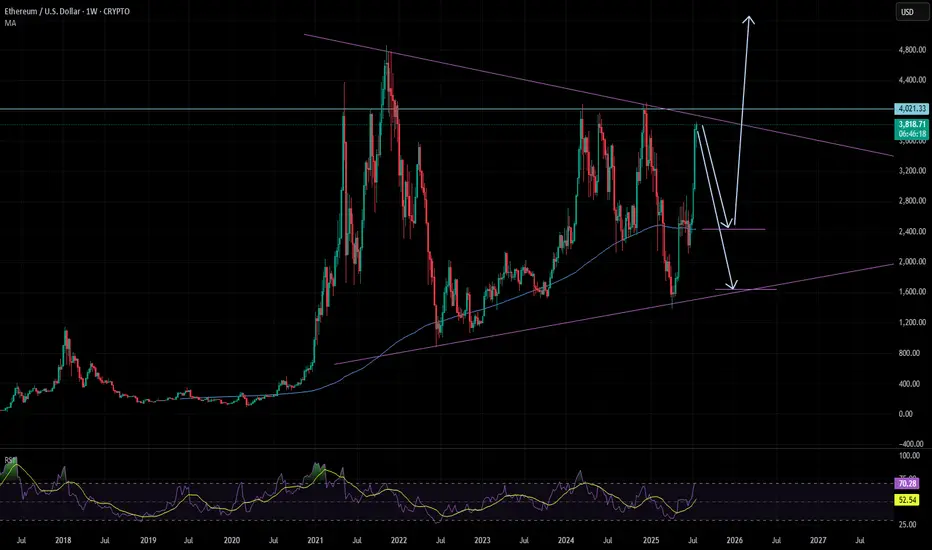
ETH is not going up soonETH made a beautiful bullrun from the trendline.
Now most people will be convinced we will break the 4K level and so straight up.
I'm not convinced, and that is because the last bullist candles are too extended. It's highly unlikely it will go straight up to + 4k from here.
Second we are in a massive triangle that has to play out first.
So what I believe will happen in the next months is that ETH will pullback to 2500 or even lower 1700. Allot of buyers that FOMO in now will be trapped and panic sell.
Then end on the year when QE has done and there is enough fuel to break out of the triangle. It will happen fast maybe arround nov / dec.
So don't fomo in wait
NZDCHF is in the Bearish Side due to Bearish TrendHello Traders
In This Chart NZDCHF HOURLY Forex Forecast By FOREX PLANET
today NZDCHF analysis 👆
🟢This Chart includes_ (NZDCHF market update)
🟢What is The Next Opportunity on NZDCHF Market
🟢how to Enter to the Valid Entry With Assurance Profit
This CHART is For Trader's that Want to Improve Their Technical Analysis Skills and Their Trading By Understanding How To Analyze The Market Using Multiple Timeframes and Understanding The Bigger Picture on the Chart

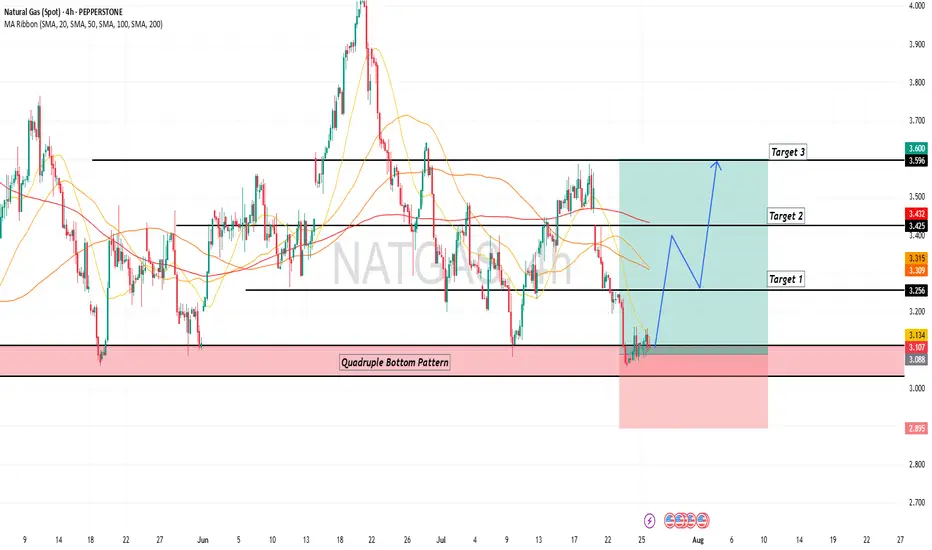
Natural Gas is in the Buying DirectionHello Traders
In This Chart NATGAS HOURLY Forex Forecast By FOREX PLANET
today NATGAS analysis 👆
🟢This Chart includes_ (NATGAS market update)
🟢What is The Next Opportunity on NATGAS Market
🟢how to Enter to the Valid Entry With Assurance Profit
This CHART is For Trader's that Want to Improve Their Technical Analysis Skills and Their Trading By Understanding How To Analyze The Market Using Multiple Timeframes and Understanding The Bigger Picture on the Charts
Silver is in the Bearish trend after testing ResistanceHello Traders
In This Chart XAGUSD HOURLY Forex Forecast By FOREX PLANET
today XAGUSD analysis 👆
🟢This Chart includes_ (XAGUSD market update)
🟢What is The Next Opportunity on XAGUSD Market
🟢how to Enter to the Valid Entry With Assurance Profit
This CHART is For Trader's that Want to Improve Their Technical Analysis Skills and Their Trading By Understanding How To Analyze The Market Using Multiple Timeframes and Understanding The Bigger Picture on the Charts

EURUSD is Ready for a Bullish MoveHello Traders
In This Chart EURUSD HOURLY Forex Forecast By FOREX PLANET
today EURUSD analysis 👆
🟢This Chart includes_ (EURUSD market update)
🟢What is The Next Opportunity on EURUSD Market
🟢how to Enter to the Valid Entry With Assurance Profit
This CHART is For Trader's that Want to Improve Their Technical Analysis Skills and Their Trading By Understanding How To Analyze The Market Using Multiple Timeframes and Understanding The Bigger Picture on the Charts

XAUUSD (GOLD): Wait For The BOS! FOMC and NFP Looms!In this Weekly Market Forecast, we will analyze the Gold (XAUUSD) for the week of July 28 - June 1st.
Gold is in the middle of a consolidation. Bas time to look for new entries!
FOMC on Wednesday and NFP on Friday. Potential news drivers to move price in a decisive direction!
Wait for a break of structure (BOS) either direction before entering a new trade.
Be mindful that the Monthly is bullish, and the Weekly is neutral.
The Daily is bearish, with 3 days of data indicating so. I am leaning towards this bias, as the draws on liquidity are near and obvious.
Enjoy!
May profits be upon you.
Leave any questions or comments in the comment section.
I appreciate any feedback from my viewers!
Like and/or subscribe if you want more accurate analysis.
Thank you so much!
Disclaimer:
I do not provide personal investment advice and I am not a qualified licensed investment advisor.
All information found here, including any ideas, opinions, views, predictions, forecasts, commentaries, suggestions, expressed or implied herein, are for informational, entertainment or educational purposes only and should not be construed as personal investment advice. While the information provided is believed to be accurate, it may include errors or inaccuracies.
I will not and cannot be held liable for any actions you take as a result of anything you read here.
Conduct your own due diligence, or consult a licensed financial advisor or broker before making any and all investment decisions. Any investments, trades, speculations, or decisions made on the basis of any information found on this channel, expressed or implied herein, are committed at your own risk, financial or otherwise.

GER40 | Consolidation Range 24,600 – 24,000 With Breakout TargetGER40 is consolidating within a clear range between 24,600 resistance and 24,000 support. The lower boundary (24,000) aligns with the 61.8% Fibonacci retracement from the 23,050 → 24,600 impulse leg. A confirmed breakout above the range projects a measured move target of 25,197.2, which is derived from the 600-point height of the range between 24,000 and 24,600.
Support at: 24,000.00 / 23,678.5 / 23,050.00 🔽
Resistance at: 24,600.00 🔼
Range Target: 25,197.2 🎯
🔎 Bias:
🔼 Bullish: Clean break and hold above 24,600 confirms range breakout with target at 25,197.2.
🔽 Bearish: Break below 24,000 brings 23,678.5 and 23,050 into view.
📛 Disclaimer: This is not financial advice. Trade at your own risk.

GER40 | Cools Below ResistanceThe DAX rallied aggressively into 24,618.3, but price action has since turned sideways. The index is now ranging just below resistance, as bulls and bears battle for direction in this consolidation phase.
Support at: 24,000.00 / 23,687.21 / 23,500.00 / 23,047.01 🔽
Resistance at: 24,618.30 🔼
🔎 Bias:
🔼 Bullish: Clean break and close above 24,618.30 targets fresh highs.
🔽 Bearish: Break below 24,000 may confirm short-term distribution toward 23,687 and 23,500.
📛 Disclaimer: This is not financial advice. Trade at your own risk.

INJUSDT Daily Chart Analysis | Uptrend Brewing at Crucial LevelINJUSDT Daily Chart Analysis | Uptrend Brewing at Crucial Resistance
🔍 Let’s break down the INJ/USDT setup, examining its technical structure and mapping out key opportunities as it gears up for a decisive move.
⏳ Daily Overview
The INJUSDT pair is forming a solid bullish structure, supported by a clear ascending triangle pattern on the daily timeframe. Notably, the 3SMA (7, 25, 99) are crossing to the upside, signaling the early stage of a potential upward trend. This momentum is reinforced by the ascending triangle’s rising trendline, showing steady accumulation and higher lows.
🔺 Bullish Scenario:
Price is consolidating just below the critical resistance at $15.340—a key zone highlighted by multiple rejections in recent months. A confirmed breakout above this level, especially if backed by a surge in volume, would not only trigger a triangle breakout but also complete the weekly candle formation as a bullish hammer, strengthening the bullish case.
If this breakout sustains, short-term targets line up at $20.290, with the long-term roadmap pointing toward $33.970.
📊 Key Highlights:
- 3SMA (7, 25, 99) MA cross signals the beginning of an upward trend.
- Daily ascending triangle points to persistent bullish pressure.
- $15.340 remains a crucial resistance; price has tested and failed here twice before.
- Breakout confirmation (with volume) could ignite a rapid move to $20.290.
- Failure to break may result in another retest of the triangle’s trendline support.
🚨 Conclusion:
All eyes are on the $15.340 resistance. Wait for clear daily close and volume confirmation before entering. A successful breakout aligns with a bullish weekly hammer and could trigger the next phase higher. Beware of fakeouts, as rejection at resistance could send INJUSDT to retest lower trendline zones.
Stay sharp and plan your entries wisely!

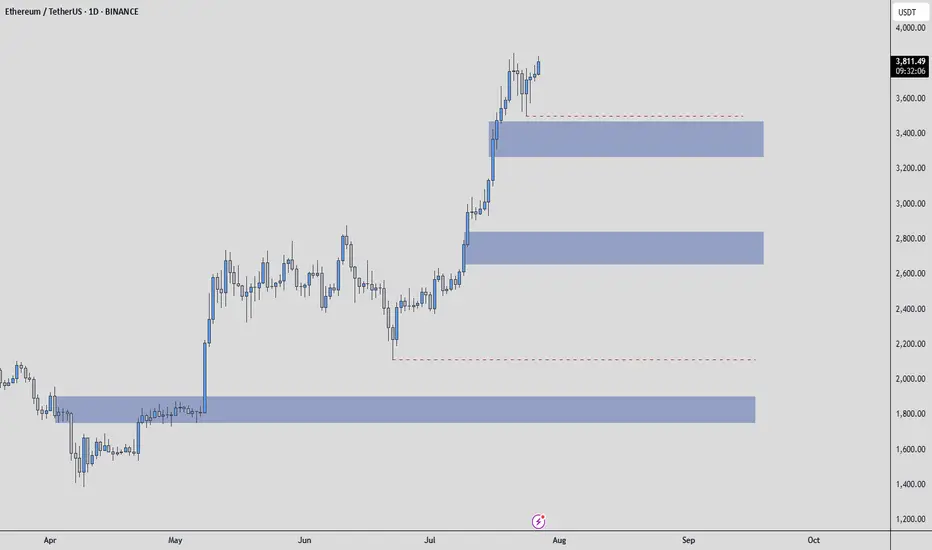
Ethereum - Possible Zones / How to use them ? Hello everyone, and special greetings to my dear friends who follow me, I hope you're happy that I helped you buy Ethereum at $2200.
Let's get to today's situation. There are many areas for Ethereum. The first blue box is the one I'd want to be the first buyer in.
I might want to be a buyer in the other blue boxes as well, but there will be increases even before these areas are reached.
I think the bottom blue box could be the one in the event of a Q3 correction.
What is a Q3 correction? All risk-on markets typically experience significant corrections in the third quarter of the year and struggle to recover from this correction until the end of the year.
The first blue box would be the first area I'd want to be in for any increases leading up to this correction.
HOW DO I GET INVOLVED!! THIS IS IMPORTANT BECAUSE SOME OF YOU LOSE MONEY WHEN BLUE BOXES ARE PULLED AWAY. THIS SHOULD NOT HAPPEN!!
When the price reaches the blue box, the transition is made to the 1-hour timeframe. Here, an upward breakout is sought, and during this breakout, the CDV is expected to be positive and rising. If these conditions are met, then RISK is taken. However, the entire amount of money isn't spent; it simply means that the conditions necessary to spend one bullet are met. One bullet is an amount that won't upset you too much; this varies for everyone.
I hope you use this analysis beneficially and profitably, because I want you to make a lot of money. Best wishes to you all, UmutTrades.
$OGN OGN is in a broader downtrend on the weekly timeframe, consistently forming lower highs (LH). This presents a good opportunity to consider entering a short position. It's worth keeping an eye on it

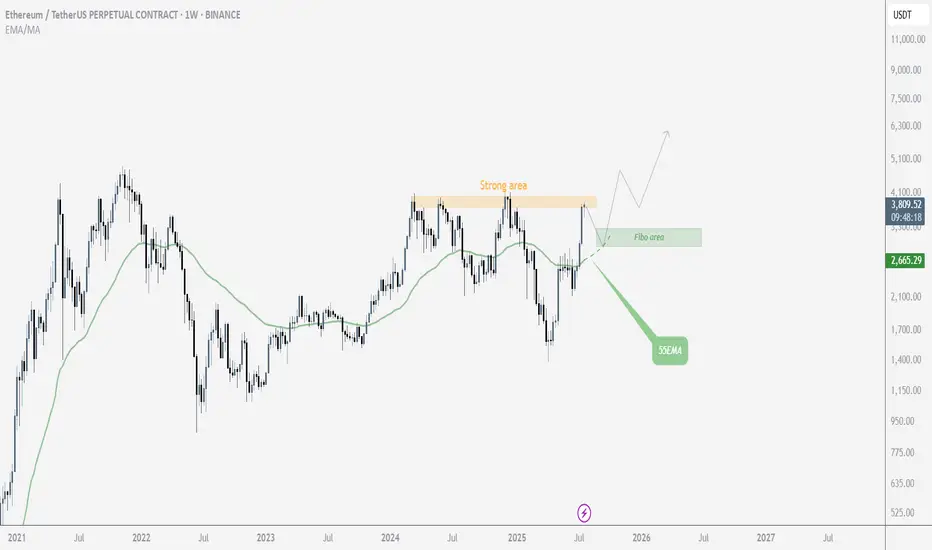
$ETH Mid-TermLooking at Ethereum from a mid-term perspective, it’s currently sitting near its price ceiling, suggesting a potential need for a correction. Of course, it’s also possible that this level could be broken, depending on overall market conditions. However, the primary scenario is that it fails to break through and pulls back, with the potential reversal zone identified based on Fibonacci levels. On the other hand, the 55 EMA is also providing solid support.
If Ethereum manages to break above this resistance, then we'll wait for either a confirmation or a pullback before entering a long position
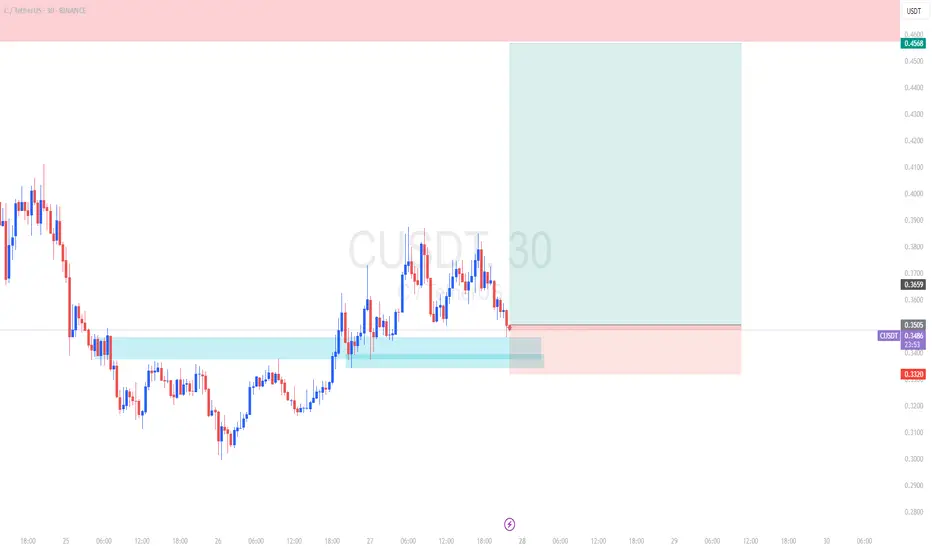
CUSDT LONGnew coins bound to go up, right??
use SnR bro, price just break resistan and pulled back, now it becomes support.. go buy lah
$Link/USDTLINK has taken on a strong upward trend on the daily timeframe and has the potential for solid growth. The EMA cross also confirms this trend. You can either wait for a pullback or consider entering a partial position at the current level

Could this break!?It seems the stock is now found on a range within the EMA9 and EMA21.It now draw a hammer pushing up and heading to test the SMA50.