$Link/USDTLINK has taken on a strong upward trend on the daily timeframe and has the potential for solid growth. The EMA cross also confirms this trend. You can either wait for a pullback or consider entering a partial position at the current level
Support and Resistance

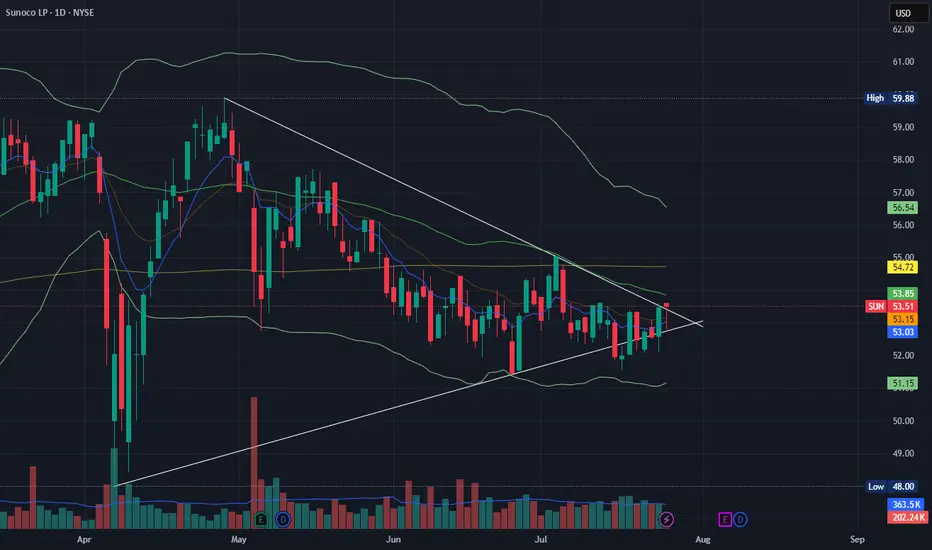
Could this break!?It seems the stock is now found on a range within the EMA9 and EMA21.It now draw a hammer pushing up and heading to test the SMA50.
DOGEUSDT is testing 0.5 Fibonacci support (more gain)As we can see the breakout of red trendline also completed and volume increases after that and now market is testing major Fib levels like 0.5 & 0.61 soon we can expect more pump and gain here like the green arrows.
so many stop loss also hit on this fast correction to the downside and price is ready to start next boom pump with kicking out leverage buyers first.
DISCLAIMER: ((trade based on your own decision))
<<press like👍 if you enjoy💚

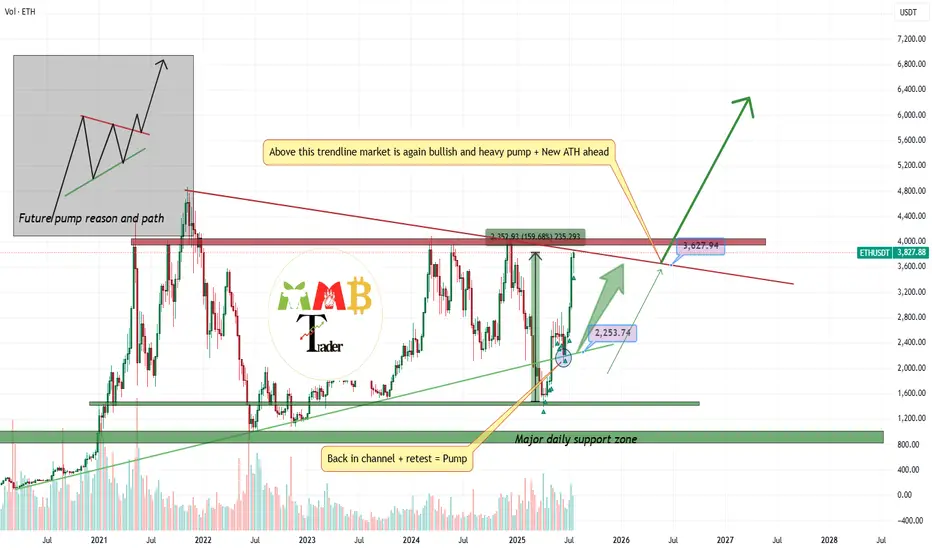
ETHUSDT market is ready to explode and PumpAs we mentioned before Price is now near weekly resistance and range and even short-term fall here is expected but this time i am looking for breakout to the upside and huge pump after that like the green arrows on chart.
So get ready and wait for that breakout and next phase of bull run to start soon.
DISCLAIMER: ((trade based on your own decision))
<<press like👍 if you enjoy💚
Gold Potential UpsidesHey Traders, in tomorrow's trading session we are monitoring XAUUSD for a buying opportunity around 3,320 zone, Gold is trading in an uptrend and currently is in a correction phase in which it is approaching the trend at 3,320 support and resistance area.
Trade safe, Joe.

Bearish potential detected for SDFEntry conditions:
(i) lower share price for ASX:SDF along with swing of DMI indicator towards bearishness and RSI downwards, and
(ii) observing market reaction around the share price of $5.89 (open of 20th June).
Stop loss for the trade would be:
(i) above the potential prior resistance of $6.08 from the open of 4th December 2024, or
(i) above the potential prior resistance of $6.19 from the open of 3rd July 2024, depending on risk tolerance.

Bullish potential detected for WDSEntry conditions:
(i) higher share price for ASX:WDS along with swing up of the DMI indicators and swing up of the RSI indicator, and
(ii) observation of market reaction at the support/resistance level at $24.87 (from the open of 14th February).
Stop loss for the trade would be, dependent of risk tolerance (once the trade is activated):
(i) below the support level from the open of 15th July (i.e.: below $23.95), or
(ii) below the recent swing low of 30th June (i.e.: below $23.24).
NOTE: Positive momentum move on 23rd July already in play (suggested not to chase this initial move and await a retracement back towards the support/resistance level of $24.87 and observe the market reaction - potentially overbought with resistance above current price area of $26.20 as at 25th July). If the move keeps going, let it go.

Nifty Analysis EOD – July 25, 2025 – Friday🟢 Nifty Analysis EOD – July 25, 2025 – Friday 🔴
"When the tide goes out, you discover who’s been swimming naked." – Warren Buffett
Nifty GapDowns Below Key Support and Slips Further
The market opened with a sharp GapDown, breaching the previous day's low and instantly shedding 150 points within the first hour. Nifty attempted to find footing near the crucial 21st July low zone of 24,850–24,880, but the support gave way, slipping an additional 50 points.
The day mostly drifted around these lower levels with bearish dominance. Though bulls made an effort to recover late in the session, it lacked strength. The index finally settled at 24,837, decisively closing below the 21st July low — signalling a deeper structural breakdown.
📉 Trend & Zone Update
Resistance Zone Shifted To: 25,144 ~ 25,155
Support Zone Shifted To: 24,729 ~ 24,755
📊 What If Plans – 28th July Outlook
🅰️ Plan A (Contra Long Setup)
If market opens inside the previous day range and finds support at 24,815 ~ 24,850
Then potential targets are 24,920, 24,965, and 25,020
🅱️ Plan B (Trend is Friend – Short Continuation)
If market opens inside range and faces resistance around 24,965 ~ 24,995
Then aim for 24,850, 24,815, 24,780, and 24,730
⏸️ On-the-Go Plan
If market Gaps Up/Down outside previous day’s range
Then wait for the Initial Balance (IB) to form and act based on structure and S/R levels.
🕯 Daily Time Frame Chart with Intraday Levels
🕯 Daily Candle Breakdown
Open: 25,010.35
High: 25,010.35
Low: 24,806.35
Close: 24,837.00
Candle Structure
Body: Strong red candle (−173.35 pts)
Upper Wick: None (open = high)
Lower Wick: 30.65 pts
Interpretation:
A textbook bearish Marubozu — shows sellers had control throughout.
Bears stepped in immediately from open, preventing any bullish response.
Minimal lower wick implies limited buyer defense even at the session low.
Key Insight:
Bears are in command; bulls must reclaim 25,000+ quickly to prevent further downside.
If 24,800–24,820 breaks, eyes shift to 24,700–24,750 zone next.
🛡 5 Min Intraday Chart
⚔️ Gladiator Strategy Update
ATR: 192.95
IB Range: 87.4 → Medium
Market Structure: Imbalanced
Trades Triggered:
🕙 10:10 AM – Short Entry → 🎯 Target Hit (1:2.4 R:R)
🧭 Support & Resistance Levels
Resistance Zones
24,920
24,965
24,995 ~ 25,018
25,080
25,140 ~ 25,155
Support Zones
24,780
24,755 ~ 24,729
24,640
📌 Final Thoughts
When strong candles appear back-to-back with no meaningful recovery in between, it’s not just a correction — it’s a statement. In this market phase, reacting to price structure rather than assumptions will keep you on the right side. Stay nimble, stay prepared.
✏️ Disclaimer
This is just my personal viewpoint. Always consult your financial advisor before taking any action.

Beyond ICT & SMC: The Mathematical Revolution in Zone TradingIn the world of trading, there's a fundamental divide between traders who rely on subjective interpretation and those who trust mathematical precision. While concepts like ICT (Inner Circle Trader), SMC (Smart Money Concepts), and naked chart analysis have gained popularity, they all share one critical flaw: they're based entirely on personal interpretation.
The Subjectivity Problem
Ask ten ICT traders to mark their Order Blocks, Fair Value Gaps, or Breaker Blocks on the same chart, and you'll get ten different answers. Why? Because these concepts rely on:
Personal bias in identifying "significant" levels
Subjective interpretation of market structure
Discretionary decision-making on what constitutes a valid setup
Emotional influence on analysis
The same issue plagues SMC, CRT (Candle Range Theory), time-based analysis, and naked chart trading. One trader's "liquidity grab" is another trader's "breakout." One person's "strong support" is another's "weak bounce zone."
The Mathematical Solution
This indicator eliminates this guesswork entirely. Instead of relying on subjective interpretation, it:
Calculates exact entry levels using mathematical formulas based on session params
Identifies precise support/resistance zones
Standardises signals across all timeframes, ensuring consistency whether you're on 1m or 15m charts
Removes emotional bias by using algorithmic detection of significant price levels
Numbers Don't Lie
While an ICT trader might debate whether a level is "mitigation" or "inducement," our indicator simply states: "Entry at 1.0847, Stop at 1.0832." No interpretation needed. No second-guessing. Just mathematical precision derived from actual price action.
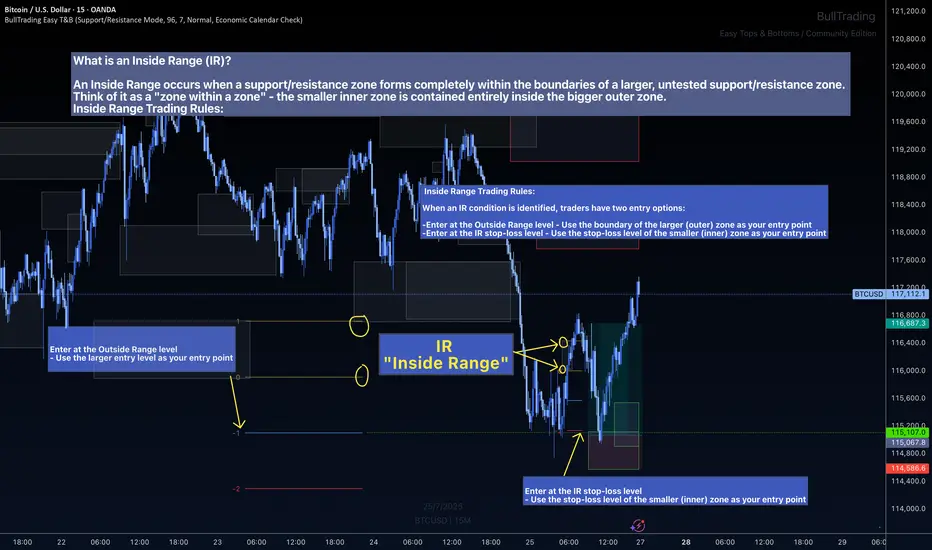
The Inside Range Advantage: When Zones Within Zones Create Superior Trading Opportunities
Most traders miss one of the most powerful setups in technical analysis: the Inside Range (IR). While ICT traders debate "nested order blocks" and SMC followers argue about "refined zones," you can easily identify Inside Ranges with this indicator and mathematically identify these high-probability setups with zero ambiguity.
What Makes Inside Ranges Special?
An Inside Range occurs when a new support/resistance zone forms completely within an untested larger zone. Think of it as the market revealing its hand twice – first showing you the broader area of interest, then pinpointing the precise level within it.
The Mathematical Edge
While discretionary traders struggle to identify these setups consistently, this indicator:
Automatically detects when a smaller zone forms within a larger untested zone
Calculates two precise entry options without any guesswork
Eliminates the confusion of nested levels that plague subjective analysis
Two Entries, Zero Confusion
Documentation and full trading system instructions can be found on the indicator's publication
When an IR forms, the indicator provides exactly two mathematically-derived entry options:
The Outside Range entry – Using the larger zone's entry level
The IR Stop-Loss entry – Converting the inner zone's stop level into an entry point
Compare this to SMC's "refined OB" or ICT's "nested FVG" concepts where traders endlessly debate which level is valid. With Inside Ranges, there's no debate – just two clear, calculated levels.
Inside Ranges represent areas where institutional interest overlaps. The larger zone shows initial interest, while the smaller zone within reveals refined positioning. By mathematically identifying these setups, you're trading where smart money has shown its hand twice.
Real Consistent Precision
Instead of squinting at charts trying to identify subjective "zones within zones," let mathematics do the heavy lifting.
In trading, consistency beats creativity. Stop drawing arbitrary lines and hoping for the best. Start trading with mathematical precision.
Documentation and full trading system instructions can be found on the indicator's publication →
Trade with confidence. Trust in mathematics. Trust in your Edge.
EURUSD: Detailed Support Resistance Analysis For Next Week
Here is my latest support & resistance analysis for EURUSD
for next week.
Consider these structures for pullback/breakout trading.
❤️Please, support my work with like, thank you!❤️
I am part of Trade Nation's Influencer program and receive a monthly fee for using their TradingView charts in my analysis.

GOLD (XAUUSD): Support & Resistance Analysis for Next Week
Here is my latest structure analysis and important
supports and resistances for Gold for next week.
Consider these structures for pullback/breakout trading.
❤️Please, support my work with like, thank you!❤️
I am part of Trade Nation's Influencer program and receive a monthly fee for using their TradingView charts in my analysis.

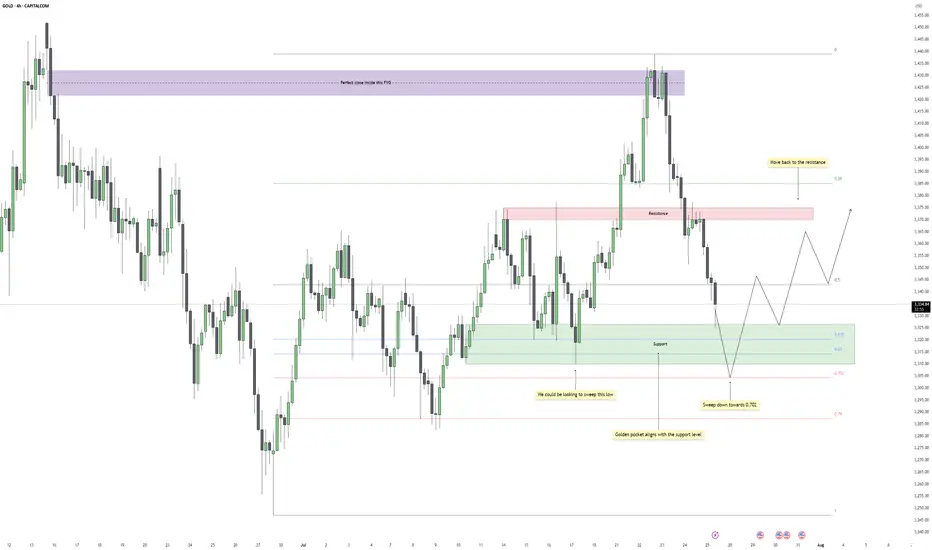
Gold - Eyes on the Final Flush Before ReclaimGold recently dropped after reacting perfectly inside a higher time frame fair value gap. That zone acted as clean supply, offering a precise close within the imbalance and initiating a strong bearish leg. The move confirmed that buyers were overwhelmed at that level, and price began its descent back into a broader consolidation range.
Support Cluster and Fibonacci Alignment
The current zone being tested holds significant weight. Price has tapped into a clear support region, one that has already caused multiple strong bounces in recent sessions. What adds further confluence is the alignment of this zone with the golden pocket region of the entire upward leg. This kind of technical overlap increases the chances of responsive buying once liquidity is cleared below.
Liquidity Target and Inducement Setup
Just below current price action, there's a clean low that hasn't been taken out yet. This low acts as the inducement, sitting right above deeper Fibonacci levels, especially the 0.702. If price continues lower in the short term, a sweep of that low into the golden pocket would provide the ideal liquidity grab before a reversal. The market often rewards those who wait for that final flush.
Bullish Recovery Path
Once the liquidity is taken and price stabilizes at the golden pocket zone, the path is open for a recovery move back into the midrange and potentially higher. The most likely magnet for price after a successful bounce would be the previous resistance zone, which coincides with the 0.5 retracement of the recent drop. That area should act as the next decision point and could either cap the rally or provide the base for a continuation if buyers show strength.
What I’m Watching
The cleanest scenario would be a sweep of the low just below support, ideally pushing into the lower green box near the 0.702 level, followed by a strong bullish reaction. I’ll be watching for a market structure shift on the lower timeframes at that point to confirm the entry. If that happens, the trade has room to develop back into the prior resistance zone, offering a solid range for intraday or swing setups.
Conclusion
Gold remains in a broader range for now, but the technicals suggest one more drop to clear late long positions before a recovery. The reaction at the support cluster will be crucial. If bulls step in after the sweep, there’s a high-probability path back toward resistance, with the move likely supported by the golden pocket confluence.
___________________________________
Thanks for your support!
If you found this idea helpful or learned something new, drop a like 👍 and leave a comment, I’d love to hear your thoughts! 🚀
ETHUSDBroke above H4 resistance and retested multiple times. Also broke above minor H1 resistance with a retest. Looking at 4,000 as main target

EURUSD BUYSEU is bullish. It has been consistently making HHs & HLs. I’d look for price to push towards the daily resistance @ 1.83000 then I’d look for price to push towards 1.19000.

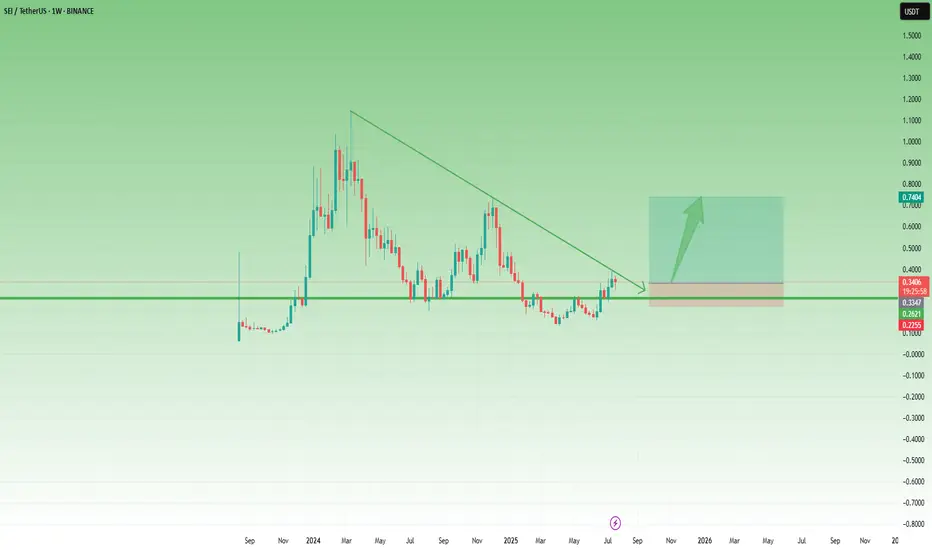
SEI Breakout Setup: Buy the Dip Before the Next Leg UpAfter the low around 0.13 in April, SEI started to recover, and although the first attempt to reclaim the 0.25–0.26 zone failed in mid-May, that key area—a former support from last year—was finally broken at the end of June.
Now, this previous resistance has turned into support, and even though gains have so far been capped by the falling trendline, price is consolidating above support – which could be a sign of bullish pressure building.
If we get a clean break above this descending trendline, momentum could accelerate, opening the way for a push toward the 0.75 resistance.
This is exactly the scenario I’m working with.
I'm looking to buy dips, with an ideal entry around 0.30, while keeping in mind that a move below 0.25 would invalidate the setup.
✅ Risk-reward? With a stop below 0.25, this setup offers a 1:4 R:R, and even a realistic chance at a 2x trade, which would be quite reasonable under current market conditions.
XAUUSD Gold closed bearish and I’ll continue looking for sells. I’d prefer gold to retrace and create a LH and continue selling towards 3310. Last time price was around 3310, it had a massive bullish run so that’ll be the only area I’d sell to unless price breaks that support.

USDJPY BULLISHUJ closed bullish last week so I’ll continue looking for buys this week. There was a daily double bottom & 50% Retracement on the daily timeframe. I would like for price to either break the H4 resistance, form a HL then look for buys. Or price could retrace and form a HL the I’ll look for buys towards daily resistance @149.190 then my next TP will be 151.00

GBPUSD SHORTSPrice closed the week bearish. There’s a daily head and shoulders pattern as well. Looking for price to continue bearish towards daily support. I’d like for price to retrace and create a LH before looking to get back into shorts.

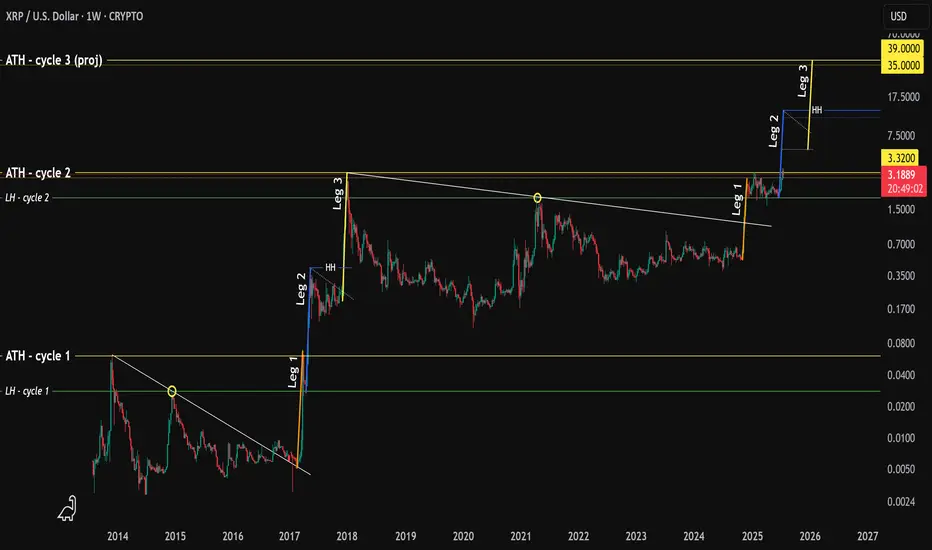
XRP - history repeating?Hello.
I'm going to walk you through what happened in the early years of XRP p.a. and how this fractal might play out today.
Here's what happened.
1. A high was printed in 2013 (ATH)
2. Followed by a lower high (LH)
3. XRP broke out of a downtrend 📈
4. In 2017 price increased 1,280% finding resistance @ ATH (we'll call this "Leg 1")
5. The LH then acted as support, followed by sideways price movement
6. Price increased 1,460% creating a higher-high (or "HH") which surpassed the ATH and this is "Leg 2"
7. Again, sideways price movement.
8. An increase of 1,560% creating a new ATH Dec 2017 - "Leg 3"
What's interesting here is that each leg takes 5 weeks to play out (that's 5 green weekly candles to put a finer point on it).
Fast forward in time - what do we see?
A high..
A lower high....
A breakout of the downtrend..
Followed by..... you guessed it... 5 green weekly candles
Hold on...
A rejection at the ATH
The LH acting as support...
With sideways movement .. 👀
The symmetry is quite profound and provides us with an idea of what will happen next.
If we consider the move in Nov 2024 as "Leg 1" then one could argue that "Leg 2" is currently in play.
Leg 1 was not as significant as the uplift we saw in 2017 (480% vs 1,280%)
However, if we assume that the variance between Leg 1 and Leg 2 rhymes then the projected uplift from the LH would be 550%.. making XRP price roughly $11-13
It follows that price will then move sideways/consolidate/capitulate for several months.
Followed by one last move to the upside which, using the variance between Leg 2 and Leg 3 put the final leg @ 585% or $35-39.
Wild guess but based on historical Bitcoin halving peaks and XRP ATH in both cycle 1 and 2 landed at the back end of Q4, it is assumed the same could happen (put simply: the end of 2025).
You're welcome.
Xauusd (GOLD)Price need to do some breakout resistance before it can go up. I still bias for long until price tell me that i need to against my analysis.
-4thur

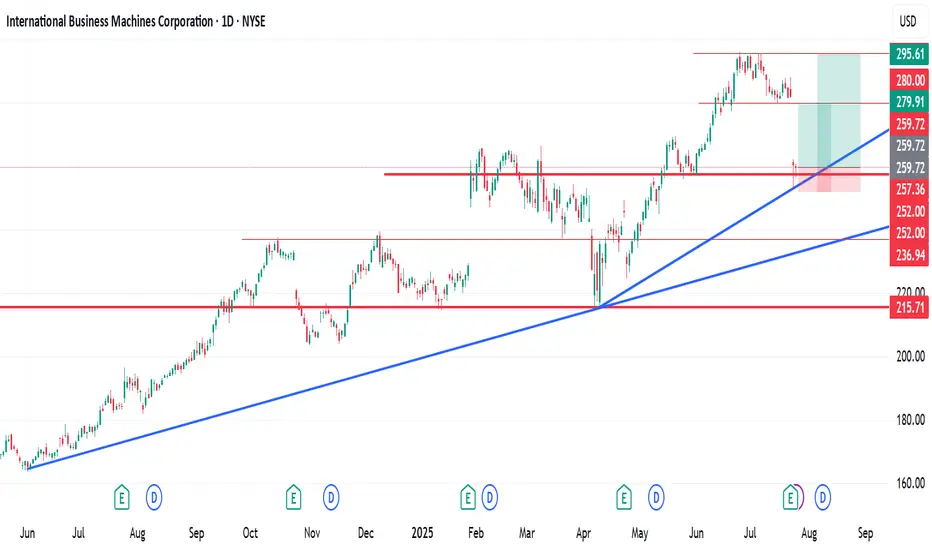
IBM Stock Forecast and Technical OutlookIBM Stock Forecast and Technical Outlook.
International Business Machines Corporation (IBM) reached a recent peak in June 2025 before experiencing a gradual decline. On July 24th, the stock saw a significant drop of over 10%, likely triggered by investor reaction to recent company news or broader market sentiment.
Despite this sharp decline, technical indicators on my chart suggest the potential for a short- to medium-term recovery. Based on my analysis, there are two potential setups with favourable Risk-to-Reward (R:R) ratios:
Scenario 1: R:R of 1:2.63
Scenario 2: R:R of 1:4.65
I bought some shares at $260.17
These figures indicate that for every unit of risk taken, there is a potential return of 2.63x or 4.65x, respectively, depending on the chosen entry and exit strategy.
As always, investors are advised to conduct their due diligence and apply proper risk management techniques before entering any position.
Hey friends, if this is helpful, kindly like, follow, subscribe, share and comment
IQUSDT – Patience Over PredictionThe blue box stands out as a reasonable area to look for inclusion.
No need to anticipate, just prepare.
✅ Plan of Action
Once price reaches the blue box:
Switch to 1H timeframe
Look for upward breakouts
Confirm with CDV supporting the move
If all align, I’ll act.
If not, I won’t force it.
“The opportunity isn’t missed, it just hasn’t matured yet.”
Let others rush.
I'll wait for value, structure, and confirmation.
📌I keep my charts clean and simple because I believe clarity leads to better decisions.
📌My approach is built on years of experience and a solid track record. I don’t claim to know it all but I’m confident in my ability to spot high-probability setups.
📌If you would like to learn how to use the heatmap, cumulative volume delta and volume footprint techniques that I use below to determine very accurate demand regions, you can send me a private message. I help anyone who wants it completely free of charge.
🔑I have a long list of my proven technique below:
🎯 ZENUSDT.P: Patience & Profitability | %230 Reaction from the Sniper Entry
🐶 DOGEUSDT.P: Next Move
🎨 RENDERUSDT.P: Opportunity of the Month
💎 ETHUSDT.P: Where to Retrace
🟢 BNBUSDT.P: Potential Surge
📊 BTC Dominance: Reaction Zone
🌊 WAVESUSDT.P: Demand Zone Potential
🟣 UNIUSDT.P: Long-Term Trade
🔵 XRPUSDT.P: Entry Zones
🔗 LINKUSDT.P: Follow The River
📈 BTCUSDT.P: Two Key Demand Zones
🟩 POLUSDT: Bullish Momentum
🌟 PENDLEUSDT.P: Where Opportunity Meets Precision
🔥 BTCUSDT.P: Liquidation of Highly Leveraged Longs
🌊 SOLUSDT.P: SOL's Dip - Your Opportunity
🐸 1000PEPEUSDT.P: Prime Bounce Zone Unlocked
🚀 ETHUSDT.P: Set to Explode - Don't Miss This Game Changer
🤖 IQUSDT: Smart Plan
⚡️ PONDUSDT: A Trade Not Taken Is Better Than a Losing One
💼 STMXUSDT: 2 Buying Areas
🐢 TURBOUSDT: Buy Zones and Buyer Presence
🌍 ICPUSDT.P: Massive Upside Potential | Check the Trade Update For Seeing Results
🟠 IDEXUSDT: Spot Buy Area | %26 Profit if You Trade with MSB
📌 USUALUSDT: Buyers Are Active + %70 Profit in Total
🌟 FORTHUSDT: Sniper Entry +%26 Reaction
🐳 QKCUSDT: Sniper Entry +%57 Reaction
📊 BTC.D: Retest of Key Area Highly Likely
📊 XNOUSDT %80 Reaction with a Simple Blue Box!
📊 BELUSDT Amazing %120 Reaction!
📊 Simple Red Box, Extraordinary Results
📊 TIAUSDT | Still No Buyers—Maintaining a Bearish Outlook
📊 OGNUSDT | One of Today’s Highest Volume Gainers – +32.44%
📊 TRXUSDT - I Do My Thing Again
📊 FLOKIUSDT - +%100 From Blue Box!
📊 SFP/USDT - Perfect Entry %80 Profit!
📊 AAVEUSDT - WE DID IT AGAIN!
I stopped adding to the list because it's kinda tiring to add 5-10 charts in every move but you can check my profile and see that it goes on..

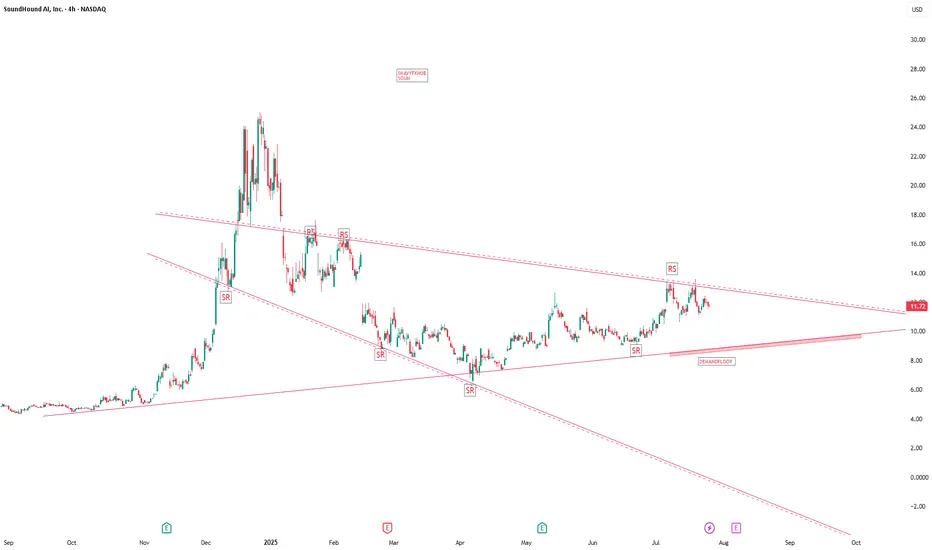
SOUNSoundHound AI — Company Overview and Latest Developments (July 2025)
What Is SoundHound AI?
SoundHound AI, Inc. (Nasdaq: SOUN) is a leading voice artificial intelligence (AI) company headquartered in Santa Clara, California. Founded in 2005 by Stanford graduates, it has evolved from music recognition app Midomi (later rebranded SoundHound) to a global innovator in conversational voice AI.
What Does SoundHound Do?
The company develops an independent voice AI platform that powers conversational interfaces for businesses across automotive, TV, IoT, restaurant, customer service, healthcare, retail, finance, and more.
SoundHound's platform allows enterprises to create custom voice assistants, voice-enable products, deliver hands-free customer service, and gather valuable conversational analytics.
Key Products and Technologies
Product/Technology What It Does
Houndify Platform Suite of APIs, SDKs, and tools for building custom voice and conversational assistants for enterprise, auto, and consumer tech.
SoundHound Chat AI Advanced conversational assistant integrating generative AI and real-time data (weather, stocks, restaurants, etc.).
Smart Ordering AI-driven ordering for restaurants (drive-thru, kiosk, phone, and in-car).
Dynamic Drive Thru End-to-end voice interactions for fast-food and QSR environments.
Smart Answering Automated, always-available phone agent for customer calls.
Voice Commerce Ecosystem for ordering, payments, and pickup, notably powering new in-vehicle ordering.
Employee Assist AI agent to help staff with information, ordering, and support tasks.
Tech Stack Proprietary Speech-to-Meaning®, Deep Meaning Understanding®, Natural Language Understanding (NLU), ASR, TTS, Edge/Cloud.
Supports 25 languages and holds over 250 patents in conversational AI technologies.
Branded wake words, cloud/edge integration, and automatic content recognition are key differentiators.
Recent News & Major Highlights (2025)
CES 2025 Launch: Unveiled the industry’s first in-vehicle voice assistant enabling on-the-go food ordering—lets drivers order and pay for meals directly from car infotainment systems.
Restaurant Industry Expansion: Live demos at the National Restaurant Association Show showcased drive-thru, phone, kiosk, and in-car voice ordering, with AI now powering ordering in 10,000+ restaurant locations.
Acquisitions: Recently acquired Amelia (enterprise automation software) and Synq3 Restaurant Solutions, boosting its capabilities and reach in both enterprise and hospitality sectors.
Automotive & Enterprise Traction: Now in 20+ auto brands and sectors like healthcare, finance, and utilities, with strategic partnerships like OpenAI-powered voice AI in Stellantis vehicles.
Financial Growth: Company reports strong cash position ($200M, no debt), expects EBITDA positivity by year-end, and projects robust growth with expanding voice commerce opportunities.
Revenue Model and Growth
SoundHound's business relies on royalty licensing (hardware voice enablement), recurring subscriptions (for services like restaurant AI), and voice commerce (cut from voice-enabled orders), with growing adoption in cars, devices, and quick-service restaurants.
Summary:
SoundHound AI is a top player in the conversational AI space, voice-enabling products and services for enterprises worldwide, especially in automotive, retail, and hospitality. Its latest innovations—like in-car food ordering and expanded restaurant solutions—reflect aggressive growth and increasing real-world impact for AI-powered voice technology