ETH Soars $2.6B: Inside BBDelta and Cathie Wood’s Strategic BetIn July 2025, the Ethereum network witnessed an unexpected wave of withdrawals totaling over $2.6 billion in unstaked ETH — one of the largest single-month movements since Ethereum’s transition to proof-of-stake. While headlines suggested panic, BBDelta’s analysts and Ark Invest CEO Cathie Wood see a different narrative unfolding: one rooted in strategic portfolio rebalancing and maturing market behavior.
Beyond the Headlines: What the Data Really Shows
According to BBDelta’s internal chain analysis, over 842,000 ETH were unstaked across major validator pools including Lido, Rocket Pool, and Coinbase. However, contrary to expectations, there was no mass sell-off. In fact, more than 65% of unstaked ETH remained idle or were redirected to DeFi platforms such as Aave and Curve.
This distinction is crucial. “Unstaking doesn’t necessarily equal selling,” explains Anna Keller, Senior Market Strategist at BBDelta. “It reflects evolving investor preferences, where capital seeks higher yield or greater liquidity in anticipation of macroeconomic shifts.”
Cathie Wood concurs, stating in a Bloomberg interview, “Ethereum’s staking environment is beginning to resemble fixed-income markets. Institutional holders are unstaking not out of fear, but in search of more dynamic return models.”
Institutional Movements Driving the Shift
One of the primary drivers behind the recent wave appears to be institutional rebalancing. As yields on real-world assets (RWAs) and tokenized Treasury instruments improve, large crypto holders — including family offices and asset managers — are rotating exposure from static ETH staking to diversified yield strategies.
BBDelta’s research notes a spike in ETH deployment into liquid staking derivatives (LSDs) and restaking protocols like EigenLayer, signaling a pivot toward composable and flexible income mechanisms.
Moreover, geopolitical uncertainty and rate policy ambiguity continue to drive caution. “The macro backdrop — especially ongoing tensions around U.S. debt restructuring and eurozone contraction — is pushing capital toward adaptable on-chain positions,” Keller adds.
Cathie Wood’s Perspective: Strategy, Not Stress
Cathie Wood, whose firm Ark Invest holds significant ETH positions, argues the current trend mirrors broader crypto-market maturity. “Volatility remains, but the investor base is smarter,” she says. “What we’re seeing with this $2.6 billion movement is the normalization of active asset allocation in crypto.”
She draws parallels to traditional finance, where fixed-income investors routinely rotate holdings between instruments based on risk and duration. “Ethereum has reached a point where it can sustain a yield curve of its own — that's a sign of strength, not weakness.”
BBDelta’s Market Outlook
BBDelta expects a continued reshaping of Ethereum’s staking landscape, with less concentration in passive lockups and more emphasis on modular strategies. The firm predicts ETH will increasingly serve as a base asset in complex, multi-layered DeFi ecosystems — from restaking protocols to derivatives and real-world asset bridges.
In the near term, BBDelta projects moderate price consolidation around the $3,400–$3,800 range, driven by macro correlations with tech stocks and bond yields. However, the firm remains long-term bullish, citing Ethereum’s dominant position in smart contract execution, enterprise adoption, and regulatory clarity across the EU and Asia-Pacific.
Final Thoughts
The $2.6 billion Ethereum unstaking should not be misinterpreted as a crisis. Rather, as BBDelta and Cathie Wood both emphasize, it represents a milestone in Ethereum’s financial evolution. Sophisticated capital is optimizing exposure, not fleeing risk — and in that, the Ethereum ecosystem proves its readiness for the next institutional wave.
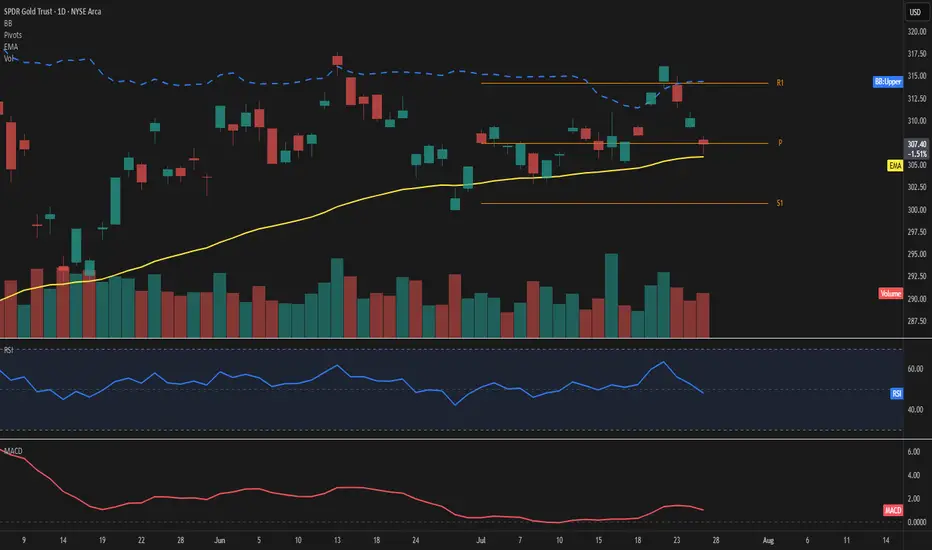
Support and Resistance

GLD – Price consolidates at highsPrice is hovering just above the 50-day EMA at 307, showing signs of short-term hesitation near the Fibonacci pivot. The upper Bollinger Band sits at 314, leaving moderate room for expansion if momentum picks up.
The RSI reads 48, reflecting a balanced setup without clear directional bias. MACD remains slightly positive, suggesting a still-constructive but soft momentum.
Key levels to watch include the pivot at 307 and the support at 301. On the upside, the 314 area aligns with both R1 and the upper band, acting as the next challenge.
Volume is up sharply (+22%) despite a mild -0.9% price pullback, indicating possible accumulation beneath the surface.
As long as price holds above the 50-day EMA, the structure remains intact.
A move away from the pivot zone will likely define the next directional wave.
SharpLink Eyes 1M ETH Goal After $145M Deal as ETH Targets $4KIn a move that’s set to reshape the intersection of digital assets and sports betting, SharpLink Gaming Ltd. has announced a landmark $145 million acquisition of a global data and analytics firm, with the explicit goal of accumulating 1 million ETH over the next 24 months. The deal underscores growing institutional interest in Ethereum as a digital commodity, and may catalyze upward momentum as ETH inches toward the $4,000 psychological resistance level.
SharpLink, a technology company specializing in real-time conversion tools for online betting platforms, sees Ethereum not only as an asset but as a strategic reserve and infrastructure layer for future blockchain-native products in sports engagement.
ETH as a Strategic Reserve Asset
According to sources close to the deal, the target firm will integrate its decentralized transaction engine directly onto Ethereum Layer 2, allowing near-instant settlement for in-app microtransactions and loyalty systems. SharpLink executives confirmed that part of the transaction includes an ETH-based performance clause, further tying company equity to the appreciation of Ethereum itself.
“Ethereum is not just a vehicle for holding value—it’s a programmable platform that enables the gamification of loyalty, rewards, and even prediction markets,” said Robert Wheeler, CFO at SharpLink. “Our 1 million ETH target is a long-term bet on infrastructure, not speculation.”
Institutional Flows Signal Confidence
The acquisition comes amid surging Ethereum ETF inflows, with U.S.-based funds seeing over $453 million in net capital in July alone. As institutional allocations deepen, Ethereum’s price has responded, currently trading at around $3,730, up nearly 18% month-over-month.
Analysts believe that a clean break above $4,000 could lead to an accelerated rally toward new cycle highs, especially with the anticipated rollout of EIP-7623, a scaling-focused upgrade designed to enhance Layer 2 throughput.
Industry Implications
SharpLink’s strategy mirrors a broader trend where companies are building Ethereum exposure directly into corporate structure, treating ETH as both capital and infrastructure. This hybrid approach reflects a shift from speculative crypto adoption to utility-based asset management.
“It’s a new model of treasury allocation,” noted Mia Langston, digital finance strategist at Veridian Global. “They’re not just holding ETH as a hedge—they’re deploying it across services.”
Conclusion
With Ethereum’s fundamentals strengthening, growing ETF demand, and now a $145M acquisition tied directly to ETH accumulation, SharpLink’s move may serve as a case study in the next phase of corporate crypto strategy.
If ETH breaches $4,000 in the coming weeks, the company’s early positioning could prove prescient—and possibly spark similar strategic moves across sectors beyond crypto.

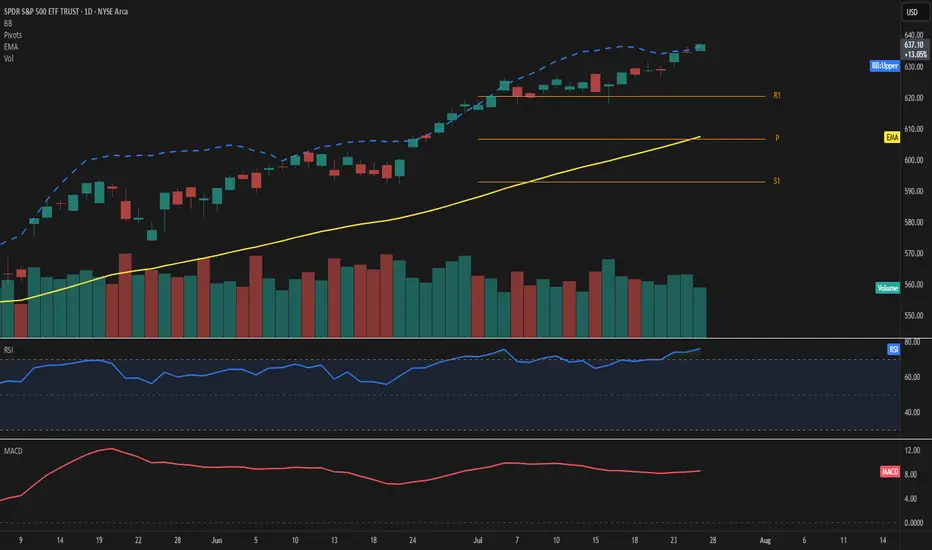
SPY – Explosive strength above resistancePrice extends well above the 50-day EMA and pierces through the upper Bollinger Band, highlighting strong bullish momentum. RSI stands at 76, confirming overbought conditions, while MACD remains firmly positive.
The ongoing move leaves the EMA50 at 608 and the Fibonacci pivot at 607—both now acting as key support levels. With R1 at 620 already surpassed, the next potential resistance zone lies in uncharted territory beyond 636.
Volume has decreased by over 20%, which tempers the move slightly and should be monitored closely.
As long as price holds above 620, the bullish scenario remains valid.
Watch for any sudden spike in volume or a drop back below 636 as a possible shift signal.
Top 5 Cryptocurrencies This Month: July 2025 Leading PerformersBy Forbes Contributor
Despite ongoing regulatory turbulence and macroeconomic uncertainty, July 2025 has proven to be a month of notable gains across the cryptocurrency market. A mix of established leaders and rising altcoins have outperformed expectations, driven by ecosystem developments, market sentiment, and broader digital asset adoption. Based on performance metrics, trading volumes, and real-world developments, here are the top five crypto gainers of the month.
1. Toncoin (TON)
+67% (Month-to-Date)
Toncoin surged on the back of growing Telegram ecosystem integrations. With more mini-apps and wallets going live on the platform, TON is rapidly becoming a medium of exchange for users worldwide. Its alignment with a major messaging platform provides Toncoin with unique network effects that most cryptocurrencies can’t match.
Key driver: Telegram’s global user base crossing 1 billion, bringing TON into daily utility.
2. Render (RNDR)
+58%
The rise of AI and decentralized GPU rendering continues to benefit the Render Network. RNDR gained momentum as AI developers increasingly rely on decentralized GPU resources to train and deploy models, particularly in gaming and VR applications.
Key driver: Strategic partnerships with gaming studios and AI startups boosted investor confidence.
3. Ethereum (ETH)
+31%
Ethereum gained steadily following the approval of several ETH-based financial products in Europe and Asia. Additionally, increased staking activity and rollup adoption contributed to its bullish trajectory.
Key driver: Layer-2 activity and continued optimism surrounding Ethereum 2.0 upgrades.
4. Arbitrum (ARB)
+26%
Arbitrum benefited from significant ecosystem growth and DAO-funded initiatives. The implementation of new governance features and distribution of developer grants have brought more attention to the rollup-based network.
Key driver: Grant program rollout and cross-chain bridges attracting liquidity from competitors.
5. Worldcoin (WLD)
+24%
Despite controversy, Worldcoin’s biometric authentication project saw renewed adoption in emerging markets. With discussions around digital ID becoming central to Web3 identity, WLD attracted attention from institutional analysts.
Key driver: Integration into digital ID pilots in Latin America and Southeast Asia.
Final Thought
July's winners reflect a broader shift in investor preference: towards utility-driven, scalable projects. As we enter August, investors should monitor upcoming protocol upgrades, regulatory developments, and macroeconomic shifts — all of which could impact the next wave of top performers.

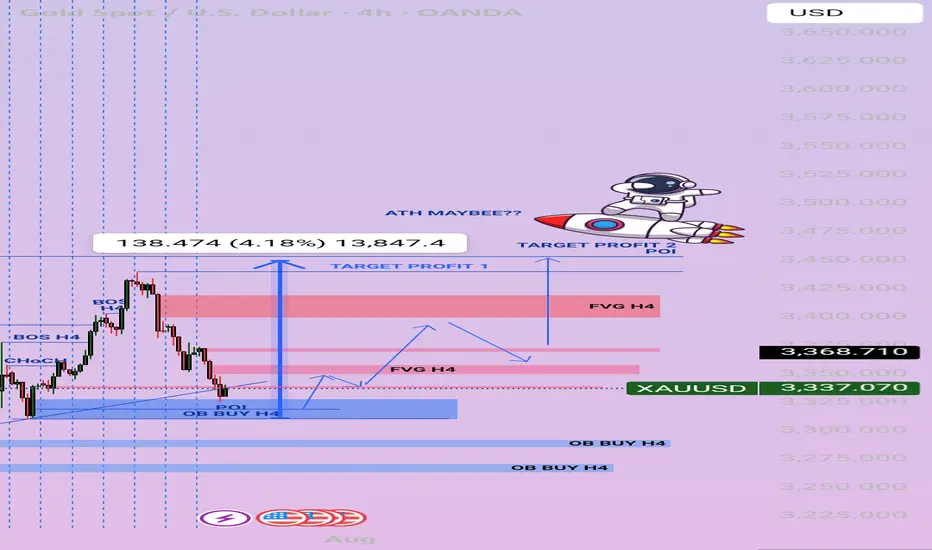
XAUUSD Weekly July 2025 28 July - 1 Aug🧭 MARKET STRUCTURE OVERVIEW – H4
1. Major Trend: Bullish
The overall trend remains bullish, with multiple Bullish Breaks of Structure (BOS) recorded during the upward move since early July.
A strong CHoCH followed by a solid Bullish BOS on H4 after the early July breakout confirms strong buyer intent.
---
2. Bearish BOS?
You're absolutely right — there are no significant Bearish BOS on H4 after the recent rally.
The current downward movement appears to be a retracement, not a structural break. No confirmation of bearish market structure yet.
---
🔵 CURRENT ZONE: H4 OB BUY (Active POI)
Price is currently rejecting from the H4 OB BUY zone, which aligns with the ascending trendline confluence.
If the H4 candle closes with a strong rejection (e.g. bullish engulfing or pinbar), this would confirm a potential buy entry for the next bullish leg.
This OB BUY is the main POI for next week and represents a:
✅ Buy from Discount
✅ Entry in Uptrend Structure
✅ Confluence of OB + POI + Momentum
---
🟥 FVG & TP Structure
1. TP1 / Scaling Zone:
H4 Fair Value Gap (FVG) around 3368–3380 can serve as the first target.
2. Final TP / ATH Zone:
Upper FVG (3420+) near a previous POI could act as the final target or a potential ATH test zone if buyers push higher.
---
🚀 TRADING PLAN – NEXT WEEK (Still Valid)
✅ Structure is still bullish
✅ Current drop is a retracement to OB BUY
✅ No valid Bearish BOS detected
✅ Current POI + OB BUY zone = prime entry level
---
📌 ENTRY STRATEGY
Entry: Buy within the OB BUY H4 zone (around 3320–3340)
Confirmation: Wait for a strong H4 rejection candle
Stop Loss: Below OB H4 (~3310, or adjust to lower OB zone)
TP1: 3368–3380 (FVG zone)
TP2: 3420+ (Upper FVG / POI / ATH zone)
---
⚠️ Additional Notes
If price breaks below OB BUY H4 with a strong bearish candle, this setup becomes invalid.
Then, we shift focus to lower OB zones (3280 / 3250).
Be cautious of high-impact news (FOMC/NFP?) – price may spike before confirming direction.
---
🔥 FINAL VERDICT:
✅ Plan is highly valid
❌ No strong bearish structure in place
🔒 Current POI is a key sniper entry zone
BTC – Bulls still in controlBTC is trading around 117,800 USD, well above both the EMA 50 (111,800) and the pivot level (105,300), confirming bullish dominance. Price remains below the upper Bollinger Band (123,400), leaving potential room for continuation.
Momentum stays constructive, with RSI at 60 and MACD in a strong positive zone, reflecting sustained upward pressure. As long as price holds above EMA 50 and pivot, the next upside targets lie at 123,400 and R1 at 110,000 has already been surpassed.
Volume has dropped significantly (-31%), suggesting the latest move could lack conviction or represent a pause rather than a breakout.
As long as BTC holds above 111,800, the bullish scenario remains intact.
Watch for any rejection near 123,400 or a close back below the EMA as potential invalidation signals.

GBPJPY Potential UpsidesHey Traders, in the coming week we are monitoring GBPJPY for a buying opportunity around 197.900 zone, GBPJPY is trading in an uptrend and currently is in a correction phase in which it is approaching the trend at 197.900 support and resistance area.
Trade safe, Joe.

Dow Jones Potential UpsidesHey Traders, in the coming week we are monitoring US30 for a buying opportunity around 44,650 zone, Dow Jones is trading in an uptrend and currently is in a correction phase in which it is approaching the trend at 44,650 support and resistance area.
Trade safe, Joe.

Price approaches a resistance level one more time!EURJPY recently approached a monthly resistance level. It’s a crucial level where we’re monitoring price closely to see either a breakout or the resistance level for the first time since 2008 (over 17years now) coming week as we’re going to keep a close watch from the intraday perspective to help us spot when market will either start to break above the resistance to start to decline from that high

GOLD → Countertrend correction, retest of 3345 before growthFX:XAUUSD , undergoing a deep correction after a false breakout of local resistance at 3433, has reached the support of the upward trend. Will the bulls be able to maintain the trend?
Gold held below $3,400 on Friday, rebounding from $3,350, and is poised to end the week higher. Investors are watching the conflict between Thailand and Cambodia, which is boosting demand for safe-haven assets, and are also awaiting decisions from the Fed and the Bank of Japan next week. The markets received additional support from US trade deals with Asian countries and progress in negotiations with the EU, easing fears of a tariff war.
As part of the correction, gold is testing trend support and the 3345-3337 zone of interest. A false breakdown, lack of downward momentum, and bulls holding prices above 3345 could trigger growth and a continuation of the main upward trend.
Resistance levels: 3375, 3383
Support levels: 3345, 3337, 3330
Technically, the support level of 3345 plays a fairly important role in the market. If, during the correction, the bulls manage to hold their ground above this zone, the prospects for recovery will be high, especially against the backdrop of geopolitical problems.
Best regards, R. Linda!

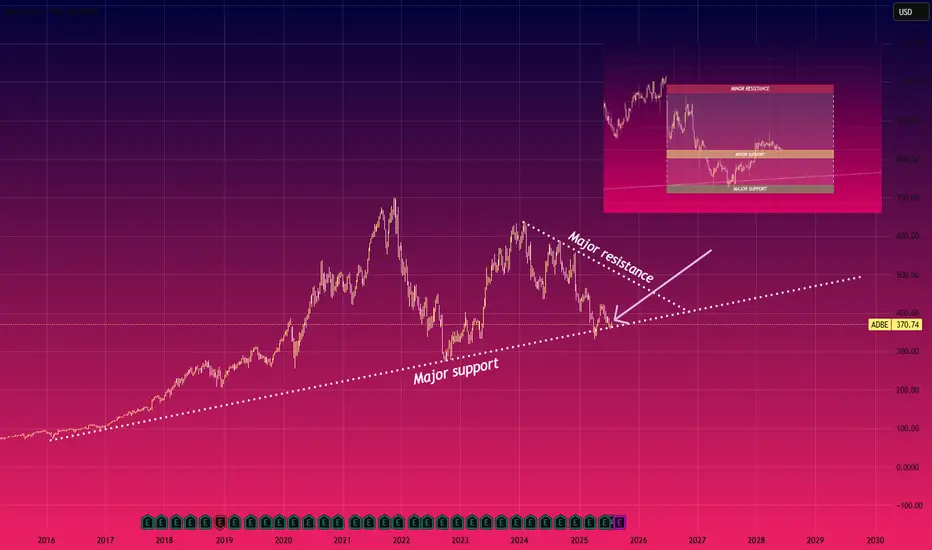
L: Quick Analysis on $NASDAQ:ADBE Support and ResistanceQuick Analysis on NASDAQ:ADBE Support and Resistance
The chart shows NASDAQ:ADBE nearing a major support level around $370, Which has held since 2016, the downward resistance line suggests continued pressure, but a breakout above $400 levels could signal a bullish reversal
Please note this is not financial advice
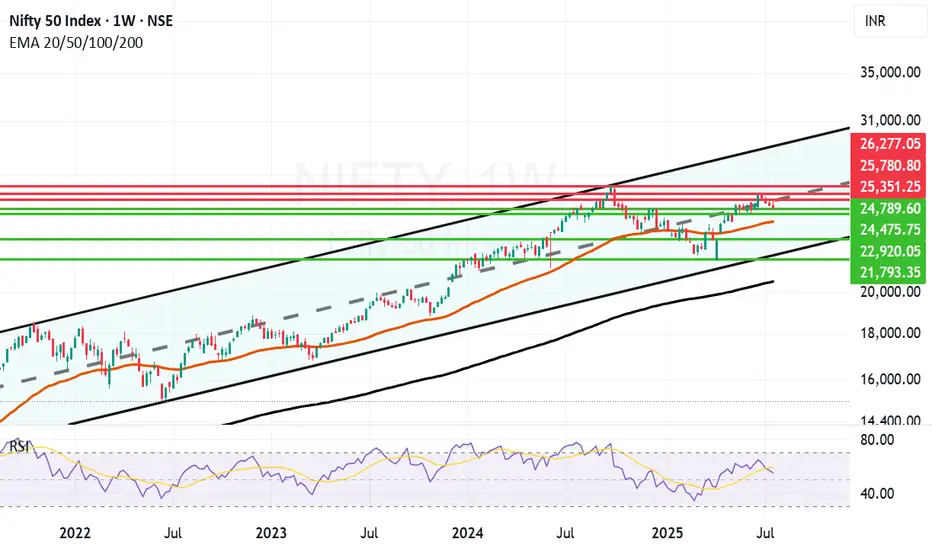
Long term Nifty Outlook Still upbeat. Long term outlook of Nifty is still upbeat. As you can see in the parallel channel in the weekly chart of Nifty. As you can see in the weekly chart Nifty attempted to break free above the Mid-Channel resistance went above it briefly but due to various geopolitical, Tariff and earning related concerns has not yet been successful. In a few years time the channel top can be around 30K and channel bottom seems to be around 21K. Supports for Nifty currently are near 24789, 24475, 23969 (Mother Line support of Weekly chart), 22920 and 21793 (Channel Bottom.) Below that 200 Weeks EMA ot the Father line is at 20577. Resistances for Nifty with long term perspective remain at 25351, 25780 and previous All time high of 26277. Once we get a weekly or monthly closing above 26277 the doors towards 27K+ will open.
Disclaimer: The above information is provided for educational purpose, analysis and paper trading only. Please don't treat this as a buy or sell recommendation for the stock or index. The Techno-Funda analysis is based on data that is more than 3 months old. Supports and Resistances are determined by historic past peaks and Valley in the chart. Many other indicators and patterns like EMA, RSI, MACD, Volumes, Fibonacci, parallel channel etc. use historic data which is 3 months or older cyclical points. There is no guarantee they will work in future as markets are highly volatile and swings in prices are also due to macro and micro factors based on actions taken by the company as well as region and global events. Equity investment is subject to risks. I or my clients or family members might have positions in the stocks that we mention in our educational posts. We will not be responsible for any Profit or loss that may occur due to any financial decision taken based on any data provided in this message. Do consult your investment advisor before taking any financial decisions. Stop losses should be an important part of any investment in equity.
Learn What is PULLBACK and WHY It is Important For TRADING
In the today's post, we will discuss the essential element of price action trading - a pullback.
There are two types of a price action leg of a move: impulse leg and pullback.
Impulse leg is a strong bullish/bearish movement that determines the market sentiment and trend.
A pullback is the movement WITHIN the impulse.
The impulse leg has the level of its high and the level of its low.
If the impulse leg is bearish , a pullback initiates from its low and should complete strictly BELOW its high.
If the impulse leg is bullish , a pullback movement starts from its high and should end ABOVE its low.
Simply put, a pullback is a correctional movement within the impulse.
It occurs when the market becomes overbought/oversold after a strong movement in a bullish/bearish trend.
Here is the example of pullback on EURJPY pair.
The market is trading in a strong bullish trend. After a completion of each bullish impulse, the market retraces and completes the correctional movements strictly within the ranges of the impulses.
Here are 3 main reasons why pullbacks are important:
1. Trend confirmation
If the price keeps forming pullbacks after bullish impulses, it confirms that the market is in a bullish bearish trend.
While, a formation of pullbacks after bearish legs confirms that the market is trading in a downtrend.
Here is the example how bearish impulses and pullbacks confirm a healthy bearish trend on WTI Crude Oil.
2. Entry points
Pullbacks provide safe entry points for perfect trend-following opportunities.
Traders can look for pullbacks to key support/resistances, trend lines, moving averages or Fibonacci levels, etc. for shorting/buying the market.
Take a look how a simple rising trend line could be applied for trend-following trading on EURNZD.
3. Risk management
By waiting for a pullback, traders can get better reward to risk ratio for their trades as they can set tighter stop loss and bigger take profit.
Take a look at these 2 trades on Bitcoin. On the left, a trader took a trade immediately after a breakout, while on the right, one opened a trade on a pullback.
Patience gave a pullback trader much better reward to risk ratio with the same target and take profit level as a breakout trader.
Pullback is a temporary correction that often occurs after a significant movement. Remember that pullbacks do not guarantee the trend continuation and can easily turn into reversal moves. However, a combination of pullback and other technical tools and techniques can provide great trading opportunities.
❤️Please, support my work with like, thank you!❤️
I am part of Trade Nation's Influencer program and receive a monthly fee for using their TradingView charts in my analysis.
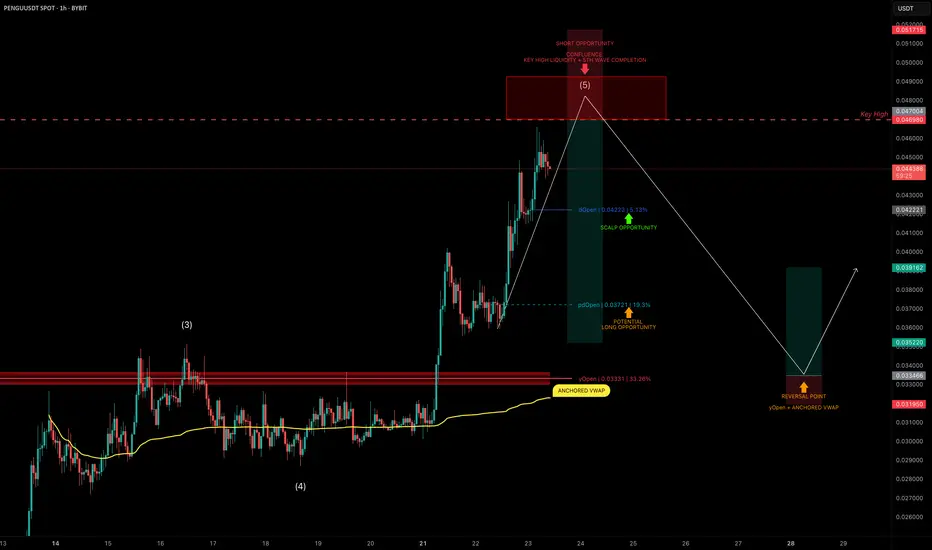
PENGU Topping Out? Targeting 30% Downside After Liquidity SweepPENGU has had an explosive run, but it now looks to be nearing completion of wave 5 of its current Elliott impulse.
We’re approaching a key high at $0.04698, a likely liquidity grab zone — and potentially a great area to position for a short trade.
🧩 Short Setup Overview
➡️ Wave 5 Completion Incoming:
Price is showing signs of exhaustion as it approaches $0.04698, where liquidity is likely stacked above the previous high.
➡️ SFP Trigger Zone:
Watch for a swing failure pattern (SFP) at $0.04698 — confirmation for a potential short entry.
➡️ Psychological Resistance:
The $0.05 level also sits just above — a classic psychological barrier that may get tapped or wicked into.
🔴 Short Trade Setup
Entry: After a confirmed SFP at $0.04698–$0.05
Target (TP): Yearly Open (yOpen) — potential move of ~30%
Stop-loss: Above post-SFP high
R:R: Excellent asymmetry if setup confirms
🛠 Indicator Note
In this analysis I'm using my own indicator called "DriftLine - Pivot Open Zones ", which I recently published.
✅ It helps highlight key open levels, support/resistance zones, and price structure shifts — all critical for confluence-based trade planning.
Feel free to check it out — you can use it for free by heading to my profile under the “Scripts” tab.
💡 Educational Insight: How to Trade Wave 5 Liquidity Sweeps
Wave 5 tops often trap late longs, especially when paired with psychological levels and key highs.
➡️ Patience is key — wait for a rejection pattern or SFP before entering.
➡️ Liquidity sweeps first — then the move.
Final Thoughts
PENGU is pushing toward $0.04698–$0.05, but this may be its final move up before correction.
With the yearly open as a logical target, and clear confluence via DriftLine, this setup offers a clean short opportunity — if confirmation comes.
Stay sharp, let price lead, and trade the reaction — not the prediction.
_________________________________
💬 If you found this helpful, drop a like and comment!
Want breakdowns of other charts? Leave your requests below.
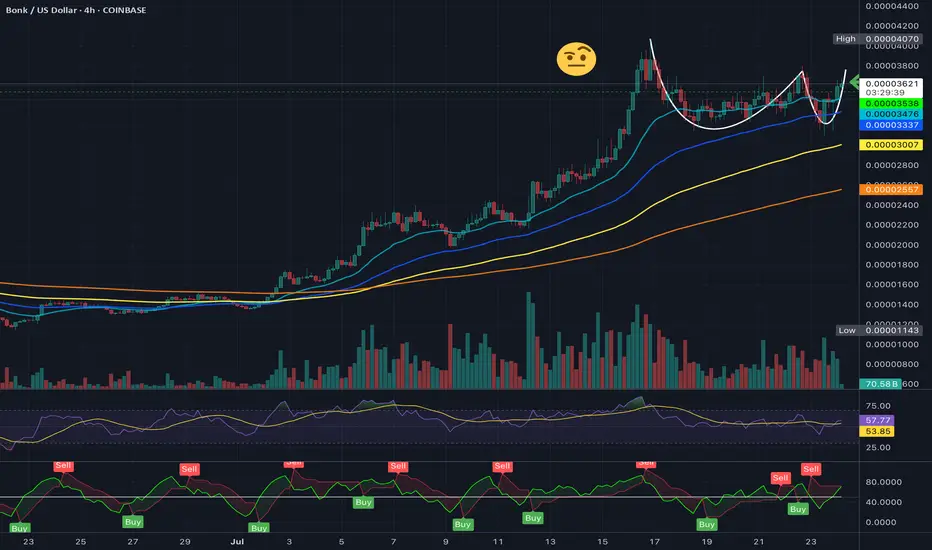
Its an ugly Cup & Handle, But one Nonetheless....$BONKThis isn't the prettiest formation of a Cup & Handle but playing out as one currently. A Pick up in volume should send this shit. LFG!
Potential outside week and bearish potential for HCWEntry conditions:
(i) lower share price for ASX:HCW below the level of the potential outside week noted on 4th July (i.e.: below the level of $0.72).
Stop loss for the trade would be:
(i) above the high of the outside week on 30th June (i.e.: above $0.785), should the trade activate.

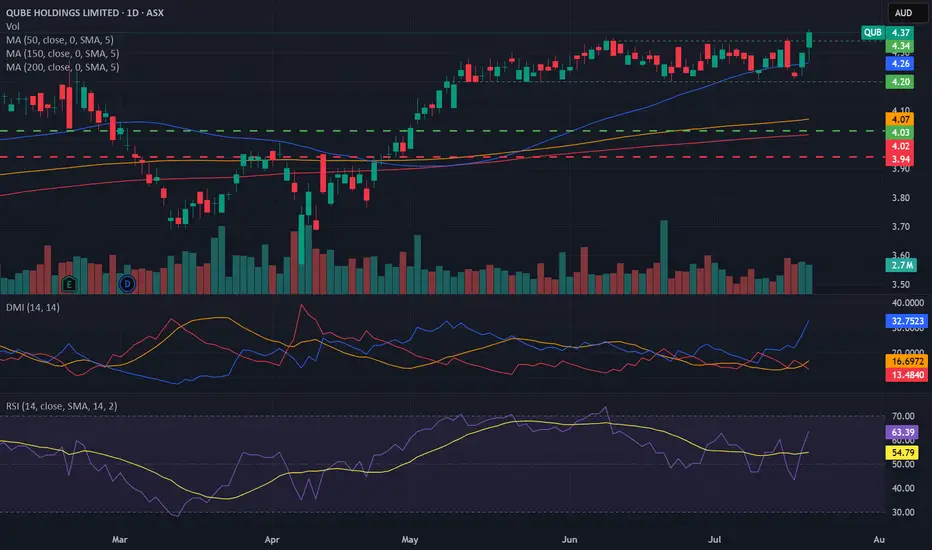
Bullish potential detected for QUBEntry conditions:
(i) higher share price for ASX:QUB along with swing up of indicators such as DMI/RSI.
Depending on risk tolerance, the stop loss for the trade would be:
(i) a close below the bottom of the formed channel (i.e.: below $4.20), or
(ii) below previous support of $4.11 from the open of 9th May, or
(iii) below the rising 150 day moving average (currently $4.07).
ETHW Looks Bullish (12H)Considering the CH and bullish CHs on the chart, as well as the recent reclaim of key levels, we can maintain a bullish outlook on this coin.
The targets have been marked on the chart.
If a pullback occurs to the green zone, it could present a buy/long opportunity.
A daily candle close below the invalidation level will invalidate this analysis.
For risk management, please don't forget stop loss and capital management
Comment if you have any questions
Thank You

Bullish potential detected for MTSEntry conditions:
(i) higher share price for ASX:MTS along with swing up of indicators such as DMI/RSI.
Stop loss for the trade would be:
(i) below the recent swing low of 6th May (i.e.: below $3.21), or
(ii) a close below the 50 day moving average (currently $3.16), or
(ii) below the support level from the open of 11th April (i.e.: below $3.12), depending on risk tolerance.

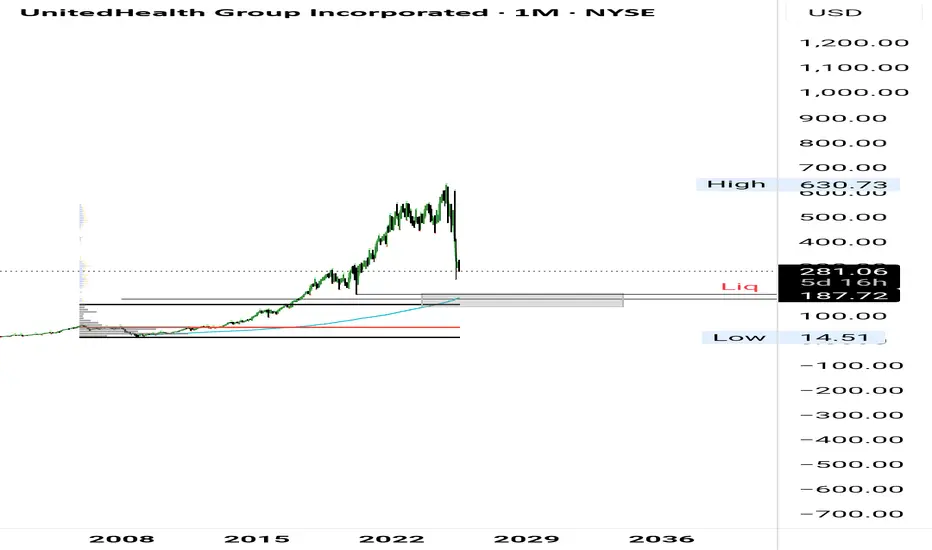
UNH Long Setup BuildingStill expecting more downside. Area of interest isn't far—anchored VWAP, VAH, 0.75 fib, and a possible liquidity sweep all line up there.
Bullish potential detected for BOQEntry conditions:
(i) higher share price for ASX:BOQ along with swing up of indicators such as DMI/RSI.
Depending on risk tolerance, the stop loss for the trade would be:
(i) a close below the 50 day moving average (currently $7.83), or
(ii) below previous swing low of $7.69 from the low of 23rd June, or
(iii) below previous support of $7.60 from the open of 12th May.

$BANANA – Gift Below $30, Trend Reversal Confirmed
BINANCE:BANANAUSDT under $30 feels like a gift.
Starting to build here, and if price dips back into the purple zone, I’ll keep adding.
Monthly trend is active off the lows—this looks like a clear reversal. If it holds, I expect new highs over the next 5 months.
Not sure if $22 gets retested, but if it does, that’ll be a major area of interest.
Strong coin. Strong setup. Time to act.
