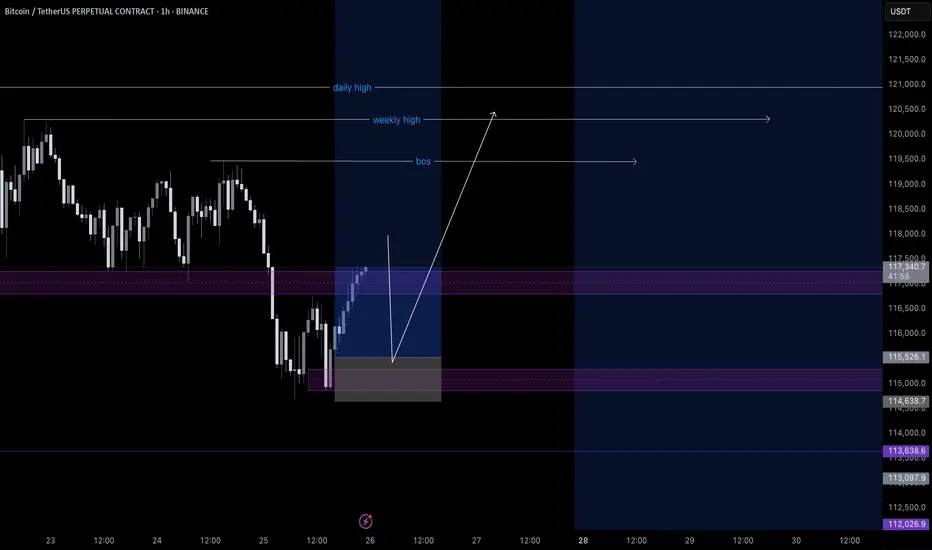
Bitcoin AnalysisWe have an order block in 1Hour TF, price can retest this before bullish continuation. If it breaks below bearish momentum continues.
Support and Resistance
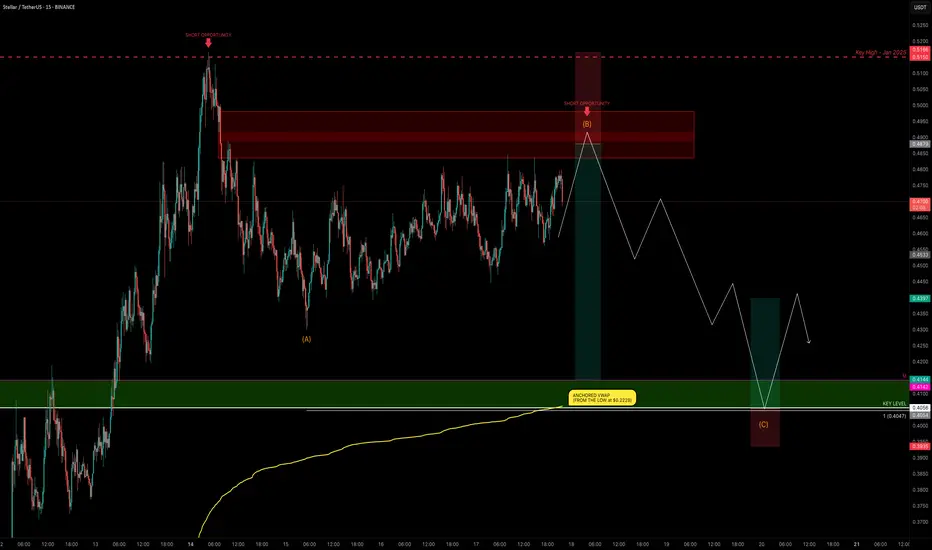
XLM Explodes +132% — Is the Party Over or Just Starting?XLM has been one of the top movers, sweeping the January 2025 swing high at $0.515 before stalling and moving sideways for the past 4 days.
Is XLM gearing up for another push toward the highs, or is a correction imminent?
Let’s dive into the details.
🧩 Market Structure & Fractal Pattern
XLM skyrocketed +132% in just 13 days, mirroring the explosive move seen back in November 2024.
If we apply the November fractal, the current price action suggests we could be setting up for an ABC corrective move.
📉 Key Levels & Confluences
FVG Zone: ~$0.49–$0.50 — likely to be swept before any major move down.
Monthly Support: $0.4142
Key Level / Liquidity Pool: $0.4056 — likely cluster of stop-losses.
Anchored VWAP (from $0.2228 start of trend): currently near $0.4056, adding strong confluence.
1.0 Trend-Based Fib Extension (ABC projection): If price pushes to ~$0.49 to complete wave B, the projected 1.0 TBFE for wave C lands right on the $0.4056 key level + VWAP, creating a perfect confluence zone.
➡️ Conclusion: The $0.4142–$0.4056 zone is a critical support and liquidity area with multiple confluences lining up.
Trade Setups
🔴 Short Setup:
Entry zone: $0.48–$0.50 (ladder in)
Stop-loss: Above $0.5166 (prior high)
Take-profit: $0.4142–$0.4056 zone
R:R ≈ 1:3
🟢 Long Setup:
Entry zone: $0.4142–$0.4056 (preferably near VWAP)
Stop-loss: Below $0.395
Take-profit: $0.44
⚡ Final Thoughts
Watch for a potential final push toward $0.49–$0.50 before a corrective wave unfolds.
The confluence at the $0.4142–$0.4056 zone — including monthly/weekly levels, VWAP, liquidity pool, and the 1.0 TBFE target — makes it a key area for decision-making.
Stay patient and wait for confirmation at these levels. Will post an update as things unfold!
_________________________________
💬 If you found this helpful, drop a like and comment!
Want breakdowns of other charts? Leave your requests below.
HBAR Game Plan: Short the Bounce, Long the Liquidity GrabHBAR has been moving strongly and is currently offering both short and long trade opportunities based on a clean potential ABC corrective pattern, key fib levels, volume profile, and anchored VWAP. Let’s break down the setup.
🧩 Technical Breakdown
Higher Timeframe Confluence:
0.618 fib retracement from the macro move
1.618 trend-based fib extension
1.272 VWAP band resistance
Point of Control (POC) from the visible range profile
This is marked as a major take profit/short opportunity zone.
For extra confluence, the negative fib extension golden pocket (-0.618 to -0.666) also aligns right at this resistance zone
Current Structure:
We’re potentially completing wave B of an ABC corrective move
Price has retraced into a high-probability short zone
🔴 Short Setup
Entry Zone:
Between the 0.702 and 0.786 fib retracement levels
Why Here?
0.702–0.786 fib retracement → short zone for reversals
Potential wave B top → setting up for a C leg down
Target (TP):
Around $0.25–$0.24, near the expected wave C completion
🟢 Long Setup
Entry Zone:
~$0.25–$0.24 area.
Why Here?
This zone is a strong confluence area:
➡️ 0.786 fib retracement
➡️ 1.0 trend-based fib extension of ABC
➡️ Anchored VWAP from the entire trend, offering dynamic support
➡️ Liquidity pool
➡️ Previous weekly Open
Plan:
Wait for price to complete wave C into this zone, then look for bullish reaction signs to enter long.
💡 Educational Insight
Why the 0.702–0.786 short zone?
These fib levels are often overlooked but are key “hidden” zones where wave B tops out before C waves.
Why anchored VWAP?
Anchored VWAP gives you dynamic institutional support/resistance, especially when aligned with fibs and liquidity.
Why wait for confirmation?
Blindly longing or shorting levels can trap you. Wait for SFPs, wick rejections, or lower timeframe structure flips to boost trade probability.
Final Thoughts
HBAR is in a highly interesting zone, offering both:
A short setup into the C wave,
And a long setup at the C wave completion, backed by multiple confluence factors.
Let the levels come to you and wait for confirmation!
_________________________________
💬 If you found this helpful, drop a like and comment!
Want breakdowns of other charts? Leave your requests below.

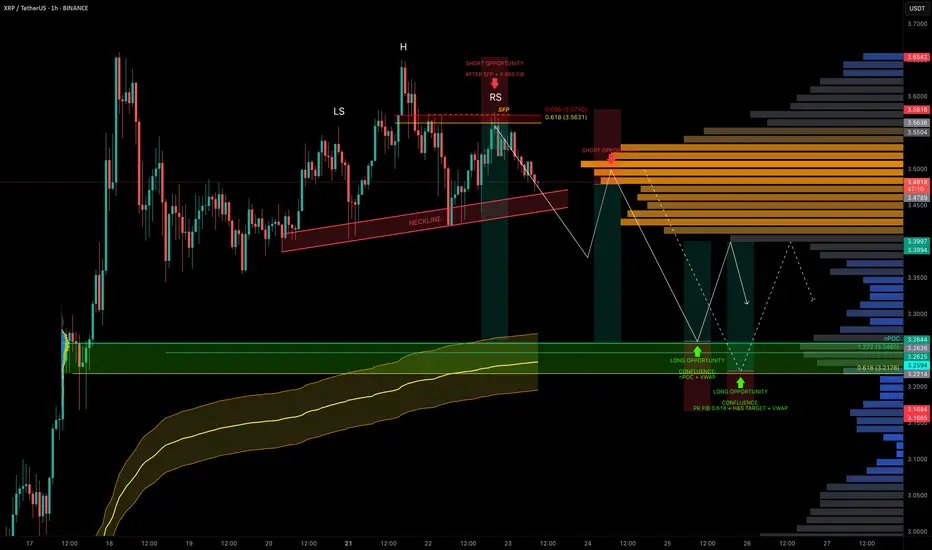
XRP Coiled in Range — Liquidity Below, Trade Setups AheadXRP has been stuck in a trading range around $3.50 for the past 5 days, offering multiple trade opportunities within the chop.
A notable short was triggered after a swing failure pattern (SFP) at the 0.666 fib retracement level near $3.563.
Now, with liquidity building to the downside, we’re watching closely for the next high-conviction setups.
🧩 Current Structure & Short Setup
🔴 Short Opportunity (Triggered):
SFP + 0.666 fib retracement at $3.563 led to rejection.
Market now shows a head & shoulders pattern forming.
Target: $3.2176 (0.618 fib retracement).
Trigger: Watch for a neckline break + retest for short confirmation.
Stop-loss: Above the right shoulder.
🟢 Long Setup:
Watching for a high-probability long around:
$3.26 → nPOC + 1.272 TBFE
$3.23 → anchored VWAP bands
This zone offers strong confluence and could act as the next launchpad.
Long Trade Plan:
Entry Zone: potential entries between $3.26–$3.22, price action needed for confirmation
Stop-loss: Below swing low at $3.1675
Target (TP): ~$3.40
✍️ Plan: Set alerts near the lows and react to price action at the zone — don’t front-run, let structure confirm.
💡 Pro Tip: Trade the Confluence, Not the Emotion
High-probability trades come from confluence, not guessing.
This setup combines nPOC, TBFE, VWAP, fib levels, and classical market structure (H&S) to map precise zones for both longs and shorts.
Let price come to you and wait for confirmation — especially in a rangebound environment where liquidity hunts are frequent.
Final Thoughts
We’re still rangebound, but liquidity is building below.
Keep an eye on the $3.26–$3.22 support zone for long entries and the H&S neckline for short breakdown confirmation.
_________________________________
💬 If you found this helpful, drop a like and comment!
Want breakdowns of other charts? Leave your requests below.
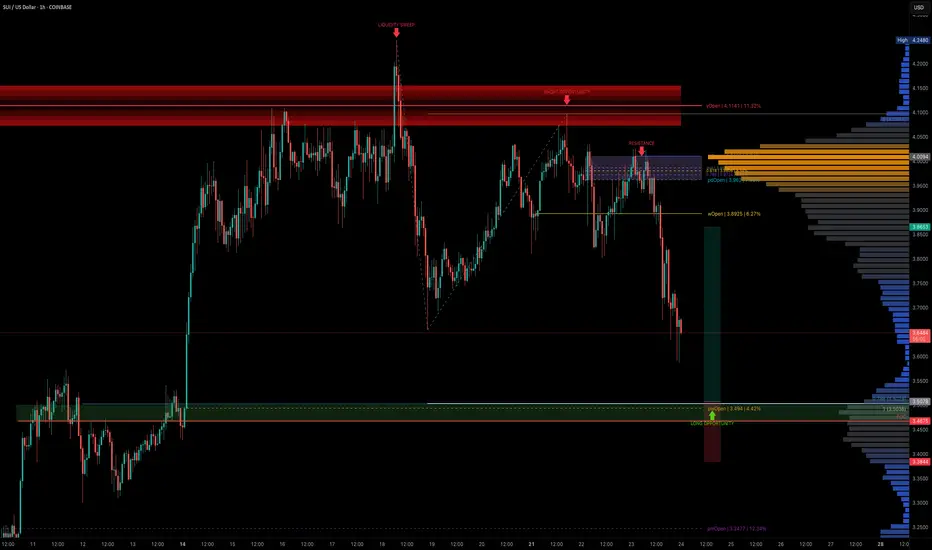
SUI — Structured Dip Buy Zone You Shouldn't IgnoreSUI has been technically clean, with well-respected Elliott Wave counts and fib levels.
As the broader market dips, it's time to look for sniper long entries and SUI is setting up beautifully for one around the $3.50 zone.
🧩 Key Confluence Zone: $3.50
This level offers a high-probability buy zone, backed by multiple layers of technical confluence:
0.786 Fib Retracement: $3.5029
1.0 Trend-Based Fib Extension: $3.5036
Previous Trading Range POC: $3.4675
Previous Weekly Open (pwOpen): $3.494
🟢 Long Trade Setup
Entry: ~$3.500
Stop-loss: $3.4675
Target (TP): $3.85+
R:R: ~1:3
🛠 Indicator Note
In this analysis I'm using my own indicator:
➡️ DriftLine — Pivot Open Zones
It helps identify key market opens (daily, weekly, prior), which often act as magnet levels and reaction zones.
➡️ You can use it for free — just check out my profile under “Scripts” and apply it to your charts.
💡 Pro Insight: Build Trades Where Tools Agree
A single level is just noise. But when fib retracements, extensions, POCs, opens, and price structure all line up — that’s where conviction trades are made.
The more overlap, the more likely the market reacts — this setup shows just that.
Final Thoughts
SUI is approaching a technically rich zone around $3.50, and this could be one of those low-risk, high-reward long entries if confirmed by price action.
With a clean invalidation and 1:3 R:R, this is the kind of setup you want to plan — not chase.
Set your alerts, stay patient, and trade with structure. 🚀✍️
_________________________________
💬 If you found this helpful, drop a like and comment!
Want breakdowns of other charts? Leave your requests below.
USDCAD Wave Analysis – 25 July 2025
- USDCAD rising inside sideways price range inside
- Likely to reach resistance level 1.3800
USDCAD currency pair recently reversed from the key support level 1.3575 (which is the lower boundary of the sideways price range inside which the price has been trading from June).
The upward reversal from the support level 1.3575 created the daily Japanese candlesticks reversal pattern Morning Star.
USDCAD currency pair can be expected to rise to the next resistance level 1.3800 (upper border of this sideways price range, top of wave (2)).

S&P 500 Index Wave Analysis – 25 July 2025
- S&P 500 Index broke key resistance level 6300.00
- Likely to rise to resistance level 6500.00
S&P 500 Index recently broke the key resistance level 6300.00 (which stopped the previous waves 5 and (B), as can be seen below).
The breakout of the resistance level 6300.00 continues the active intermediate impulse wave (5) from the middle of this month.
Given the strong daily uptrend, S&P 500 Index can be expected to rise to the next resistance level 6500.00 (coinciding with the daily up channel from May).

A GOOD SELL OPPORTUNITY FINALLY EMERGE ON EURGBPA good sell opportunity is what’s envisaged on EURGBP. Price has reached a high of 0.87387 therefore I expect some form of sell off as it’s already at the resistance level.

Toncoin Wave Analysis – 25 July 2025- Toncoin reversed from resistance level 3.5585
- Likely to fall to support level 3.0000
Toncoin cryptocurrency recently reversed down from the key resistance level 3.5585 (which is the upper boundary of the sideways price range inside which the price has been trading from April).
The key resistance level 3.5585 was strengthened by the upper daily Bollinger Band.
Given the strongly bearish crypto sentiment seen today, Toncoin cryptocurrency can be expected to fall to the next round support level 3.0000 (former resistance from the start of July).

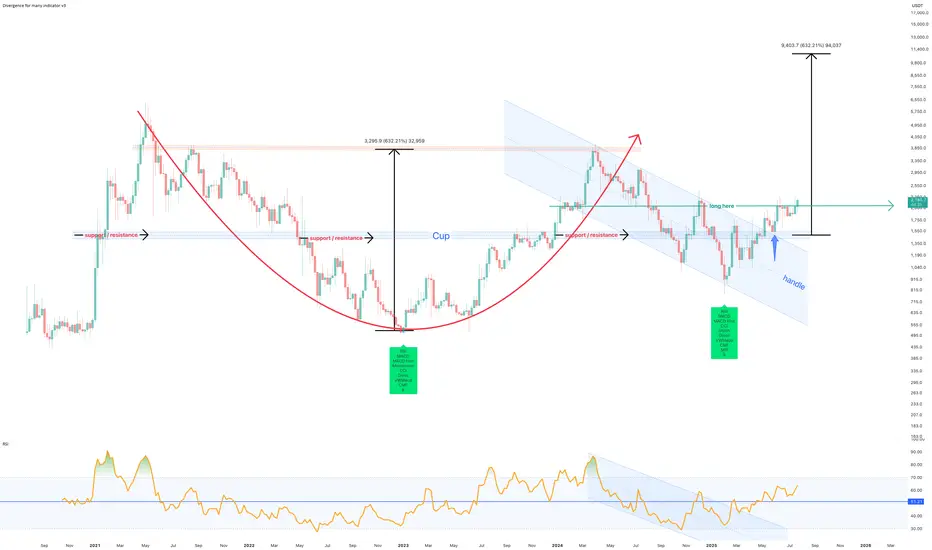
July 2025 - Marker DAO (MKR) to $10k before EthereumThe above forecast is predicted to strike before October 2025. Ethereum will never reach $10k in its lifetime, which a study for another post.
A 75% correction is shown on the above 6 day chart that began in March 2024. A number of compelling reasons now exist for a strong upward move.
Support and resistance
Look left, price action confirms support on past resistance, which follows a strong positive divergence. The resistance has held since May 2022. Incidentally on the topic of divergences, on the same time frame with the same settings, Ethereum prints a double negative divergence over the same period. (see below).
The trend
Both Price action and RSI resistances have broken out. RSI confirms a trend reversal on past resistance.
A Cup and Handle pattern confirmation
The forecast is derived from the Cup and Handle pattern topping out at around $10.5k, however it is not suggested to wait until this area before profits are taken.
Is it possible price action continues to print lower lows? Sure.
Is it probable? No.
Ww
Ethereum 6 day double negative divergencies
BTC Retrace RoadMap and 3 nearby supports worth watching NOWThis is a near-term followup to my big picture linked below.
Dip is underway after orbiting our Genesis Fib at 117.9k.
Quickly approaching the next three supports worth watching.
Supports get stronger below but each one needs to slow the dip.
$ 115,140 is a minor fib but possible end of dip wave.
$ 113,9xx is a double fib that should be pretty strong
$ 111,661 is the sister Genesis fib, and a MUST HOLD
.
Big Picture chart and why 117.9k was KEY
=======================================================
.

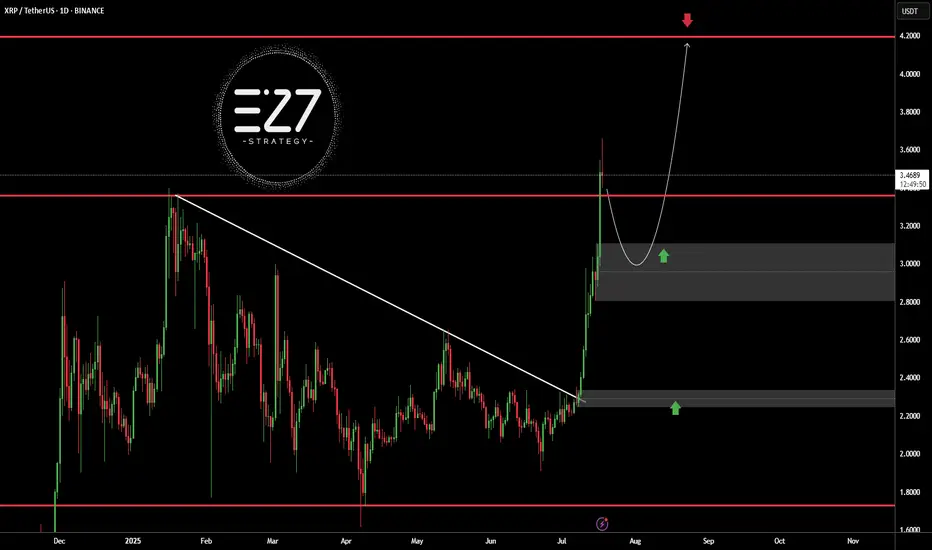
XRPUSDTBINANCE:XRPUSDT broke above its long-term downtrend line and surged to the $3.5000 resistance area, but is now undergoing a correction. The current bullish structure, with a higher high and higher low, suggests the trend remains upward. A pullback toward the $3.0000 demand zone is likely and would be a healthy retracement. Holding this area could trigger a continuation toward the key resistance at $4.2000.
Key Level Price
Main Support $2.2000
Main Resistance $4.2000
Best Buy Range $2.9500 – $3.1500
Best Sell Range $4.1000 – $4.2000
Investment Risk (Buying) Medium
⚠️Please control RISK management
NZDCAD Long Now!I believe it will reach the 83000 target, it may still retest the level before going to the target, but I have all the confimation for a long here.

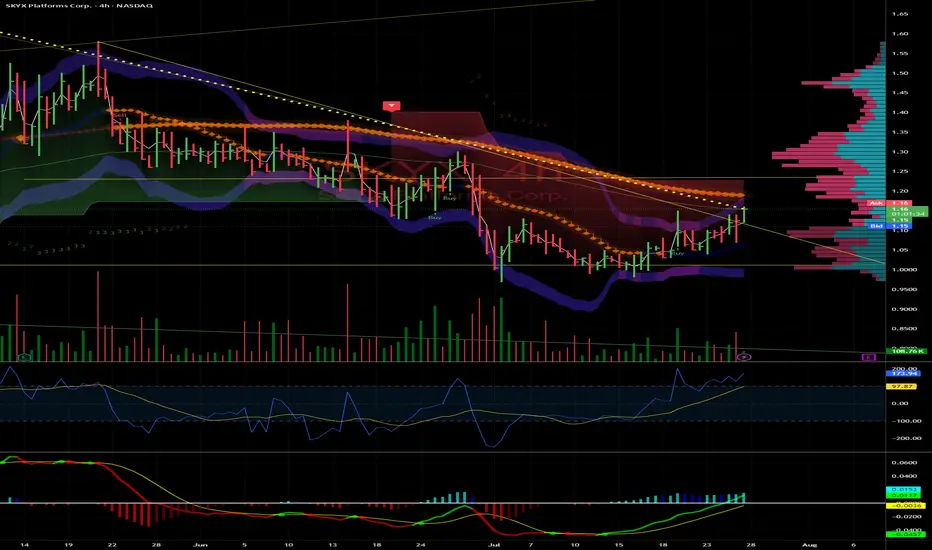
SKYX: Breakout to $1.58 and Potential Triple on Small-Cap Surge
SKYX Platforms Corp. (NASDAQ: SKYX) is primed for a run to $1.58 and could triple to $3.30 by year-end, driven by small-cap strength, e-commerce demand, and strong fundamentals. Here’s why SKYX is a must-watch.
Technicals: Clear Shot to $1.58
Trading at $1.10 , SKYX is coiling for a breakout. Resistance at $1.25 (psychological) and $1.40 (prior high) should fall easily with rising volume and a bullish MACD crossover. $1.58 is achievable by August, with $3.30 (200%+ gain) in sight if momentum holds.
Fundamentals: Smart Home Leader
With 97 patents and 60+ e-commerce websites, SKYX’s plug-and-play smart home platform is gaining traction. Their $3B Miami smart city deal (500,000+ units) and Profab Electronics partnership signal scalability . E-commerce sales, projected to hit $8T globally by 2027 , fuel SKYX’s growth.
Market Tailwind
The Russell 2000, which SKYX joined in June 2025, is breaking out, up 10% YTD . TNA’s 30% spikes amplify this . With a $138.61M market cap and 38 institutions adding shares (e.g., Susquehanna, 478,024 shares) , SKYX is set to ride this wave.
Risks
SKYX isn’t cash flow positive until H2 2025, and Q1 revenue missed ($20.1M vs. $21.15M). Small-cap volatility is a factor, but 12.4% YOY growth and the Russell breakout mitigate risks.The Play
SKYX hits $1.58 soon, clearing $1.25 and $1.40, then triples to $3.30+ by December on e-commerce, smart city deals, and small-cap momentum. I’m buying—thoughts, board?
Summary: Targets: $1.58 near-term, $3.30+ year-end.
Resistances: $1.25, $1.40.
Catalysts: Russell 2000/TNA breakout, e-commerce, smart city deal.
Risks: Cash flow, revenue misses, volatility.
Disclaimer: Not financial advice. Do your own DD. Stocks are volatile.
~Sherwood Coast's Group
Gold remains in a bearish trendGold followed our previous analysis closely, rejecting from the strong resistance level at $3430, confirming bearish momentum. This rejection has opened the door for a potential move toward the 3400 level, and further downside is likely.
Gold remains in a bearish trend. A temporary pause or minor consolidation may occur, but the overall direction remains to the downside. This week, markets are watching the outcome of the ES–US agreement closely. If a resolution is reached, it could strengthen the USD and increase risk appetite—potentially pushing gold even lower.
We expect gold to remain under pressure unless major market sentiment shifts. A break below 3400 could accelerate the drop toward 3322.
You May find more details in the chart.
Ps Support with like and comments for better analysis Thanks.

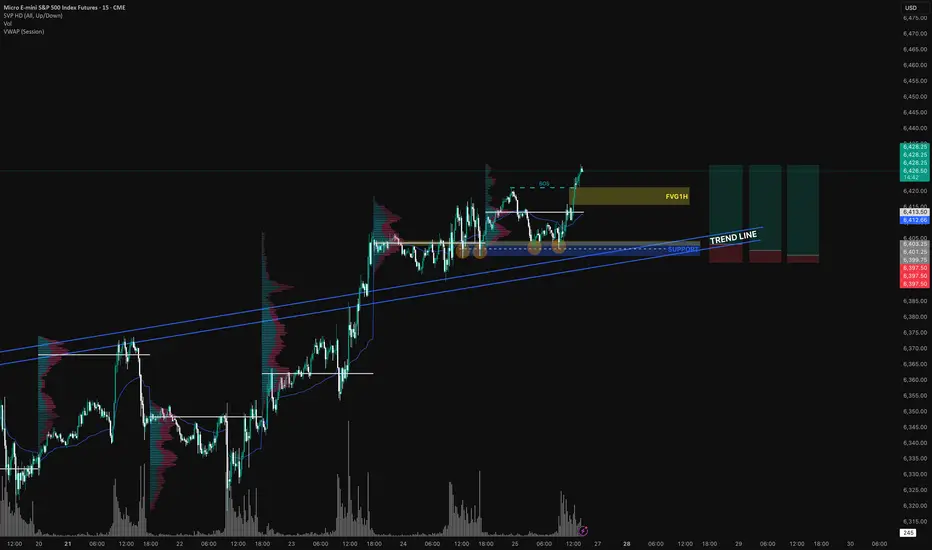
Long MES I see CME_MINI:ESU2025 is on a uptrend with a BOS( break of structure) at $6421, there is a trend line marked in blue that has been tested several times.
There is a support in confluence with POC area from a previous session. Above VWAP → Favorable for short positions (or considered expensive for long positions).
Below VWAP → Favorable for long positions (or considered expensive for sellers).
Personally, I build my position in zones — especially around key levels like order blocks, imbalance fills, or liquidity sweeps (Smart Money Concepts). I prefer scaling in when entering trades to catch better prices.
Wait for 3330 to buy the bottom and reduce unnecessary operation#XAUUSD
We have made good profits from short selling yesterday. Currently, gold has fallen to 3350📎. The 4HMACD death cross has increased in volume and is expected to continue to decline. Consider going long near 3330📈. I don’t think it is prudent to bottom out at 3340. Move forward steadily on Friday and reduce unnecessary operations⚖️.
🚀 BUY 3335-3330
🚀 TP 3345-3362
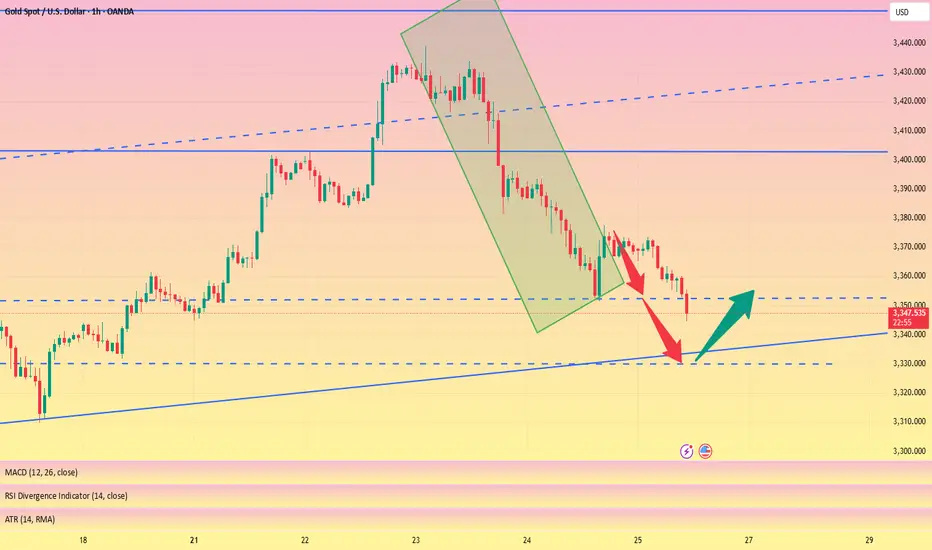
Be alert to new lows, pay attention to 3350 and go long at 3330📰 News information:
1. Tariff issues
2. Next week's NFP data
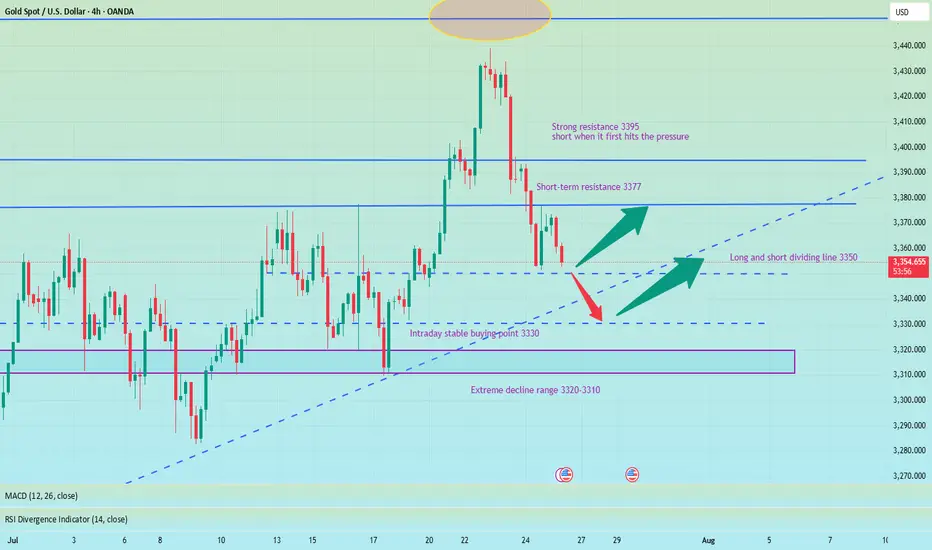
📈 Technical Analysis:
Last night, gold rebounded to only around 3377 before starting to fall back. Our judgment that the current rebound is weak is completely correct. 3350 is the support point of the bottoming out and rebounding to nearly $20 last night. Whether the European session can go down to 3350 will determine the trend of gold.
From the daily chart, the daily line has fallen for two consecutive days, suggesting that the price may continue to fall today. At present, we need to pay attention to this week's starting point of 3344-3345, and then the 3330 line below. The extreme decline is 3320-3310. At the same time, the narrowing of the daily Bollinger Bands is also paving the way for next week's NFP data.
From the 4H chart, the current MACD indicator crosses and increases in volume, and the middle track of the Bollinger Bands and SMA30 basically overlap near 3388. As for the hourly chart, the upper pressure is mainly concentrated near 3375-3377, which is also the high point of the rebound last night. If gold rebounds directly upward and encounters pressure and resistance at 3375-3385 for the first time, you can consider shorting and strictly implement stop loss.
Overall, if the current market falls to 3350-3345 for the first time and gets effective support, you can consider going long with a light position, defend 3340, and look to 3356-3362; if the decline is strong and continues to fall below 3350, the best stable long point for the day is 3330-3320, defend 3310, and earn $10-20 to leave the market.
🎯 Trading Points:
BUY 3350-3345
TP 3356-3362
BUY 3330-3320
TP 3345-3360
In addition to investment, life also includes poetry, distant places, and Allen. Facing the market is actually facing yourself, correcting your shortcomings, facing your mistakes, and exercising strict self-discipline. I share free trading strategies and analysis ideas every day for reference by brothers. I hope my analysis can help you.
TVC:GOLD PEPPERSTONE:XAUUSD FOREXCOM:XAUUSD FX:XAUUSD OANDA:XAUUSD FXOPEN:XAUUSD
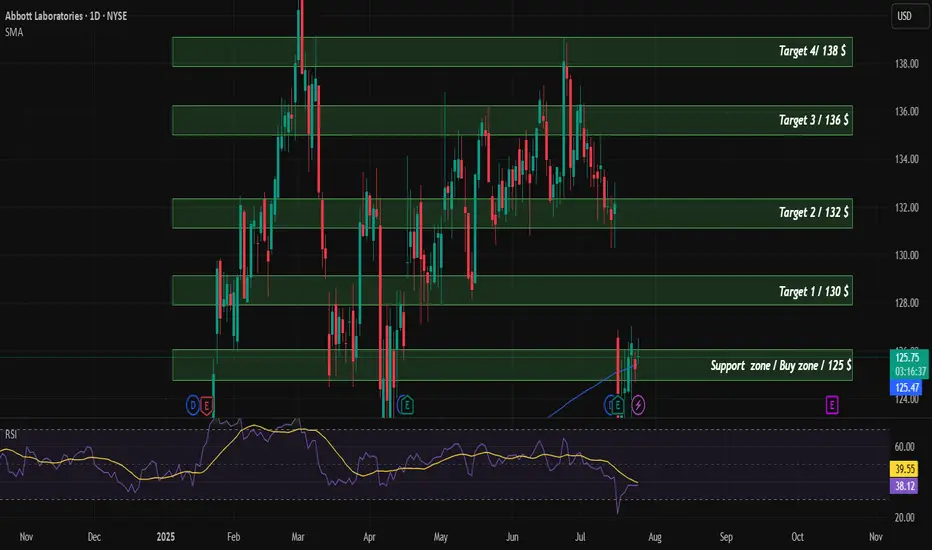
ABT Buy/LongTechnical analysis of the company. According to financial indicators, the company is currently undervalued and is supported by SMA200. The target price for the company is $142.
LINK Swing Trade – Watching for a PullbackLINK has rallied 58% since June 24th and is now consolidating after making a higher high. Price action is facing resistance and looks overheated, so a pullback toward support could offer a fresh long entry.
📌 Trade Plan:
• Entry Zone: $15.00 – $16.00 (on pullback)
• Take Profit Levels:
o 🥇 $20
o 🥈 $25
o 🥉 $30
• Stop Loss: Close below $13

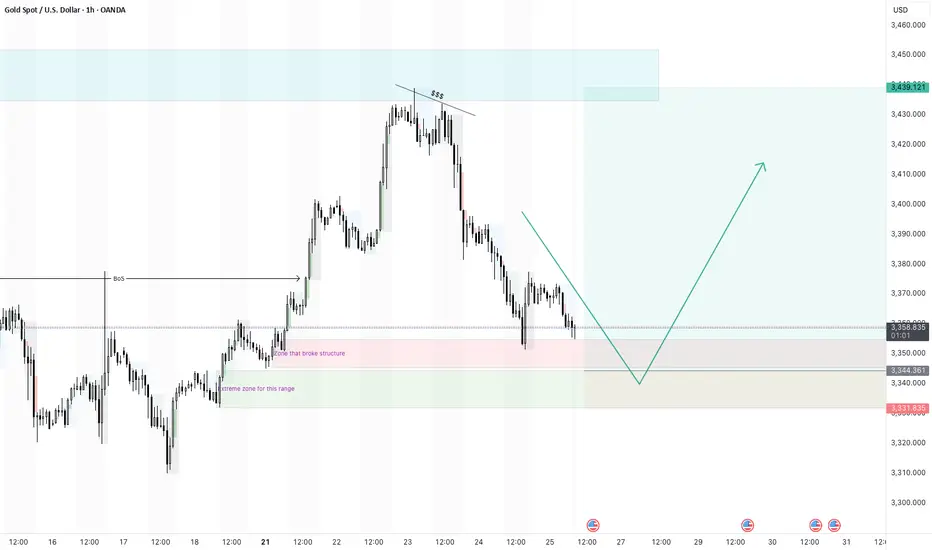
XAUUSD continuation of larger bullish move - 25/7/25Gold did touch the higher timeframe supply zone and pull back. It is now at a point where i am looking for a pivot to form to continue bullish.
I did place a buy limit trade at the extreme zone that started the break of structures.
i will wait a see if it drops and triggers or forms a pivot at the 4H zone that broke structure.
AUDUSD 60/15 Pullback ShortSeeing the market shifted from bull to bear. Looking for a pullback and short.
There is strong sell above, possible to quick probe that then drop.
Monitor.

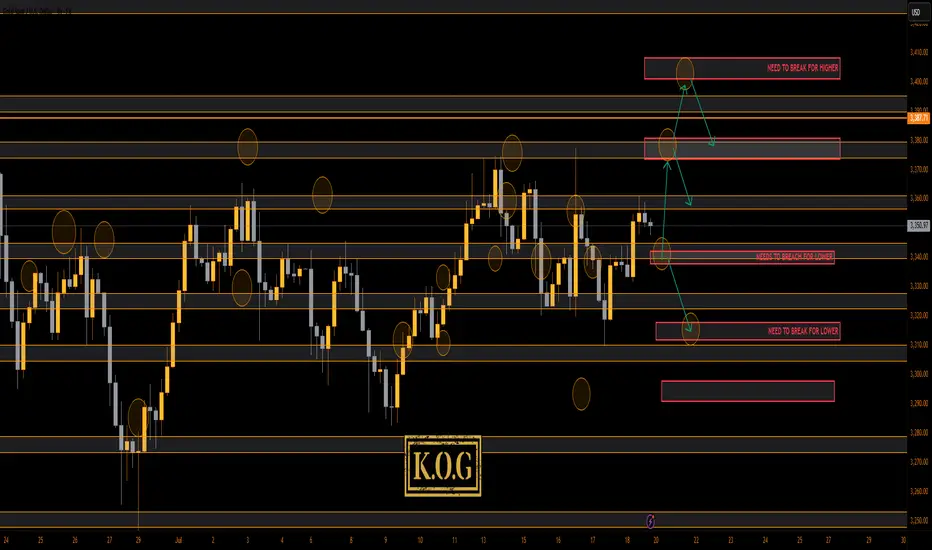
THE KOG REPORT THE KOG REPORT:
In last week’s KOG Report we said we would be looking for a price to attempt the higher level red box sitting around the 3370-75 region and if not breached, we felt an opportunity to short would be available from that region. We said if that failed and the move commenced, we would be looking at a complete correction of the move back down into the 3330-35 region, where we would then monitor price again in anticipation of a long from there or the extension level of 3310 which was also a red box short target (move complete). As you can see from the above, not only did we get that higher red box, we rejected, completed the move downside and then our traders managed to get that long trade all the way back up into the Excalibur target, red box targets and the hotspots shared in Camelot.
A decent week again, not only on Gold but also the numerous other pairs we trade, share targets on and analyse.
So, what can we expect in the week ahead?
For this week we can expect more ranging price action, but due to the previous range from last week being so tight, it looks like we’ll see a breakout coming in the latter part of the week unless there is news to bring us unexpected volume.
We have the key level below 3335-40 support and above that resistance and a red box sitting at 3375-80. This is the region that needs to watched for the break, and if broken we should hit the range high again at 3400-10. However, if rejected, we could again see this dip to attack that lower order region 3310-6 before attempting to recover.
Last week we wanted to see that curveball and although we did see some aggressive price action, I think we will see something extreme for this week. It’s that lower level 3310-6 that is a key region for bulls, if broken we can see a complete flush in gold taking us down into the 3250’s before we start the summer run. That for us would be the ideal scenario going into the month end, but, we’ll play it how we see and as usual, we go level to level and update any changes as we go along.
KOG’s Bias for the week:
Bullish above 3340 with targets above 3355, 3361, 3368, 3372 and above that 3385
Bearish below 3340 with targets below 3335, 3330, 3322, 3316, 3310 and below that 3304
RED BOX TARGETS:
Break above 3350 for 3355, 3361, 3367, 3375 and 3390 in extension of the move
Break below 3340 for 3335, 3330, 3320, 3310 and 3306 in extension of the move
Please do support us by hitting the like button, leaving a comment, and giving us a follow. We’ve been doing this for a long time now providing traders with in-depth free analysis on Gold, so your likes and comments are very much appreciated.
As always, trade safe.
KOG