Gold is holding strong at support!GOLD – Bullish Bounce Coming? CAPITALCOM:GOLD
Gold is moving inside an upward channel.
A bounce is likely from $3,335 – eyes on $3,425 📈
Don’t miss the move. Let the market pay you! 💰
📈 If the bounce happens, price may rise toward:
Target 1: $3,375
Target 2: $3,425+
✅ Price just touched the bottom of the channel around $3,335 – a strong support area.
✅ RSI is oversold ➜ This usually means a bounce is coming.
✅ Momentum indicators are showing signs of bullish reversal.
Support and Resistance

ANET new positionStarted a feeler position in ANET today with 110 shares. Sold a low delta covered call and added a CSP on the monthly a bit lower. I believe this will be the range of interest here. I wanted to slowly diversify a bit away from small caps as I have made a lot on the risk account the last two years. Arista is heavily positioned to benefit from energy, cloud, and Ai expansion and it has some of the best growth financials I have ever seen.
My plan:
Repeat covered calls at a lower delta to capture share appreciation.
Buy 100 more shares if it gets closer to 100 and continue to sell CSP

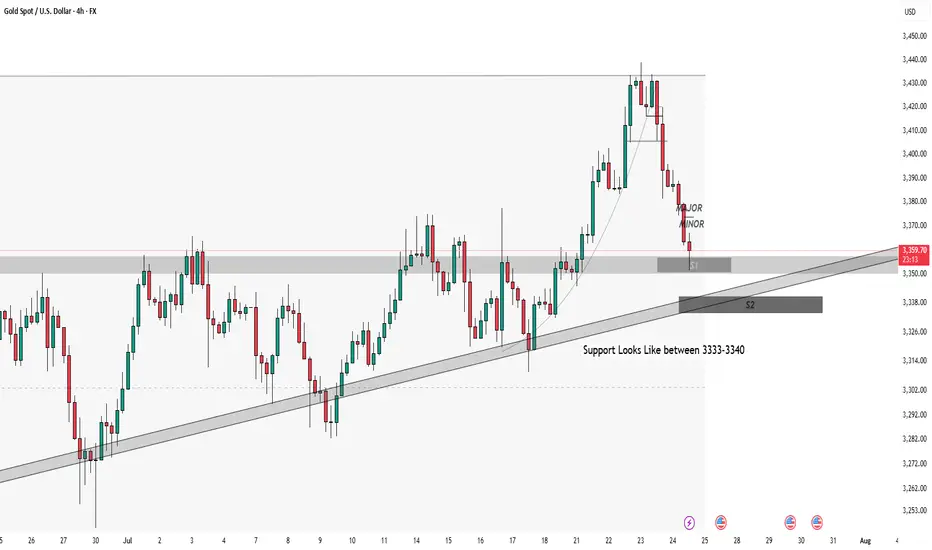
4H Analysis for GOLD🚨 Two Powerful Scenarios for Today’s Market Setup 🚨
Trade smart. Wait for confirmations. Here's how to dominate the next move:
🔹 Scenario 1 – Buy Setup Above 3349–3357 Demand Zone
📍 If price taps into the 3349–3357 zone, don’t rush in!
✅ Wait for Minor & Major Resistance
✅ Then, look for a clean retracement
📈 Enter on the buy side after confirmation — ride the trend with confidence.
This setup needs clear structure shifts to avoid false moves. Be patient. Let the market show its hand first.
🔹 Scenario 2 – Buy or Sell Based on Key Reaction at 3333–3340 Zone
📍 If price drops into the 3333–3340 zone (stronger support):
✅ Watch for a liquidity sweep.
✅ Look for a bullish reversal pattern.
✅ Wait for a retest of the broken structure or order block
📈 Then enter for buy, targeting higher liquidity zones.
TP1 : 3390 , TP2: 3412
📉 BUT — If price breaks the 4H support (clean close below):
🔁 This same zone becomes resistance
🚨 Enter on pullback to resistance for a sell-side continuation
www.tradingview.com
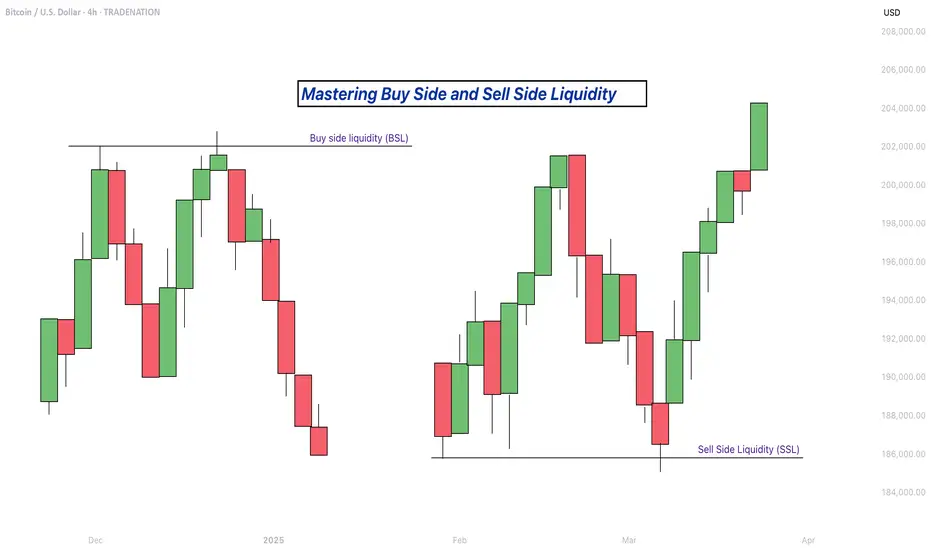
Mastering Buy Side and Sell Side Liquidity - How to trade it!In trading, understanding liquidity is one of the keys to predicting where the market might go next. The Inner Circle Trader (ICT) method teaches traders how to recognize where big players like banks and institutions are likely to enter or exit trades. Two important ideas in ICT trading are buy side liquidity and sell side liquidity. Once you understand what these terms mean and how to spot them on a chart, you can start using them to find better trading opportunities.
What will be discussed?
- What is Buy Side Liquidity?
- What is Sell Side Liquidity?
- How do you see Buy and Sell Side Liquidity?
- Examples
- How to trade BSL and SLL Liquidity?
What is Buy Side Liquidity
Buy side liquidity is found above market highs. It refers to all the stop loss orders from people who are holding short positions. When the market is going down, some traders sell (or go short) and place their stop losses above recent highs to protect themselves. These stop losses are actually buy orders because closing a short position requires buying. Big institutions know this, so they push price upward to trigger those stop losses and grab that liquidity. That’s why you’ll often see the market spike above a recent high before reversing. That spike is the market grabbing buy side liquidity.
What is Sell Side Liquidity
Sell side liquidity is the opposite. It’s found below recent lows. This is where traders who are buying (going long) place their stop losses. If someone buys a market, they’ll usually put a stop loss just below a previous low. That stop loss is a sell order. Smart money looks at these areas as pools of sell side liquidity. So when the market moves down quickly and breaks a recent low, it’s likely collecting those sell stop orders. After that, you’ll often see a reversal because the liquidity has been taken.
How do you see Buy and Sell Side Liquidity?
You can spot buy side and sell side liquidity by looking at the chart and identifying recent highs and lows where many traders might have placed stop losses. These are usually obvious swing highs and swing lows. If you look at a chart and see a clean high where price previously reversed, that’s likely where traders are placing stops. That makes it a target for buy side liquidity. Same for a recent low, if it’s a clean level where people might have bought in the past, that low probably holds sell side liquidity. The more obvious the level looks, the more likely it’s full of stops and therefore a liquidity target.
Examples
How to trade BSL and SLL Liquidity?
Trading liquidity means watching for the market to run above a recent high (to take buy side liquidity) or below a recent low (to take sell side liquidity), and then looking for signs of reversal. Once liquidity has been taken, the market often changes direction.
When you’re trading the ICT concept of liquidity, the key is not just spotting where liquidity lies, but also knowing when price is likely to reverse after that liquidity has been taken. Reversals don’t happen randomly, they leave clues on the chart. Here’s how you can recognize those signs in a simple way:
1. Market Structure Break
This is one of the clearest signs of a reversal. Let’s say the market grabs sell side liquidity by breaking below a recent low. If price then quickly starts moving up and breaks above the last lower high, that’s a break in structure. It shows that sellers are losing control and buyers are stepping in. It’s the first confirmation that the direction might be changing.
2. Rejection Wicks or Strong Candles
After price runs into liquidity (above a high or below a low), watch the candlesticks closely. If you see a long wick rejecting the level, or a strong candle in the opposite direction right after the liquidity grab, that’s a clue. It means price went there, collected the orders, and got rejected fast. That rejection shows the market might be reversing.
3. Fair Value Gaps (FVGs)
Fair value gaps are small “windows” left in price when it moves quickly in one direction. After liquidity is taken and price starts reversing, it often leaves an FVG behind. If price pulls back into that gap and holds, that can be a great entry point. FVGs act like magnets and support zones in ICT.
4. Displacement
Displacement is a strong, impulsive move that breaks structure. It usually happens right after liquidity is taken. If price moves very fast in the opposite direction after hitting a liquidity level, that’s a good sign smart money is behind the move and it’s not just random noise. That strong push is a hint that a new trend might be forming.
5. Change in Character (CHOCH)
This is a shift in how the market behaves. For example, price might be making lower highs and lower lows (a bearish trend), but after liquidity is taken, it suddenly starts making higher highs and higher lows. That change in character tells you the trend might be reversing.
-------------------------
Disclosure: I am part of Trade Nation's Influencer program and receive a monthly fee for using their TradingView charts in my analysis.
Thanks for your support. If you enjoyed this analysis, make sure to follow me so you don't miss the next one. And if you found it helpful, feel free to drop a like 👍 and leave a comment 💬, I’d love to hear your thoughts!
Fart Ichimoku Breakout Test📈 Checking bullish signals on the chart
✅ Positive signs:
- The price is stable above the cloud and the candles show the strength of buyers.
- Indicators such as RSI and trading volume are in a good position.
- The cloud broke with the body
First profit limit 1/451
Second profit limit 1/551
Limit of loss 1/320

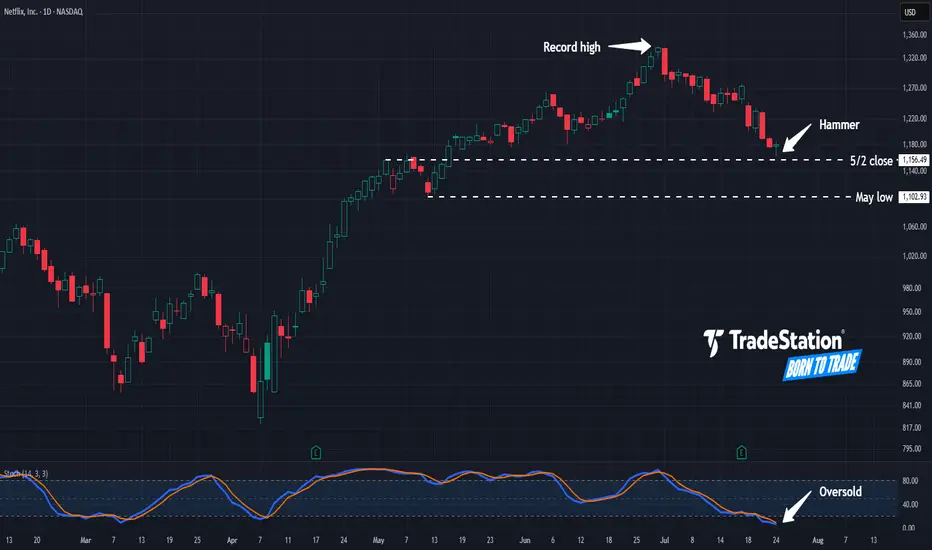
Hammer in NetflixNetflix has pulled back from record highs, and some traders may see potential opportunities in the streaming video giant.
The first pattern on today’s chart is the $1,156.49 level. It was a weekly close on May 2 and near the high the following week. NFLX is now showing signs of potential stabilization near that level. Is new support emerging?
Second, prices hit their lowest level in more than two months yesterday but rebounded. The resulting hammer candlestick pattern may be viewed as a bullish reversal pattern.
Third, stochastics have fallen to oversold territory.
Fourth, if the potential support at $1,156.49 breaks, traders may next eye the May low of $1,102.93.
TradeStation has, for decades, advanced the trading industry, providing access to stocks, options and futures. If you're born to trade, we could be for you. See our Overview for more.
Past performance, whether actual or indicated by historical tests of strategies, is no guarantee of future performance or success. There is a possibility that you may sustain a loss equal to or greater than your entire investment regardless of which asset class you trade (equities, options or futures); therefore, you should not invest or risk money that you cannot afford to lose. Online trading is not suitable for all investors. View the document titled Characteristics and Risks of Standardized Options at www.TradeStation.com . Before trading any asset class, customers must read the relevant risk disclosure statements on www.TradeStation.com . System access and trade placement and execution may be delayed or fail due to market volatility and volume, quote delays, system and software errors, Internet traffic, outages and other factors.
Securities and futures trading is offered to self-directed customers by TradeStation Securities, Inc., a broker-dealer registered with the Securities and Exchange Commission and a futures commission merchant licensed with the Commodity Futures Trading Commission). TradeStation Securities is a member of the Financial Industry Regulatory Authority, the National Futures Association, and a number of exchanges.
Options trading is not suitable for all investors. Your TradeStation Securities’ account application to trade options will be considered and approved or disapproved based on all relevant factors, including your trading experience. See www.TradeStation.com . Visit www.TradeStation.com for full details on the costs and fees associated with options.
Margin trading involves risks, and it is important that you fully understand those risks before trading on margin. The Margin Disclosure Statement outlines many of those risks, including that you can lose more funds than you deposit in your margin account; your brokerage firm can force the sale of securities in your account; your brokerage firm can sell your securities without contacting you; and you are not entitled to an extension of time on a margin call. Review the Margin Disclosure Statement at www.TradeStation.com .
TradeStation Securities, Inc. and TradeStation Technologies, Inc. are each wholly owned subsidiaries of TradeStation Group, Inc., both operating, and providing products and services, under the TradeStation brand and trademark. When applying for, or purchasing, accounts, subscriptions, products and services, it is important that you know which company you will be dealing with. Visit www.TradeStation.com for further important information explaining what this means.
COUR ready to launch?Incredible chart and breakout approaching,
Above $12 we can see $16 in a few months, This can be a great addition to the long term account!
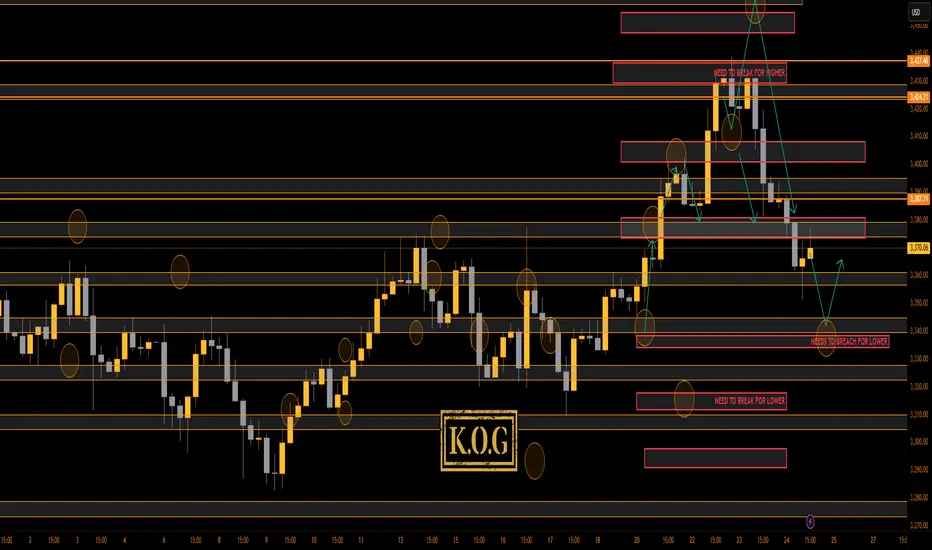
THE KOG REPORT - UpdateEnd of day update from us here at KOG:
Not bad play at all with the red boxes working well, KOG's bias of the day and the red box targets working well and of course the indicators and our trusted algo Excalibur guiding the way completing the move that we wanted downside. We then got a fantastic long from the bias level and red box activation up into where we are now.
So, what now?
We have resistance and a red box above which is broken suggesting we may see some more movement downside in the coming sessions. This would also align with the hunt and undercut low that can take place at this key level. We're a bit too low to short, so we'll either look for the break above 3375 to go higher, or, we'll wait lower for a potential long trade from the red box region.
Immediate support here is 3360-5 and resistance 3375.
Price: 3364
KOG’s Bias of the day:
Bullish above 3350 with targets above 3358✅, 3365✅ and above that 3379✅
Bearish on break of 3350 with target below 3337 and below that 3330
RED BOXES:
Break above 3365 for 3372✅, 3375✅, 3388 and 3406 in extension of the move
Break below 3350 for 3335, 3330, 3326 and 3307 in extension of the move
As always, trade safe.
KOG
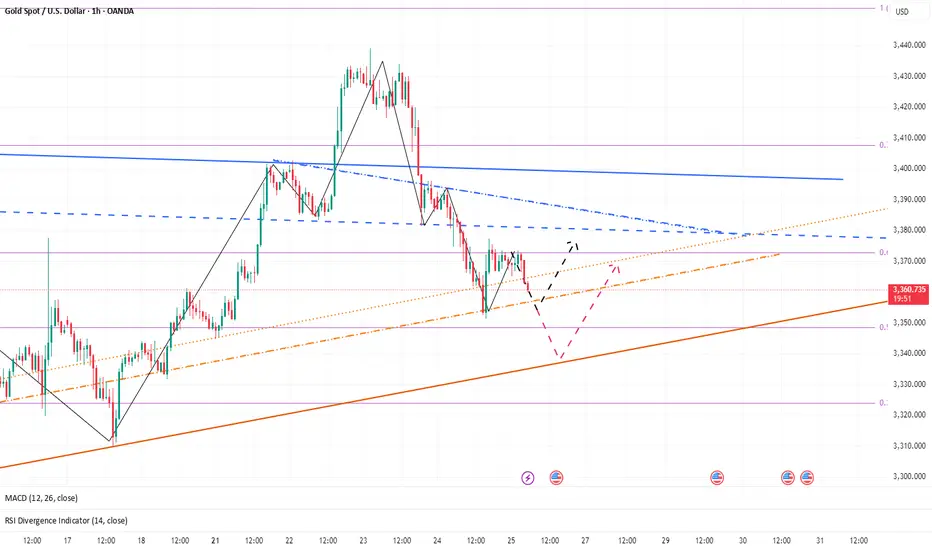
Gold Softens — Watching for a Tactical Long OpportunityYesterday, gold hit a low of around 3351 and then began to rebound. During the rebound, it hit a high of around 3377 and then retreated again. We can clearly see that below 3400, gold is still weak overall, and even failed to reach 3380 during the rebound. In the short term, the 3380-3390 area has become an obvious resistance area.
Yesterday, gold rebounded after dropping to around 3351. Whether the support near 3350 is effective has not been verified again, so from a technical perspective, gold still has the need to retreat again and test the support near 3350. Once gold falls below the area when testing the support near 3350, gold may continue to fall to the 3335-3325 area.
Therefore, in today's trading, the focus is still on shorting gold, supplemented by trying to go long on gold with the support.
1. Consider shorting gold in the 3380-3390 area, TP: 3365-3355;
2. Consider going long gold in the 3355-3345 area, TP: 3365-3375; strictly set SL
3. If the 3355-3345 area is broken, try to go long gold again in 3335-3325, TP: 3360-3370
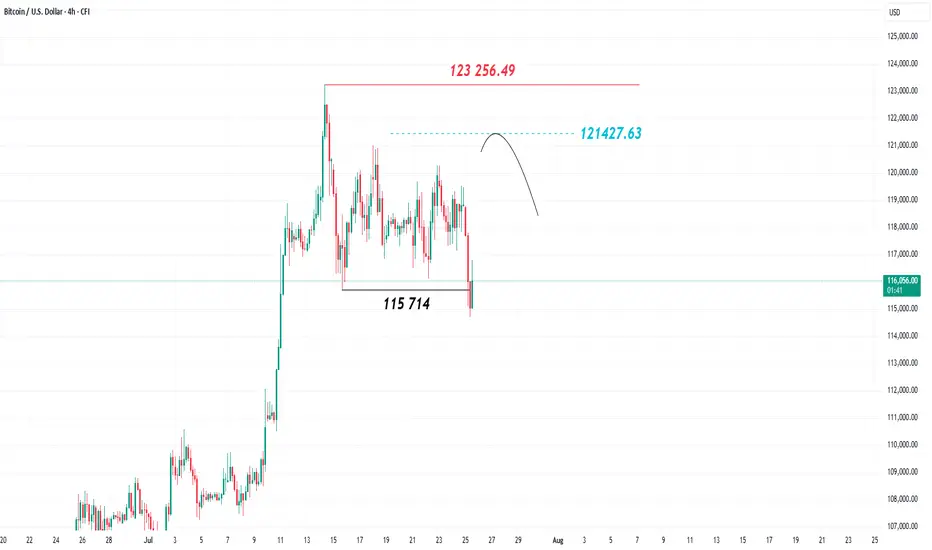
What's next for BITCOIN?After hitting a new all-time high at 123,256.49, Bitcoin, the world’s leading cryptocurrency, pulled back this week, closing on the 4-hour chart below the 115,714 level. This indicates a shift in trend from bullish to bearish and increases the likelihood of a short-to-medium-term decline.
The recent price rise appears to be corrective, and the 121,427 level is considered important and carries downside pressure, as it represents the 78% level of the Fibonacci retracement tool when measured from the recent high to the latest low. Holding below the 123,256 mark and failing to break above it would support the bearish scenario for Bitcoin.
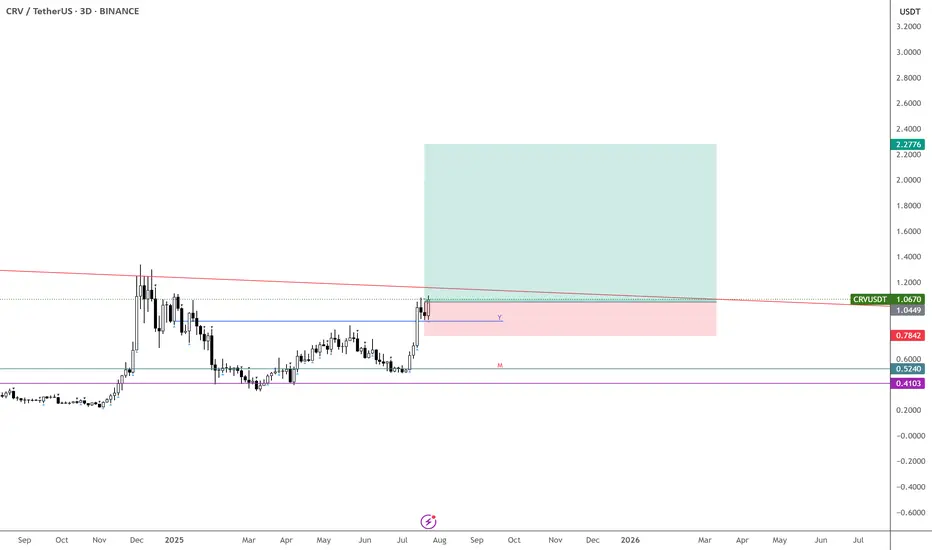
CVR – Ready to Run, Monthly Confirmation In
Tons of strength showing on $CVRUSDT—expecting continuation from here and even more once the trendline breaks.
The monthly candle is confirming the move, pointing to a potential 6-month uptrend. Looks like this one is finally ready for the run we’ve been waiting for.
Buying here and stacking more around 90c if given the chance.
First target: above $2.
BINANCE:ENAUSDT may have gotten away—but this one won’t.
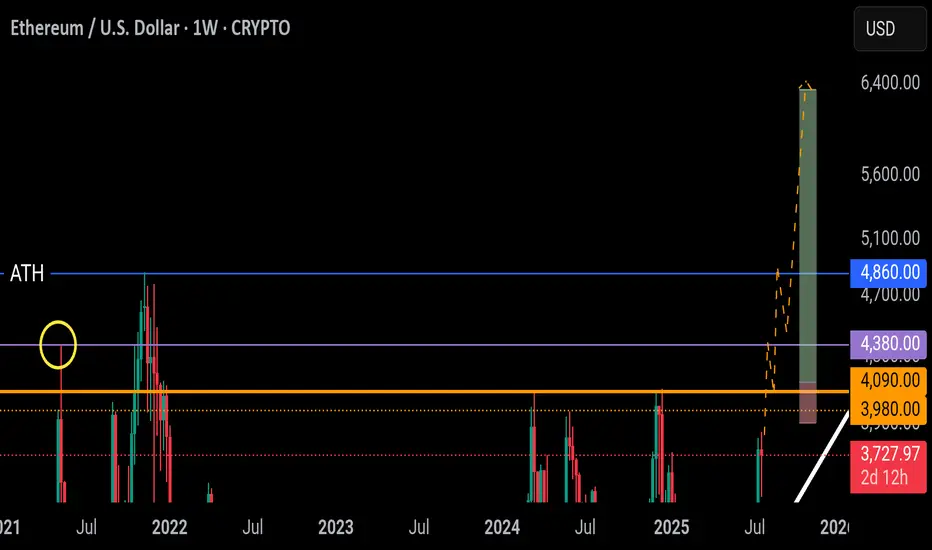
ETH key levels / fligh pathResistance zone @ 4,000 - 4,100
If Ethereum is able to break above this level the next price level likely to slow momentum / see a rejection is @ 4,400. A rejection from this price point could present a good long entry at the same Resistance zone @ 4k (flipping into support).
The ATH is likely to briefly act as resistance - saw a similar pattern with XRP/SOL/BNB/BTC - price does not naturally just "bust through" first time. Rejection/consolidation likely followed by a continued move into price/discovery.
Anticipate a new ATH to be printed toward the back end of Q4 📈
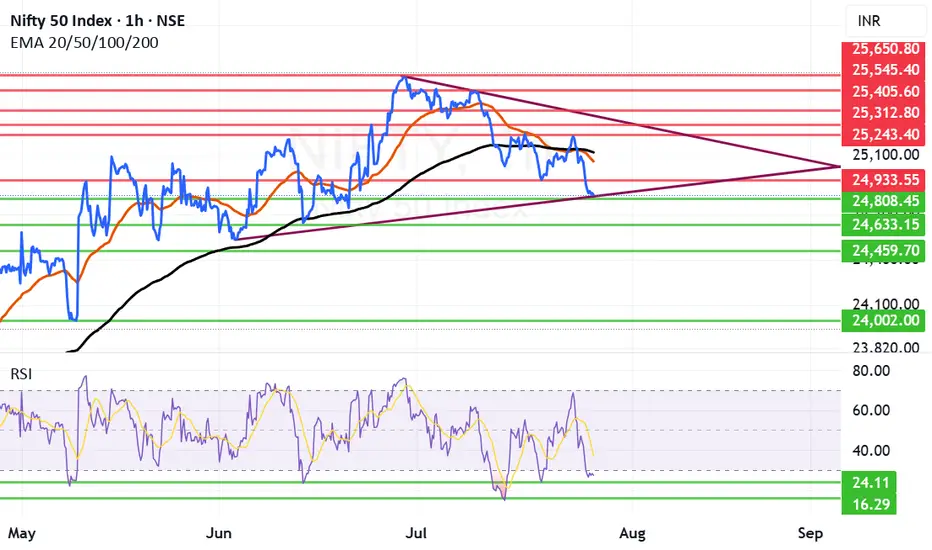
Nifty Next Week: Can Nifty make a comeback after drubbing?Nifty received proper drubbing after falling below critical supports of Mother and Father line. Trump's warning signals for IT companies and the continuing deadlock in Trade deal with US weighing on Indian markets. Additionally the earning season also giving many disappointing and few good result has broken the back of the Bull rally and now Nifty is reeling under 25K levels.
Only silver line in the cloud seems to be that RSI is below 30. Currently RSI is at 27.52. Usually RSI has found support near 24 if not 24 it might bounce back from 16. So hopefully we can see some short covering in the beginning or middle of next week. Also next week the decision for Tariffs should come. If the result will be in favour of India we might see a strong come back as lot of sectors / Large cap stocks currently are looking oversold.
The Supports for Nifty Remain at: 24808 (Strong support), 24633, 24459 Below 24459 the index will be in firm grip of Bears who might try to drag Nifty towards 24K levels or even below that in unlikely circumstances.
The Resistances for Nifty Remain at: 24933, 25058 (Mother Line Resistance of Daily Chart), 25119 (Father Line Resistance) and 25243. After we get a closing above 25243 the Bulls can gain some momentum.
Disclaimer: The above information is provided for educational purpose, analysis and paper trading only. Please don't treat this as a buy or sell recommendation for the stock or index. The Techno-Funda analysis is based on data that is more than 3 months old. Supports and Resistances are determined by historic past peaks and Valley in the chart. Many other indicators and patterns like EMA, RSI, MACD, Volumes, Fibonacci, parallel channel etc. use historic data which is 3 months or older cyclical points. There is no guarantee they will work in future as markets are highly volatile and swings in prices are also due to macro and micro factors based on actions taken by the company as well as region and global events. Equity investment is subject to risks. I or my clients or family members might have positions in the stocks that we mention in our educational posts. We will not be responsible for any Profit or loss that may occur due to any financial decision taken based on any data provided in this message. Do consult your investment advisor before taking any financial decisions. Stop losses should be an important part of any investment in equity.
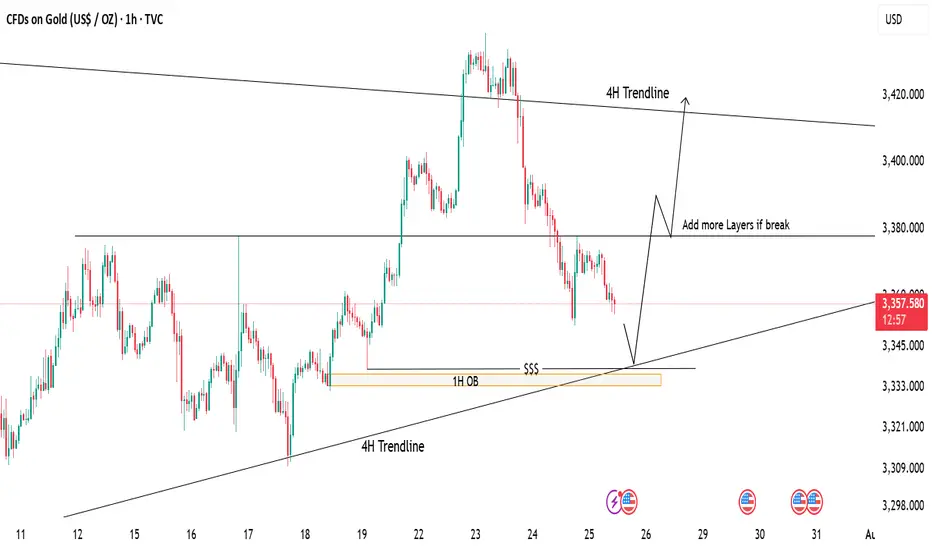
Gold Tapping Into Major Support – Eyes on Bullish ReversalPrice is currently retracing after a strong drop from recent highs. We're now approaching a key demand zone, aligning with:
📍 1H Order Block (OB)
📍 4H Trendline Support
📍 Liquidity Zone ($$$)
📉 If price taps into this area, it may offer a high-probability long setup.
📈 First target: 3380 (mid-range resistance)
🧱 If this breaks, we can look to scale in/add more positions, targeting the 4H trendline zone near 3420.
⚠️ Waiting for price reaction at support – patience is key!
GOLD (XAUUSD) Intraday Idea LongGold been keeping falling on both Asian and European sessions.
Most probably likely to pullback to London high after the New York session open.
Let's see if this plays out!
Good Luck!

XAU/USD Buy Setup – Trendline + Support ConfluenceReasons for Possible Buy:
Price is sitting on a rising trendline acting as dynamic support.
Strong horizontal support zone previously acted as demand.
Signs of a potential bullish reaction or bounce after extended downside.
Trade Plan:
Looking for bullish confirmation (candle structure or momentum shift) around this level.
If confirmed, potential targets:
First target: $3,365–$3,380
Second target: $3,431
🔹 Invalidation: Clean break below $3,320 zone or trendline support would invalidate the setup.
This is a high-reward area if buyers step in again like they did previously. Patience for confirmation is key before executing.

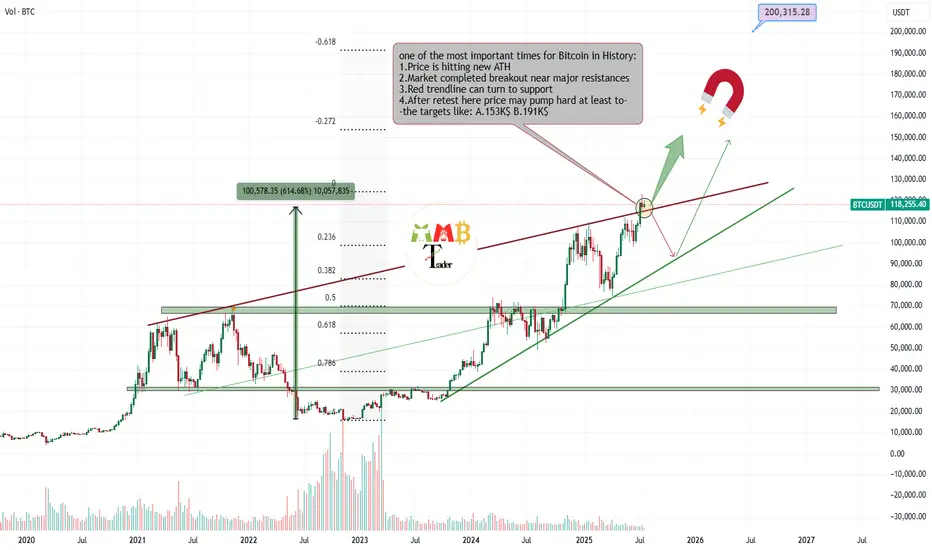
Bitcoin is retesting Critical zone for targeting almost 200K$Most traders around world now don't know what to do with their own trades or spot holdings, because some are in profit and how doubt of more pump and are still holding and some others miss this massive pump and think it can rest and fall now and it is not a good time to enter long.
And many other questions and thoughts At this time is simply check the chart and do these simple steps which are some mentioned and some not due to huge content.
Delete all of my previous drawings and start new Charting the price and see new trendlines or supports and resistances formed.
Then technically check the volume and breakouts and ... once again and here for Bitcoin i still find out chart looks extremely bullish to me and at this orange zone which is price is getting a little slow some important things may happen.
30% is expecting price fall below red trendline again and see short-term fall.
70% is expecting price complete retest of breakout here or pump more ASAP and then hitting targes like 150K$ and more for $BTCUSDT.
DISCLAIMER: ((trade based on your own decision))
<<press like👍 if you enjoy💚
USDJPY: Confirmed CHoCH & Bullish OutlookI spotted a confirmed Change of Character on 📈USDJPY on 4-hour timeframe.
The market, currently in a global bullish trend, has effectively broken through a minor bearish trend and surpassed a key horizontal resistance level.
It is likely to continue rising, with the next resistance at 149.00.

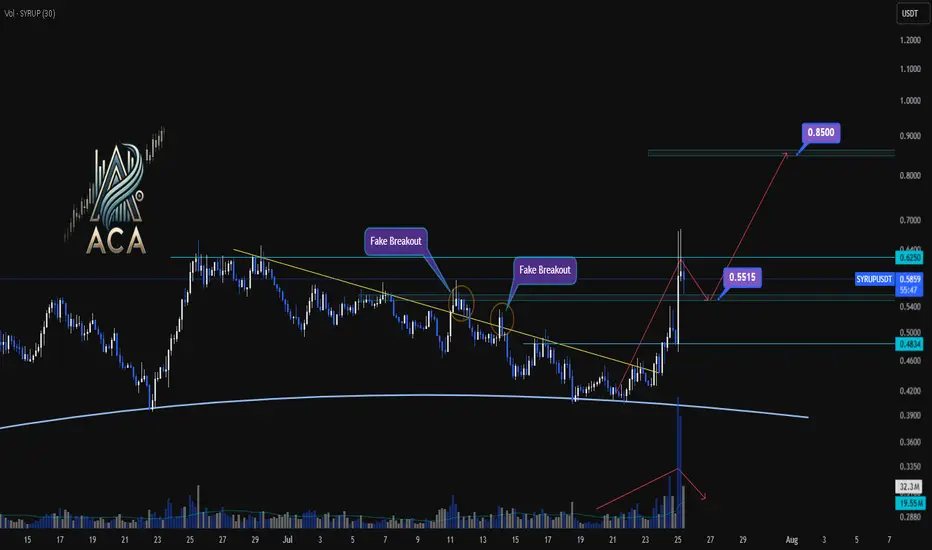
SYRUPUSDT 4H Chart Analysis | Trendline Breakout & Next MovesSYRUPUSDT 4H Chart Analysis | Trendline Breakout & Next Moves
🔍 Let’s break down the latest action on the SYRUP/USDT 4H chart and pinpoint what comes next as trend and momentum cues line up for traders.
⏳ 4-Hour Overview
- The recent breakout above the key trendline was backed by a surge in volume, providing clear momentum confirmation and pushing price toward resistance.
- Price has already reached 1.5R of the initial breakout target, a strong sign the trend is in motion.
- Upon touching the $0.6250 resistance, momentum cooled, with volatility decreasing — a classic consolidation phase after a high-energy move.
🔻 Correction & Structure
- With volume subsiding and momentum slowing post-$0.6250, we’re now expecting a corrective move down toward $0.5515.
- This retracement zone will be critical to watch for higher low formation – a bullish structural signal if supported by volume confirmation.
🔺 Long Setup:
- Should SYRUP reclaim and break above $0.6250 after setting a higher low at $0.5515, and with renewed volume, we could see another strong leg higher.
- The next major resistance sits around $0.85 — this aligns as a logical upside target based on the range extension.
📊 Key Highlights:
- Trendline breakout with sharp volume spike = momentum confirmation.
- 1.5R reached before first deep pullback; structure remains bullish above $0.5515.
- Watch for a higher low and subsequent break of $0.6250 with volume to confirm the next move to $0.85.
🚨 Conclusion:
SYRUP’s chart is at a pivotal juncture: a constructive pullback to $0.5515 could set up the next wave higher if supported by volume. A confirmed breakout above $0.6250 targets $0.85 — stay patient and wait for volume signals at key levels.
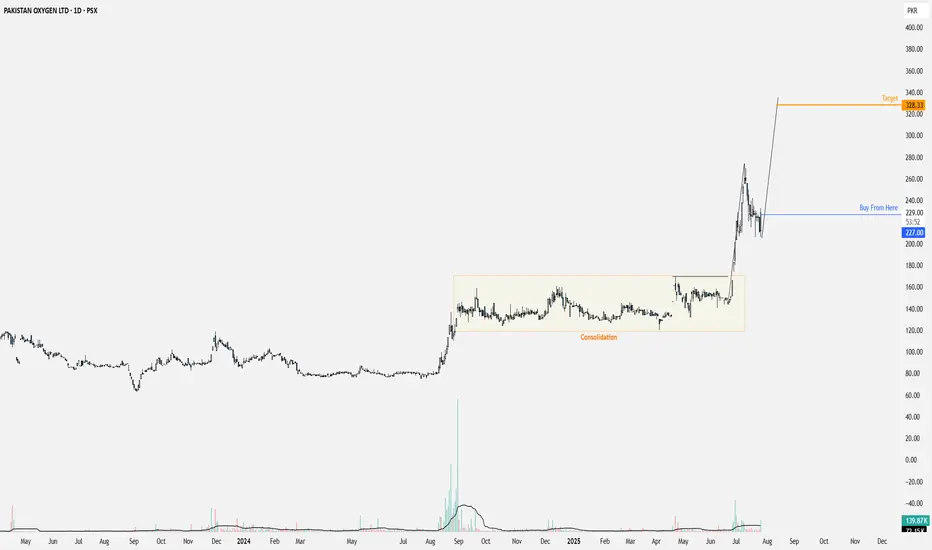
PAKOXY is forming ABCD PatternAfter the longest consolidation, PAKOXY has given a breakout and is now forming an ABCD Pattern.
Handsome ROI.
EURJPY: Correction is Over?!It seems like 📈EURJPY has finished consolidating within a broad horizontal channel on the 4H chart.
The formation of a new higher high today suggests potential upward movement.
Since it's Friday, I recommend considering trend-following buys starting Monday.
We should wait for the market to close above the highlighted resistance to establish a Higher Close on the daily chart.
Look to buy after a pullback, targeting 174.00 as the initial goal.

SHORT ON EUR/NZDEZ Has given a nice CHOC to the downside with plenty of sell side liquidity to be collected.
I will be selling EZ to the next level of demand looking to catch 300-500 pips

EURAUD is currently showing signs of a bearishEURAUD is currently showing signs of a bearish trend continuation. Despite short-term upward movement driven by optimism around the ECB, the overall structure remains vulnerable to downside pressure.
The European Central Bank (ECB) is expected to keep interest rates unchanged, potentially ending a seven-year streak of cuts. While this could bring temporary strength to the Euro, the technical setup still favours the bears.
Watch for a Break Below the Neckline
If price manages to break below the neckline of the current pattern, it could trigger a strong bearish move. First support: 1.77100 Second support: 1.76300
You May find more details in the chart.
Ps: Support with like and comments for more analysis.
