GOLD Drops $60 – Bearish Bias Holds Below 3365GOLD | OVERVIEW
As expected, gold continued its bearish momentum, dropping from the 3430 level and delivering a move of approximately $60.
For today, the bearish bias remains valid as long as the price stays below 3365, with potential targets at 3337 and 3320.
However, if the price reverses and stabilizes above 3365, it could signal a shift to bullish momentum.
Key Levels:
Support: 3355 · 3337 · 3320
Resistance: 3374 · 3388
Support and Resistance

EURUSD –Bearish Pressure Below 1.1780 |Channel Structure HoldingEURUSD | UPDATE
The price is currently respecting the descending channel, failing to close above the pivot zone (1.1780 – 1.1750) and rejecting from the upper boundary of the structure.
Bias: Bearish While Below 1.1780
As long as price remains under the pivot zone and inside the descending channel, the bearish pressure is likely to persist. A potential correction may retest 1.1750 – 1.1730 levels before continuation.
Next Targets:
1.1700 – Minor support
1.1684 – Short-term level
1.1627 – Mid-target
1.1557 – Main support zone and channel bottom
Invalidation:
Clear breakout and H4 close above 1.1780 would invalidate the short bias and open a path toward 1.1820 and possibly 1.1882.
Structure: Bearish inside descending channel

XAU/USD 25 July 2025 Intraday AnalysisH4 Analysis:
-> Swing: Bullish.
-> Internal: Bullish.
You will note that price has targeted weak internal high on three separate occasions which has now formed a triple top, this is a bearish reversal pattern and proving this zone is a strong supply level. This is in-line with HTF bearish pullback phase.
Remainder of analysis and bias remains the same as analysis dated 23 April 2025.
Price has now printed a bearish CHoCH according to my analysis yesterday.
Price is now trading within an established internal range.
Intraday Expectation:
Price to trade down to either discount of internal 50% EQ, or H4 demand zone before targeting weak internal high priced at 3,500.200.
Note:
The Federal Reserve’s sustained dovish stance, coupled with ongoing geopolitical uncertainties, is likely to prolong heightened volatility in the gold market. Given this elevated risk environment, traders should exercise caution and recalibrate risk management strategies to navigate potential price fluctuations effectively.
Additionally, gold pricing remains sensitive to broader macroeconomic developments, including policy decisions under President Trump. Shifts in geopolitical strategy and economic directives could further amplify uncertainty, contributing to market repricing dynamics.
H4 Chart:
M15 Analysis:
-> Swing: Bullish.
-> Internal: Bullish.
H4 Timeframe - Price has failed to target weak internal high, therefore, it would not be unrealistic if price printed a bearish iBOS.
The remainder of my analysis shall remain the same as analysis dated 13 June 2025, apart from target price.
As per my analysis dated 22 May 2025 whereby I mentioned price can be seen to be reacting at discount of 50% EQ on H4 timeframe, therefore, it is a viable alternative that price could potentially print a bullish iBOS on M15 timeframe despite internal structure being bearish.
Price has printed a bullish iBOS followed by a bearish CHoCH, which indicates, but does not confirm, bearish pullback phase initiation. I will however continue to monitor, with respect to depth of pullback.
Intraday Expectation:
Price to continue bearish, react at either M15 supply zone, or discount of 50% internal EQ before targeting weak internal high priced at 3,451.375.
Note:
Gold remains highly volatile amid the Federal Reserve's continued dovish stance, persistent and escalating geopolitical uncertainties. Traders should implement robust risk management strategies and remain vigilant, as price swings may become more pronounced in this elevated volatility environment.
Additionally, President Trump’s recent tariff announcements are expected to further amplify market turbulence, potentially triggering sharp price fluctuations and whipsaws.
M15 Chart:

BankNifty levels - Jul 28, 2025Utilizing the support and resistance levels of BankNifty, along with the 5-minute timeframe candlesticks and VWAP, can enhance the precision of trade entries and exits on or near these levels. It is crucial to recognize that these levels are not static, and they undergo alterations as market dynamics evolve.
The dashed lines on the chart indicate the reaction levels, serving as additional points of significance. Furthermore, take note of the response at the levels of the High, Low, and Close values from the day prior.
We trust that this information proves valuable to you.
* If you found the idea appealing, kindly tap the Boost icon located below the chart. We encourage you to share your thoughts and comments regarding it.
Wishing you successful trading endeavors!

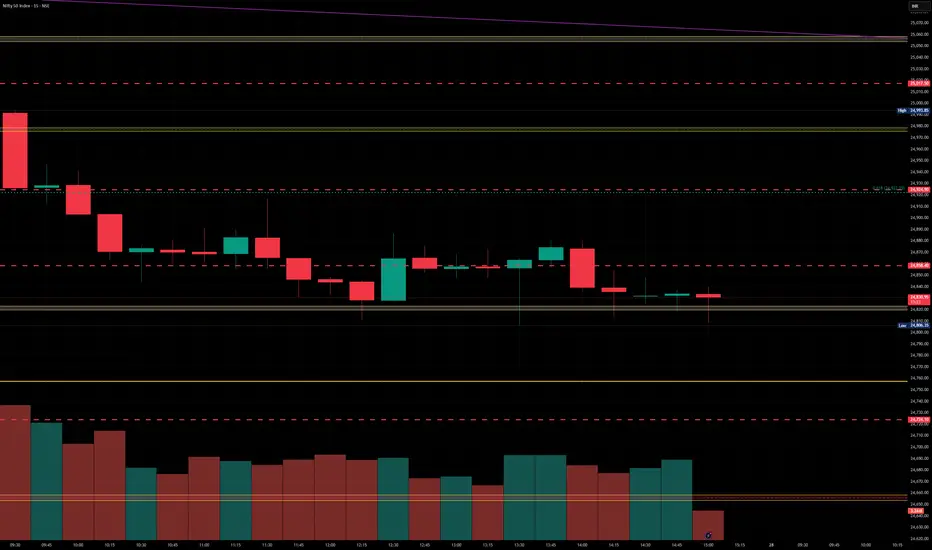
Nifty levels - Jul 28, 2025Nifty support and resistance levels are valuable tools for making informed trading decisions, specifically when combined with the analysis of 5-minute timeframe candlesticks and VWAP. By closely monitoring these levels and observing the price movements within this timeframe, traders can enhance the accuracy of their entry and exit points. It is important to bear in mind that support and resistance levels are not fixed, and they can change over time as market conditions evolve.
The dashed lines on the chart indicate the reaction levels, serving as additional points of significance to consider. Furthermore, take note of the response at the levels of the High, Low, and Close values from the day prior.
We hope you find this information beneficial in your trading endeavors.
* If you found the idea appealing, kindly tap the Boost icon located below the chart. We encourage you to share your thoughts and comments regarding it.
Wishing you success in your trading activities!
DeGRAM | GOLD will retest the channel boundary📊 Technical Analysis
● Fresh rejection at the blue resistance line (~3 435) pushed XAU back to the 3 355 mid-band, yet successive higher-lows (green arrows) keep price inside the May-origin rising channel.
● The pullback is probing 3 328-3 355 — confluence of the former flag roof and triangle top; holding this zone should launch another test of 3 400/3 435, with the channel crest targeting 3 500.
💡 Fundamental Analysis
● U-S S&P-Global PMIs softened, nudging 2-yr real yields to three-week lows, while cautious ECB rhetoric limits dollar gains — both supportive for gold.
✨ Summary
Long 3 328-3 355; above that aims 3 400 ➜ 3 435, stretch 3 500. Invalidate on an H4 close below 3 293.
-------------------
Share your opinion in the comments and support the idea with a like. Thanks for your support!

pull back of HK50 1. bearish BOS
2. after the bearish breakout retest did not go back to the last breakout momentum.
3. tend to sell around 25417 and TP 25212

USDJPY BUY OPPORTUNITY Price provides us with a buy opportunity from the current market price as we see a continuous rise in buy momentum . We’re looking at seeing this momentum reach a high of 151.083 a buy opportunity is envisaged from the current price.

GBPUSD ENTRY CHARTOn this Pair, We are bullish, as the Dollar is still weak and the POUNDS DOLLAR is still in an UPTREND, on the HTF and the MID-TERM-TF, also on the Hourly, we got a Zone with additional confluences that are in align with the Trend, then on our Entry TF, We got a Sweep of LIQ, BOS and IND close to our POI, so we are IN, and if this matches with your TRADE IDEA, i advise you add a good risk management to manage your Trade, THANK YOU.

Bitcoin & 150k TOPBitcoin has been trading within a rising channel for a long time, with resistance at $150,000. The middle support/resistance line also indicates $150,000, suggesting a potential significant rejection at this level.

DeGRAM | ADAUSD holding above the support level📊 Technical Analysis
● Mid-July breakout from the 10-week falling wedge cleared the long-term resistance line; price retested that line & the 0.756 support band (prior range high) and printed a higher-low on the rising channel’s lower rail.
● The new up-sloper guides bulls toward the channel crest / horizontal target at 0.880, while the 0.775–0.780 zone now acts as a launch pad for the next leg.
💡 Fundamental Analysis
● Buzz around August’s Chang governance hard-fork and a 12 % m/m jump in Cardano TVL signal improving network demand, backing the technical upside.
✨ Summary
Buy 0.775-0.790; hold above 0.756 eyes 0.86 ▶ 0.88. Bull view void on a 16 h close below 0.72.
-------------------
Share your opinion in the comments and support the idea with a like. Thanks for your support

NZDUSD Potential UpsidesHey Traders, in today's trading session we are monitoring NZDUSD for a buying opportunity around 0.59800 zone, NZDUSD is trading in an uptrend and currently is in a correction phase in which it is approaching the trend at 0.59800 support and resistance area.
Trade safe, Joe.

SILVER Analysis - Can buyers push toward 4,100$?TRADENATION:XAGUSD is trading within a clear ascending channel, with price action consistently respecting both the upper and lower boundaries. The recent bullish momentum indicates that buyers are in control, suggesting there's chances for potential continuation on the upside.
The price has recently broken above a key resistance zone and now came back for a retest. If this level holds as support, it would reinforce the bullish structure and increase the likelihood of a move toward the 4,100 target, which aligns with the channel’s upper boundary.
As long as the price remains above this support zone, the bullish outlook stays intact. However, a failure to hold above this level could invalidate the bullish scenario and increase the likelihood of a deeper pullback.
Remember, always confirm your setups and use proper risk management.
Disclosure: I am part of Trade Nation's Influencer program and receive a monthly fee for using their TradingView charts in my analysis.

NAS100 steadies at high levels, pay attention nextThe most recent move on NAS100 saw a sharp drop that briefly recovered, likely triggering stops before aggressively reversing from the lower boundary of the newly projected channel. This isn't a cause for concern, on the contrary, it's another opportunity to get involved.
That is because this drop and recovery is a common behavior in strong uptrends before resuming bullish momentum.
The market is likely in the early stages of a new impulsive leg to the upside right here.
We could either have short-term consolidation or pullback, then a continuation toward the upper channel boundary or straight upwards, and with NAS100, the latter is more plausible.
My target will be at 23,300 around the upper boundary of the projected channel resistance.
In this context, the market remains bullish clearly. The most interesting aspect is the emotional flush on the last drop, trapping sellers before fueling what could be another big leg up.

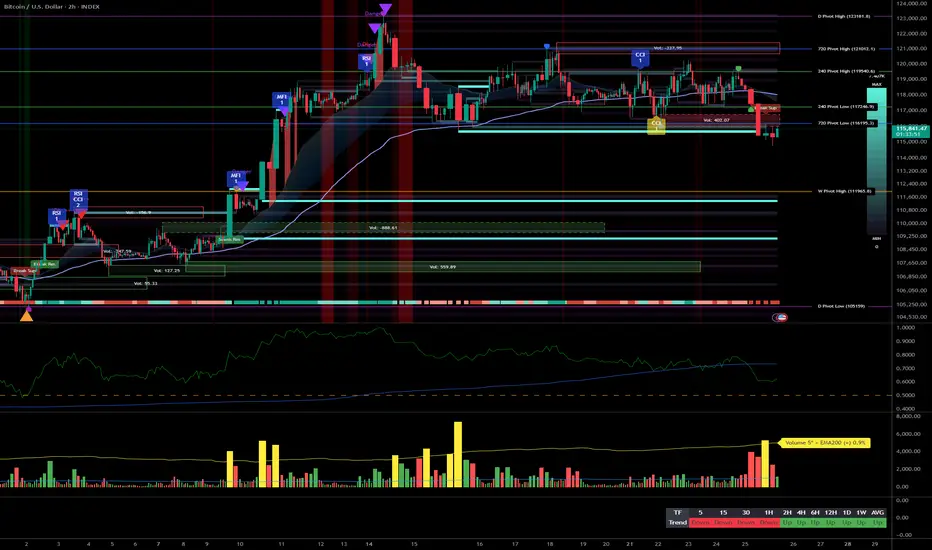
Bitcoin: Strategic Entry Plan on Pullback – 116k Buy Opportunity__________________________________________________________________________________
Technical Overview – Summary Points
➤ Bullish momentum across all higher timeframes (1H to 1W) supported by Risk On / Risk Off Indicator (Strong Buy).
➤ Major supports: 116,128 and 111,980 (multi-timeframe pivots). Key resistance at 123,218.
➤ Very high intraday volumes, pointing towards probable capitulation zones.
➤ Multi-timeframe behaviors: Technical rebound anticipated on the 116,128–115,600 zone, caution if 111,980 breaks.
__________________________________________________________________________________
Strategic Summary
➤ Global Bias: Bullish confirmed mid/long-term.
➤ Accumulation opportunities on key pullbacks near 116,128 and 111,980.
➤ Risk zone: sustained closes below 111,980 = invalidation of bullish outlook (target 105,100).
➤ Macro catalysts: FOMC meeting (July 29-30), heightened event-risk period.
➤ Action plan: favor entries after FOMC volatility resolution, stop-loss adjusted below 111,980.
__________________________________________________________________________________
Multi-Timeframe Analysis
Daily (1D) : Compression under 123,218 resistance, primary bullish trend, no extreme signals.
12H : Healthy consolidation under resistance, no euphoria or panic, normal volumes.
6H : Price squeezed between major supports (116,128–111,980), uptrend confirmed.
4H : Institutional volumes on supports, favors technical rebound.
2H : Speculative rebound underway, confirmation needed for short-term bottom.
1H : Strong capitulation signal, record volumes, immediate retest of 116,128 support.
30min : Local oversold status, extreme sentiment, high technical reversal probability.
15min : Phase of panic likely ending, short-term rebound anticipated.
Key Indicators:
Risk On / Risk Off Indicator: Strong buy on 1D–4H, neutral on 30min and 15min.
ISPD DIV: Neutral to Buy (capitulation signaled on 1H+30min).
Volumes: Very high at lows = capitulation + potential bottom.
MTFTI: Up momentum above 1H, down on lower timeframes (30–5min).
__________________________________________________________________________________
Cross Timeframe Synthesis
High timeframe alignment confirms bullish bias, supported by buyer volumes.
Key zone 116,128–111,980 = multi-timeframe support, tactical focus.
Main risk: break of 111,980.
__________________________________________________________________________________
Operational synthesis & macro context
Bullish bias validated unless breakdown below 111,980.
Tactical accumulation window on pullbacks, 1H confirmation needed.
Volatility risk increases ahead/during FOMC, dynamic stop management essential.
Altcoins fragile: extra caution if BTC triggers Risk Off.
Calendar to watch: FOMC (July 29–30), Durable Goods (July 25).
__________________________________________________________________________________
On-Chain (Glassnode) :
BTC consolidates, no extreme signs; ETH outperforming but caution on alts (elevated leverage).
__________________________________________________________________________________
⏳ *Decision Recap for July 25, 2025, 10:56 CEST:*
— BUY ZONE tactical at 116,128–115,600 (BTC), 1H confirmation required.
— Stop-loss below 111,980 / Swing target >120,000–123,218.
— Risks : Fed announcements, flushes on supports, altcoins at risk.
__________________________________________________________________________________
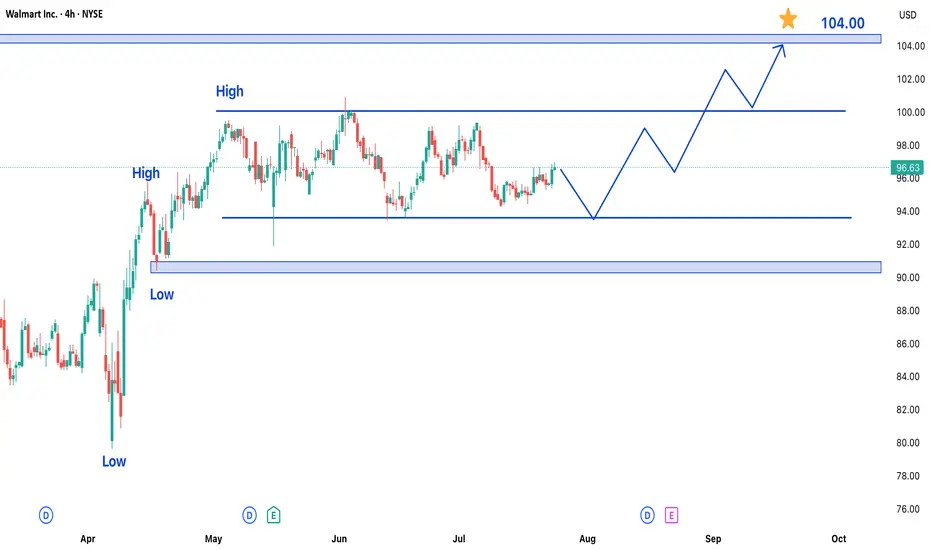
Walmart Stock Trading in Bullish Trend - Upside Potential AheadWalmart Inc. (WMT) shares are currently exhibiting a bullish trend, maintaining upward momentum over recent trading sessions. While the stock has been consolidating in a range over the past few days, the broader outlook remains positive, suggesting potential for further gains in upcoming sessions.
Key Observations:
- Established Uptrend: Walmart's price action reflects sustained buying interest, keeping the stock in a bullish phase.
- Range-Bound Consolidation: Recent sideways movement indicates a temporary pause, often a precursor to the next directional move.
- Strong Support & Resistance Levels: The stock has formed clear reference points for traders to watch.
Price Projections:
- Upside Target at $105: A breakout above the current range could propel WMT toward the $105 resistance level, representing a significant upside opportunity.
- Key Support at $90: On the downside, the $90 level has emerged as a strong support zone. Any pullback is likely to find buying interest near this area.
Market Implications:
1. Bullish Continuation Likely: The consolidation within an uptrend typically resolves in the direction of the prevailing trend—in this case, upward.
2. Breakout Potential: A decisive move above the recent range high could accelerate buying momentum toward $105.
3. Risk Management Consideration: While the bias is bullish, a drop below $90 would signal weakening momentum and potentially invalidate the near-term upside scenario.
Trading Strategy:
- Entry: Consider long positions on a confirmed breakout above the range, or on dips near $90 support.
- Stop Loss: A close below $90 would suggest a trend reversal, warranting exit from bullish positions.
- Target: $105 serves as the primary upside objective, with interim resistance levels to monitor along the way.
Final Thoughts:
Walmart’s stock appears poised for further gains, with $105 as the next key target. Traders should watch for a breakout from the current range while keeping an eye on the $90 support level for risk management. As always, confirmation through price action and volume will be crucial for validating the bullish thesis.

DeGRAM | EURGBP exited the channel📊 Technical Analysis
● Fresh rejection at the blue resistance line (~3 435) pushed XAU back to the 3 355 mid-band, yet successive higher-lows (green arrows) keep price inside the May-origin rising channel.
● The pullback is probing 3 328-3 355 — confluence of the former flag roof and triangle top; holding this zone should launch another test of 3 400/3 435, with the channel crest targeting 3 500.
💡 Fundamental Analysis
● U-S S&P-Global PMIs softened, nudging 2-yr real yields to three-week lows, while cautious ECB rhetoric limits dollar gains — both supportive for gold.
✨ Summary
Long 3 328-3 355; above that aims 3 400 ➜ 3 435, stretch 3 500. Invalidate on an H4 close below 3 293.
-------------------
Share your opinion in the comments and support the idea with like. Thanks for your support!

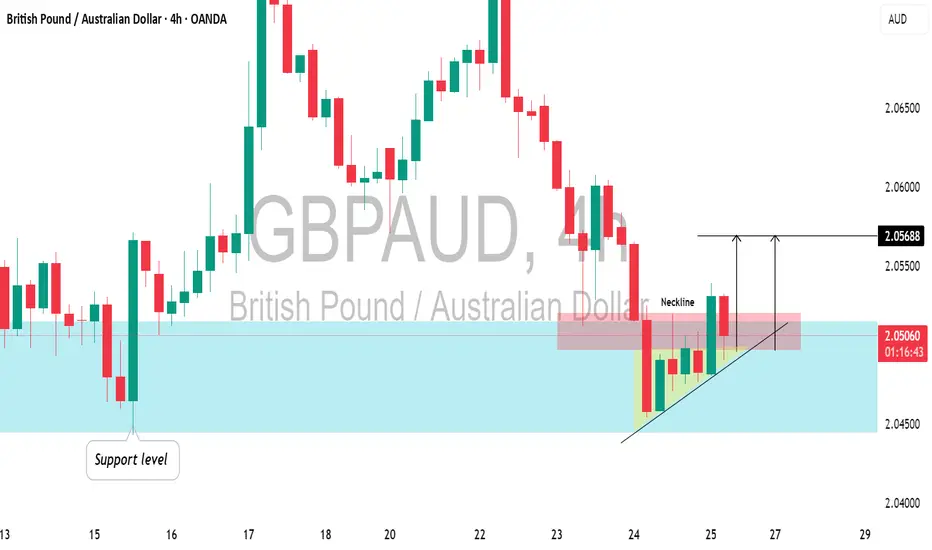
GBPAUD: Another Pullback Trade for TodayGBPAUD formed an ascending triangle pattern at a significant daily/intraday horizontal support.
And breaking its neckline indicates buyer strength.
I anticipate the pair could rise to the 2.0568 level.
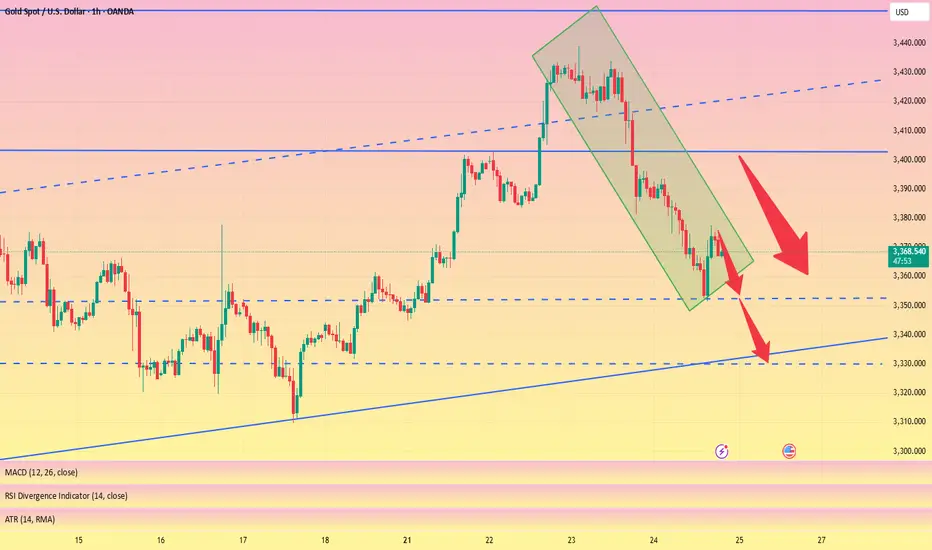
Trend corrected, long funds reduced, sellers returned#XAUUSD
The current moving average is still spreading downward, and the 4-hour chart closed with a large negative line. The market has not yet given a clear feedback on the current trend. However, after a large amount of buying funds intervened, the gold price hit a high of around 3377 and then stagnated. The short-term bullish momentum has weakened, and there is a certain risk of a correction and decline. Sellers are beginning to return📉.
Currently, you can consider participating in short selling at 3370-3377💡. If it rebounds directly to 3400-3405, you can still short if it does not break🔍. The target is 3360 below, and 3350 or even 3330 if it breaks🎯.
🚀 SELL 3370-3377
🚀 TP 3360-3350
Walmart Stock Trading in Bullish Trend – Upside Potential AheadWalmart Inc. (WMT) shares are currently exhibiting a bullish trend, maintaining upward momentum over recent trading sessions. While the stock has been consolidating in a range over the past few days, the broader outlook remains positive, suggesting potential for further gains in upcoming sessions.
Key Observations:
- Established Uptrend: Walmart's price action reflects sustained buying interest, keeping the stock in a bullish phase.
- Range-Bound Consolidation: Recent sideways movement indicates a temporary pause, often a precursor to the next directional move.
- Strong Support & Resistance Levels: The stock has formed clear reference points for traders to watch.
Price Projections:
- Upside Target at $105: A breakout above the current range could propel WMT toward the $105 resistance level, representing a significant upside opportunity.
- Key Support at $90: On the downside, the $90 level has emerged as a strong support zone. Any pullback is likely to find buying interest near this area.
Market Implications:
1. Bullish Continuation Likely: The consolidation within an uptrend typically resolves in the direction of the prevailing trend—in this case, upward.
2. Breakout Potential: A decisive move above the recent range high could accelerate buying momentum toward $105.
3. Risk Management Consideration: While the bias is bullish, a drop below $90 would signal weakening momentum and potentially invalidate the near-term upside scenario.
Trading Strategy:
- Entry: Consider long positions on a confirmed breakout above the range, or on dips near $90 support.
- Stop Loss: A close below $90 would suggest a trend reversal, warranting exit from bullish positions.
- Target: $105 serves as the primary upside objective, with interim resistance levels to monitor along the way.
Final Thoughts:
Walmart’s stock appears poised for further gains, with $105 as the next key target. Traders should watch for a breakout from the current range while keeping an eye on the $90 support level for risk management. As always, confirmation through price action and volume will be crucial for validating the bullish thesis.
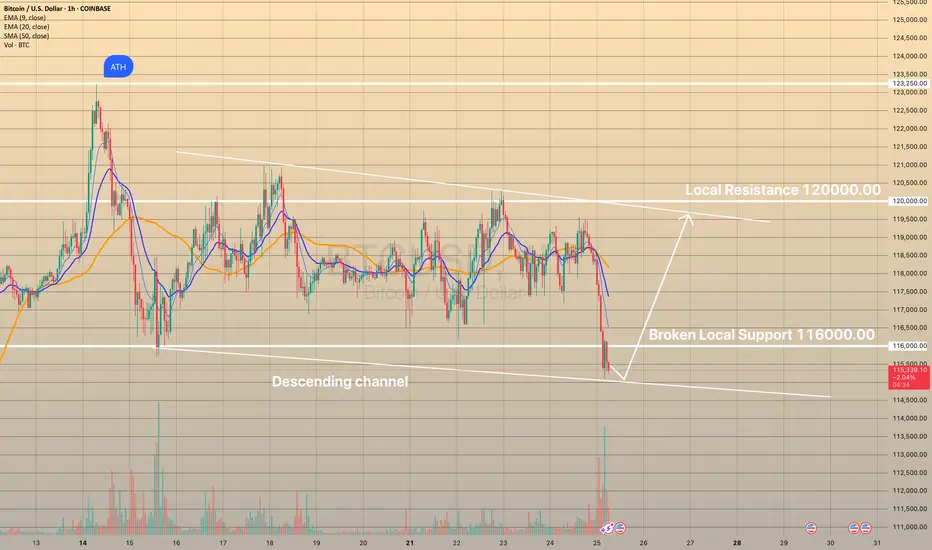
BTCUSD DROPPED BELOW LOCAL SUPPORTBTCUSD DROPPED BELOW LOCAL SUPPORT📉
Today bitcoin dropped below the level of 116,000.00 on high volume. However, the price didn't go somewhere far downwards and consolidates slightly below this level. Presumably, descending channel may be formed.
What is a descending channel?
A descending channel is a bearish chart pattern formed by two downward-sloping parallel trendlines connecting lower highs and lower lows in a pair’s price, indicating a consistent downtrend. It shows sellers are in control, with prices declining within a defined range.
Here I presume the price to rebound from lower border of the descending channel with possible movement towards upper border slightly below the 120,000.00 level.
EURUSD HOLDS BULLISH MOMENTUMEURUSD HOLDS BULLISH MOMENTUM📈
24 July I wrote about bearish divergence in EURUSD. Now we see that this resulted into decline towards sma200 on 30-m chart. Currently the price is rebounding from this moving average.
What is the sma200?
The sma200 is a technical indicator that calculates the average closing price of a forex pair or crypto over the past 200 trading periods. It’s used to identify long-term trends, smooth out short-term price fluctuations, and determine potential support or resistance levels.
There is high possibility that the price will continue its way towards local resistance of 1.18300.

Quick short on the pull back of EURUSDPrice touched a supply zone and formed a break of structure on the 1 hour. I may have missed the entry, but i placed a sell limit with a TP to the imbalance below.
