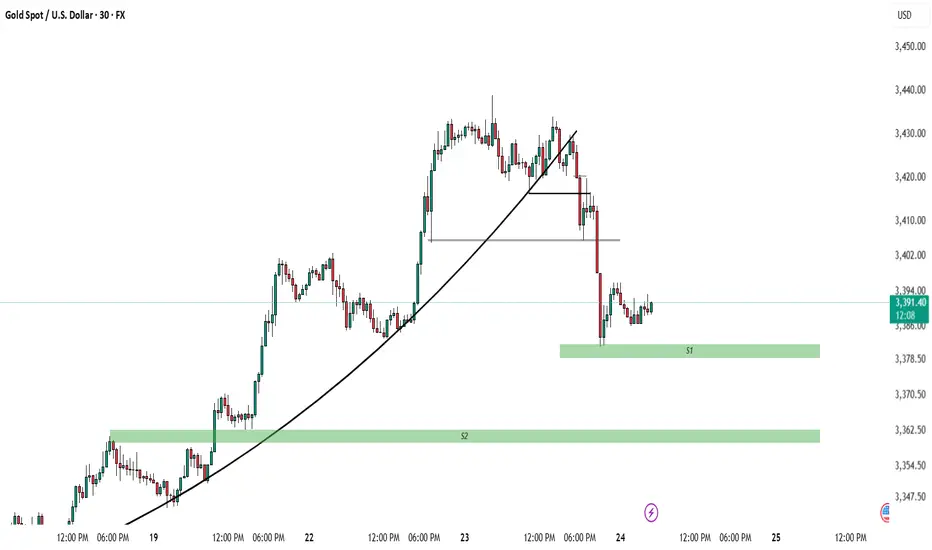
XAUUSDA little insight as to what to look out for on Gold as it finds areas to bounce from so it continues it's initial bullish momentum.
Support and Resistance

XLY eyes on $198: Major resistance zone for recovery wave XLYXLY is a key etf/index to evaluate tariff sentiment.
Currently fighting a major resistance $197.88-193.23
Look for a Break-and-Run or Reject hard from here.

USDJPY range-bound trade- Trade is based on potential breakout on either side as range bound markets are there to be broken

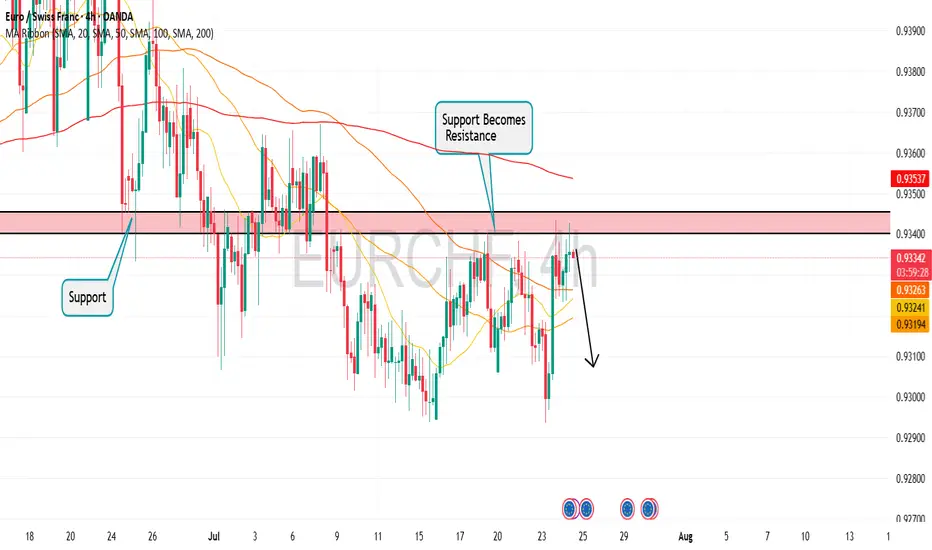
EURCHF Is in The Selling Direction Hello Traders
In This Chart EURCHF HOURLY Forex Forecast By FOREX PLANET
today EURCHF analysis 👆
🟢This Chart includes_ (EURCHF market update)
🟢What is The Next Opportunity on EURCHF Market
🟢how to Enter to the Valid Entry With Assurance Profit
This CHART is For Trader's that Want to Improve Their Technical Analysis Skills and Their Trading By Understanding How To Analyze The Market Using Multiple Timeframes and Understanding The Bigger Picture on the Charts
LCTITAN - The LOW is getting HIGHER !LCTITAN - CURRENT PRICE : RM0.470
The stock made a HIGHER LOW recently - this may consider as a half portion of new uptrend is completed. A breakout above RM0.630 will form the higher high structure - which confirm the new uptrend phase.
For short term trading purposes, short term traders may anticipate to buy if the stock breakout nearest resistance of RM0.520 - which will give an entry point at RM0.525. So this is a pending breakout stock. Nearest target will be RM0.580 and RM0.620. Take note that when the price breakout RM0.520 , it will also be above EMA 50 and ICHIMOKU CLOUD - which strengthening the bullish outlook.
ENTRY PRICE : RM0.525
TARGET : RM0.580 and RM0.620
SUPPORT : EMA 50
Notes : The higher low structure of LCTITAN looks like DRBHCOM - I share the link here for reading purposes.

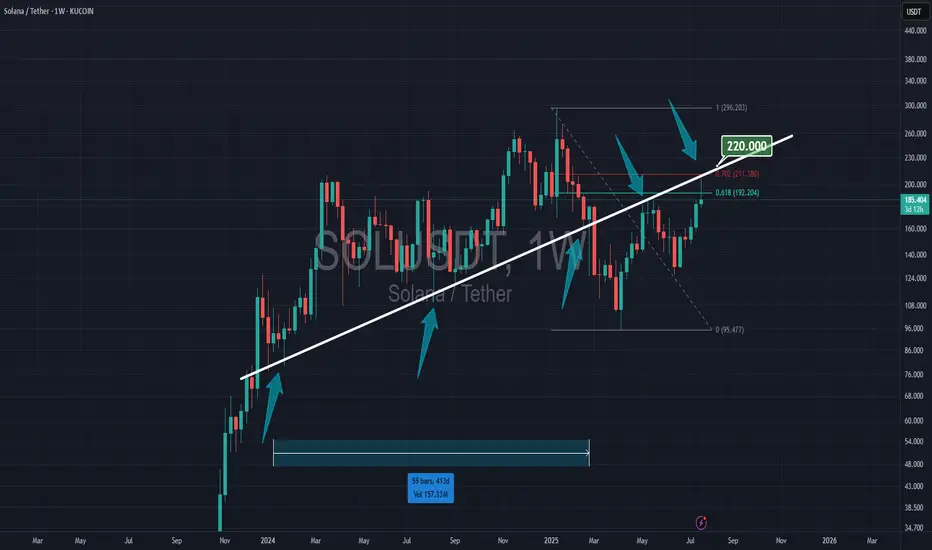
SOLANA & 220 RESISTANCESolana is at 61% of Fibonacci, and the trendline has held since early 2024. To stay in the bull run, Solana must break the 220 resistance.
GBPUSD Long IdeaGBPUSD has formed Higher Low which indicates bullish movement and the price rejected previous major support zone. TP1 is the zone that is most probable for me.
Good Luck!

XAU/USD LONG XAU/USD LONG " break of a resistance area and retest it + 61.8 % fib retracement + 50 ema dynamic support "

XAUUSD Entry PossibilityFX:XAUUSD
🔥 Clean S&R + Previous FVG Confluence 🔥
30M sniper setup with high R:R 📈
Let me know your thoughts! 🧠👇
Possibilities For Entries!
1) If market Sweep Liquidity below 3382-3380 then wait for Bullish formation to Enter in Market
2) If Liquidity didn't sweep instead market close below these then wait for Retracement to go in sell side until 3360 Support
3) When Entry is place take 1:2 as partial Close and Let other position with breakeven SL. Open Until 3401 if get rejection then close.
IF NOT then keep it 3414-3430.
Stock Of The Day / 07.23.25 / FI07.23.2025 / NYSE:FI
Fundamentals. The earnings report exceeded expectations.
Technical analysis.
Daily chart: Downtrend
Premarket: Gap Down on increased volume. We mark the premarket low of 136.0
Trading session: The price did not continue the downward movement and formed an uptrend after the initial impulse down. The key moment is the reaction to the level of 136.0: if the downward trend will continue or the trend change to an uptrend will be confirmed. We observe the price tightening to the level of 136.0 against the uptrend with a clear hold of the level, after breakout the level. We consider a long trade to continue the upward movement in case tightening structure is broken upward.
Trading scenario: pullback along the trend (false_tightening) to level 136.0
Entry: 137.21 when the tightening structure is broken with exit upwards.
Stop: 135.79 we hide it behind the tail of the last pullback.
Exit: You can hold the position until the end of the session with due patience.
Risk Rewards: 1/4
P.S. In order to understand the idea of the Stock Of The Day analysis, please read the following information .

Litecoin - Expecting Bullish Continuation In The Short TermH4 - We have a clean bullish trend with the price creating a series of higher highs, higher lows structure.
This strong bullish momentum is followed by a pullback.
No opposite signs.
Until the two Fibonacci support zones hold I expect the price to move higher further.
If you enjoy this idea, don’t forget to LIKE 👍, FOLLOW ✅, SHARE 🙌, and COMMENT ✍! Drop your thoughts and charts below to keep the discussion going. Your support helps keep this content free and reach more people! 🚀
--------------------------------------------------------------------------------------------------------------------

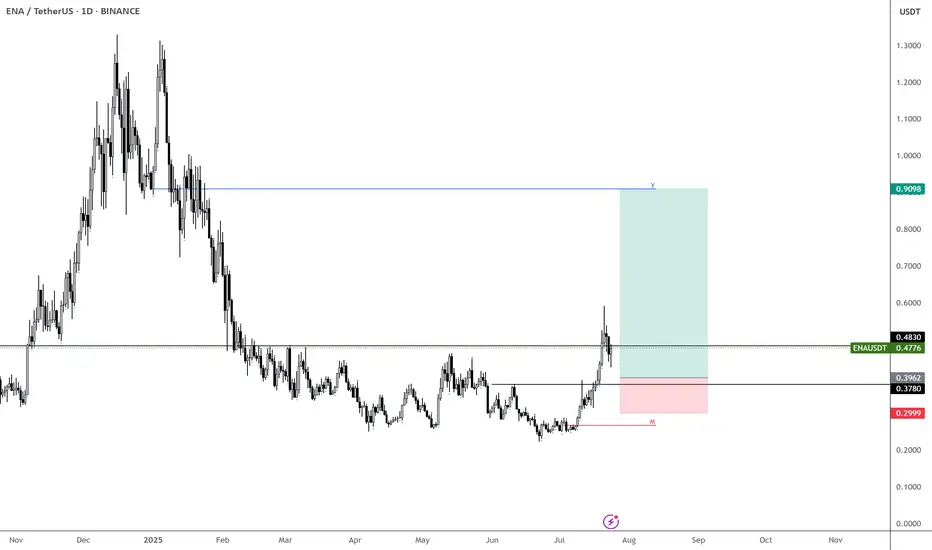
ENA – Sub-40c Would Be a Gift
If we get BINANCE:ENAUSDT below 40c, that would be an incredible opportunity.
Maybe I’m being too greedy—or maybe not. I’ll let the market decide.
Right now, ENA looks like a solid play for the coming weeks, so I’m focused on finding the best possible entry.
MARKETSCOM:ETHEREUM still looks strong overall. Even with a minor retrace, I’m expecting higher—potentially up to $7k.
So it makes sense to position in names like BINANCE:ENAUSDT , BINANCE:EIGENUSDT , BINANCE:AAVEUSDT , and others to ride the wave.
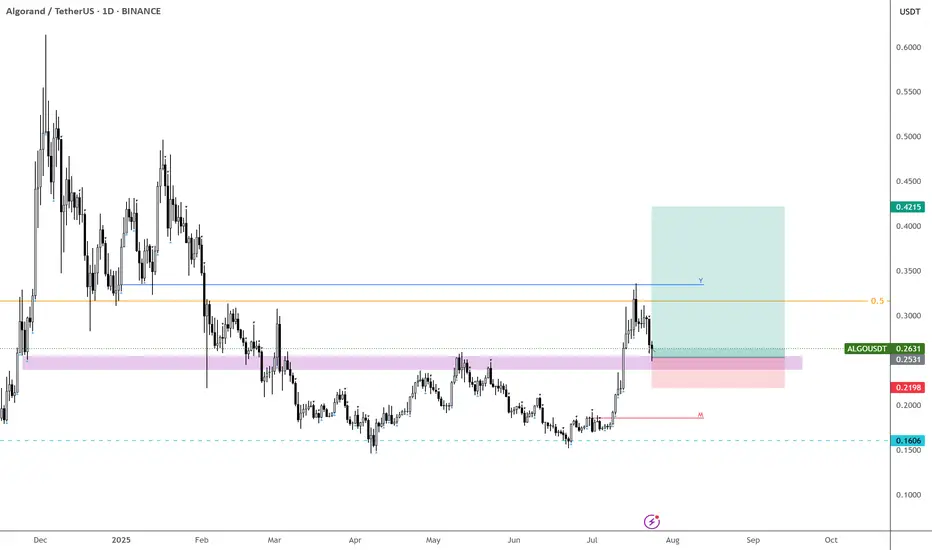
ALGO – Finally Getting the Retrace
Back at EURONEXT:ALGO —missed the lows, but finally seeing the retrace I’ve been waiting for.
Should’ve entered alongside CRYPTOCAP:HBAR , but this is the next best spot.
If this level doesn’t hold, we’re likely heading back below 20c, and many alts could retrace their entire impulse moves.
Starting to bid here—let’s see if it holds. BINANCE:ALGOUSDT
What the Market Is Telling Us About Altcoin Season in 2025Altcoin season is that highly anticipated market phase where alternative cryptocurrencies outperform Bitcoin and dominate trading activity. As we move through 2025, several key signals suggest we may be entering just such a phase—and investors are paying close attention.
Key Market Indicators
Bitcoin dominance is falling below 50–52%, historically a sign of capital rotation into altcoins.
Trading volumes are spiking in Ethereum, Solana, Chainlink, Toncoin, and others.
Sector-specific excitement is building around Web3, AI tokens, and decentralized physical infrastructure (DePIN).
While this might be just the early stage of the altcoin cycle, the smart money is already positioning.
Investor Considerations
Focus on projects with real fundamentals. Ethereum, Avalanche, Cosmos, and Chainlink remain top infrastructure bets.
Utility is key. Projects with real-world application, strong developer activity, and growing user bases are best positioned for long-term growth.
Track sentiment. Watch for social buzz, news momentum, and open interest increases—often the earliest signs of breakout moves.
Bottom Line
Altcoin season doesn’t happen overnight. What we’re seeing now is the accumulation phase—an ideal time for data-driven investors to build high-upside portfolios. But caution is critical. Not every pump is sustainable, and smart risk management remains non-negotiable.
For those who prepare wisely, the 2025 altcoin season could unlock some of the most lucrative opportunities in the crypto space.

Awaiting entry, $TOSHIUSDT looks prime for a double top!Hard to gauge if we get a drop from here — but if we do, I’d love to see a ~20% flush into key support.
Not counting on it just yet, but the chart is coiled and primed for either direction. A potential 2x setup is on deck, so this one needs to be closely monitored given where it currently sits.
Two clear paths:
Flush into demand (my preferred entry)
Or a reclaim of the purple block to confirm continuation
⚠️ MEXC:TOSHIUSDT has strong technicals — keep it firmly on your watchlist.

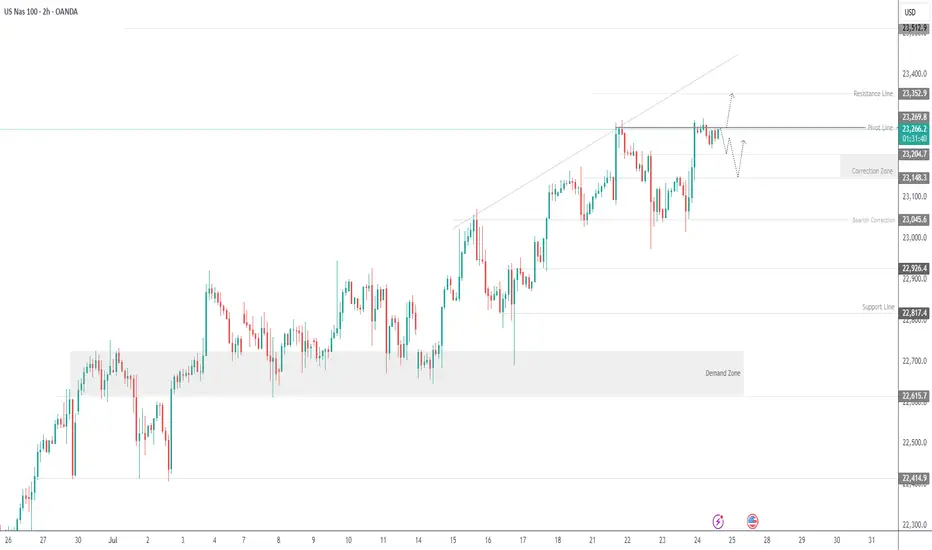
USNAS100 - Tech Index Pulls Back After Testing 23,295USNAS100 | OVERVIEW
The index came close to registering a new ATH at 23,295 before pulling back slightly.
Today, it appears to be in a bearish correction phase toward 23,200 and 23,150, as long as the price trades below 23,270.
Market sentiment may remain cautious, especially with no major earnings reports scheduled before the open, although Intel’s report after the close could have a notable impact.
A 1H close above 23,290 would invalidate the correction and open the way toward 23,350 and 23,500.
Key Levels:
Support: 23,200 · 23,150 · 23,050
Resistance: 23,350 · 23,520
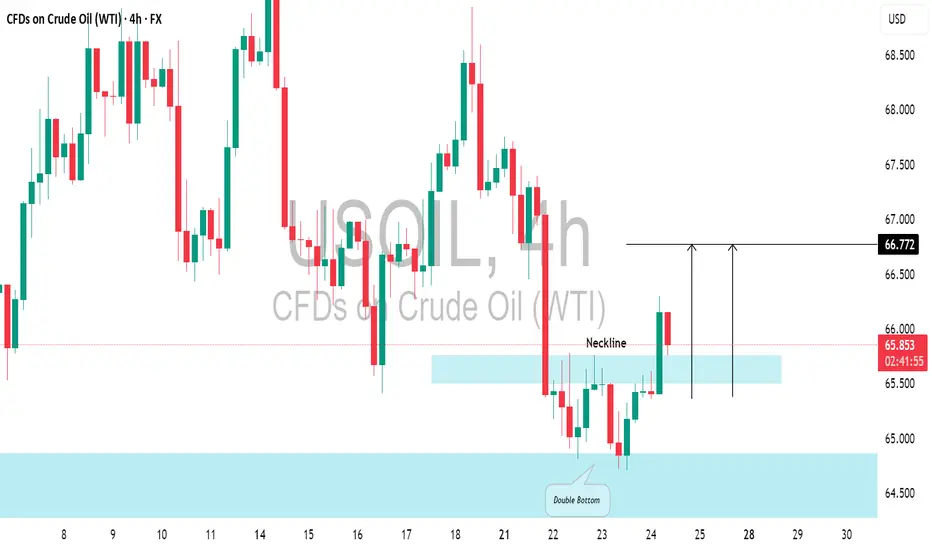
US CRUDE OIL (WTI): Pullback From Support📈USOIL responded well to the highlighted daily support level.
The price formed a double bottom pattern on that and broke above its neckline.
There's a strong likelihood that the price will continue to increase and reach 66.72 shortly.
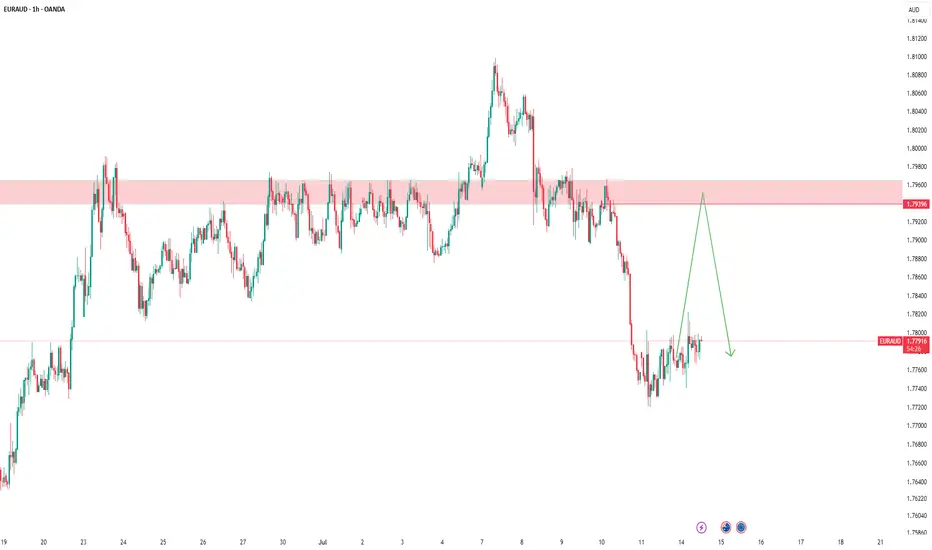
EURAUD – Planning Ahead, Not PredictingAs usual, I have marked my level.
🎯 I’m waiting for the price to reach it and if a valid sell signal appears, I will enter a short position.
If the level is broken cleanly,
I’ll wait for a pullback and enter a buy trade.
We are just traders, not predictors.
We have no impact on the market —
we are just a tiny part of a huge system.
🧠 So I never say: “Price will come here, then must fall.”
That’s not my mindset.
My belief is simple:
Manage risk, be prepared for everything.
One trade won’t make me rich,
and I won’t let one trade destroy me.
📌 Stop-loss is the first and last rule.
Trading without a stop-loss is just gambling.
LONG ON GBP/AUDGA has given us a CHOC (change of character) to the upside after making a new low.
Price has since pulled back to the demand area that created that change leaving us with a possible double bottom forming.
I expect GA to rise to sweep buy side liquidity at the equal highs then reaching the previous supply level / previous High.
Looking to catch 200-300 pips.

US30 Hits New All-Time High – What’s Next?US30 | OVERVIEW
The price has printed a new all-time high, exactly reaching our target at 45,090, as previously anticipated.
Today, we may see a correction toward 44,770 and 44,610. If the price stabilizes above these levels, another bullish leg is expected.
On the upside, a break above 44,910 would confirm a bullish continuation toward 45,090 and 45,250.
Key Levels:
Support: 44,770 · 44,610 · 44,370
Resistance: 45,090 · 45,250
previous idea:

Double Down on Gold — Targeting 3400–3410!Obviously, gold did not give us the opportunity to short gold near 3440 today. In the process of its recent pullback, gold tested 3400 as expected, and after falling below 3400, it continued to fall to around 3385 as if it was planned by me. Although the lowest point had reached around 3381, it quickly rebounded above 3385. What is relatively regrettable today is that both of our plans to short gold ended in failure. The first time was when gold did not give us the opportunity to short near 3440. The second time was when we were preparing to short gold at 3400 and set the TP to 3385. However, we did not have time to create an order because the price fell too quickly, causing us to miss the gold short trade again.
At present, I have a trading order to go long on gold near 3386. And I go long on gold with twice the usual trading volume. Why am I still optimistic about the rebound of gold in the short term after the gold price fell by nearly $60? Because the area around 3385 is the short-term bull-bear dividing line, although gold has fallen sharply, as long as it stays above the area around 3385, gold is still in a bullish trend as a whole, and the bullish structure has not been destroyed, so in the short term, gold still has a lot of room for rebound after the pullback. This is why I dare to use twice the usual trading volume to buy gold near 3386.
However, because the current gold long and short continuity is not strong, and the market uncertainty is still increasing due to complex news, the gold market is prone to violent fluctuations in the short term, so we have to be more careful in trading. At present, I still hold a gold long position near 3386, and I hope that gold can continue to rebound to the target area: 3400-3410.

ETH Risk 15% Correction After Fall Below $2,000 What’s Next?Ethereum (ETH), the second-largest cryptocurrency by market cap, has recently fallen below the key $2,000 support level, both technically and psychologically important. This move has fueled bearish sentiment and triggered forecasts of a possible further decline to the $1,700 zone—representing a potential 15% correction from current levels.
Technical Overview
Following the breakdown of the $2,000 support, Ethereum has come under increasing selling pressure. Several technical indicators are pointing toward further downside:
RSI (Relative Strength Index) has dipped into oversold territory, reflecting strong bearish momentum.
MACD has turned negative, suggesting further downward movement.
The 50-day and 200-day moving averages are approaching a potential death cross, which may confirm a medium-term bearish trend.
Fundamental Headwinds
Declining network activity – Transaction volume, DeFi engagement, and NFT usage on Ethereum are all decreasing, affecting demand for ETH.
Increased liquidity from staking withdrawals – Recent protocol upgrades have led to a rise in ETH available for sale.
Rising competition from L2 and alternative chains (e.g., Solana, Avalanche) – This is drawing capital and attention away from Ethereum.
Where Is the Next Support?
Key support zones lie near $1,850 and then at $1,700. If these levels fail, ETH could potentially drop to the March lows around $1,500. That said, such a move would likely require a major macroeconomic shock or a significant negative crypto-specific event.
Is a Reversal Possible?
Despite the bearish signals, ETH still holds strong long-term fundamentals as one of the most widely used blockchain platforms. Potential catalysts for a recovery include:
Renewed interest in staking and on-chain activity.
Positive news regarding spot or futures-based ETH ETFs.
Rising developer and institutional engagement, especially around innovations like EigenLayer and L2 adoption.
Conclusion
Ethereum’s breakdown below $2,000 puts it in a technically vulnerable position, with the possibility of further short-term downside. While bearish momentum dominates for now, ETH remains a core asset in the crypto space. Investors should brace for more volatility but also stay alert for signs of recovery as the broader ecosystem continues to evolve.

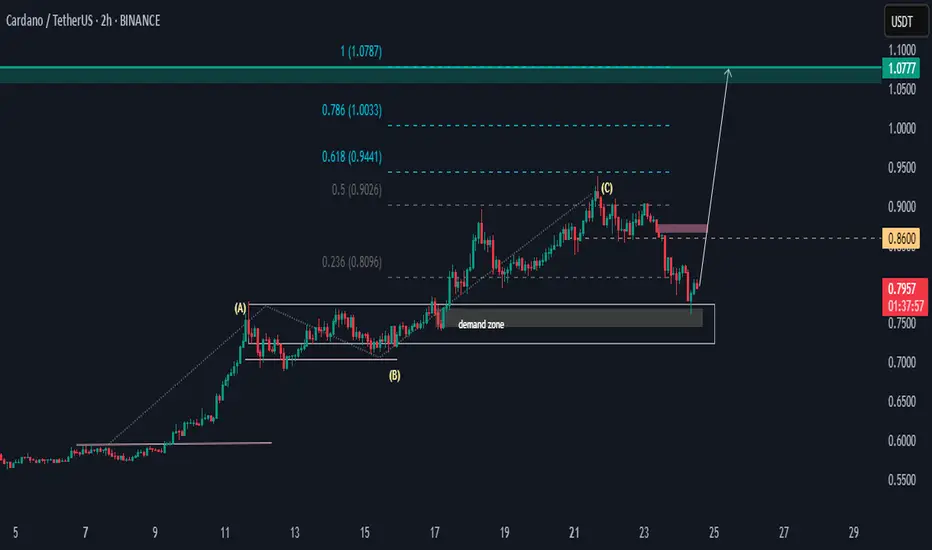
ADAUSDT SND Setup.Hello,
ADAUSDT has the potential to rally from the demand zone of 0.75 to 0.86 before rising above the high of point (C). We have two price targets, with a bias toward 1.0777.
If the price falls below the demand zone, then the setup will be invalid. A generic SND momentum flow analysis.
Happy Trading
Khiwe.