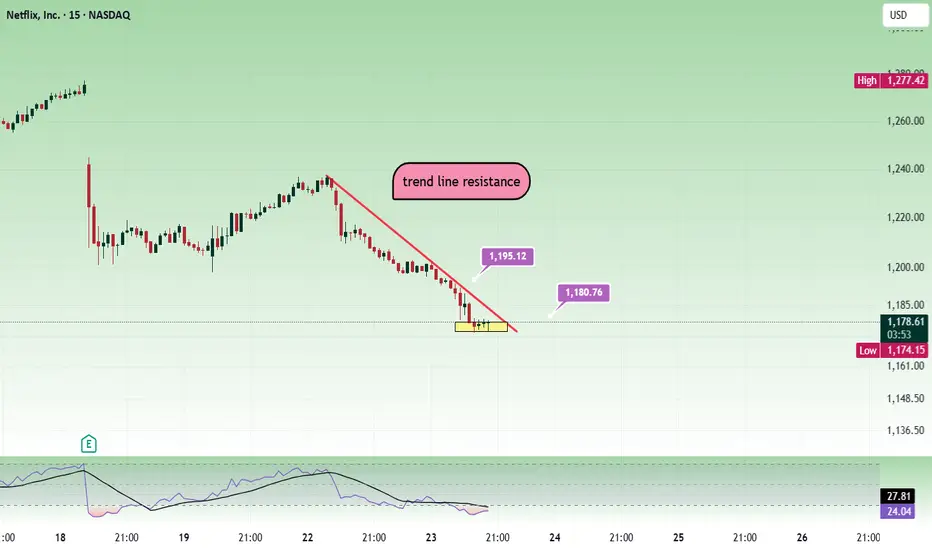
NetflixMay be people are not watching Netflix nowadays and the price is falling. 1200 is a strong resistance.
Sell below 1180 with the stop loss of 1195 for the targets 1165, 1150, 1130 and 1115.
Price can pull back towards 1190 and then fall. Its better to see bearish confirmation and trade.
Always do your own analysis before taking any trade.
Support and Resistance
CLF heads up at $7.51: Golden Genesis fib may give a Dip buyCLF shot up strong after Trump increased tariffs on Steel.
It has just hit a Golden Genesis fib that may give us a dip.
Looking for a dip to $7.06 fib or a Break-n-Retest of 7.51

FAST watch $42.64/76: Double Golden zone holding up new ATH FAST has been grinding higher into ATH territory.
Struggling against Double Golden zone $42.64-42.76
Look for a Break-n-Retest as the likely next move.

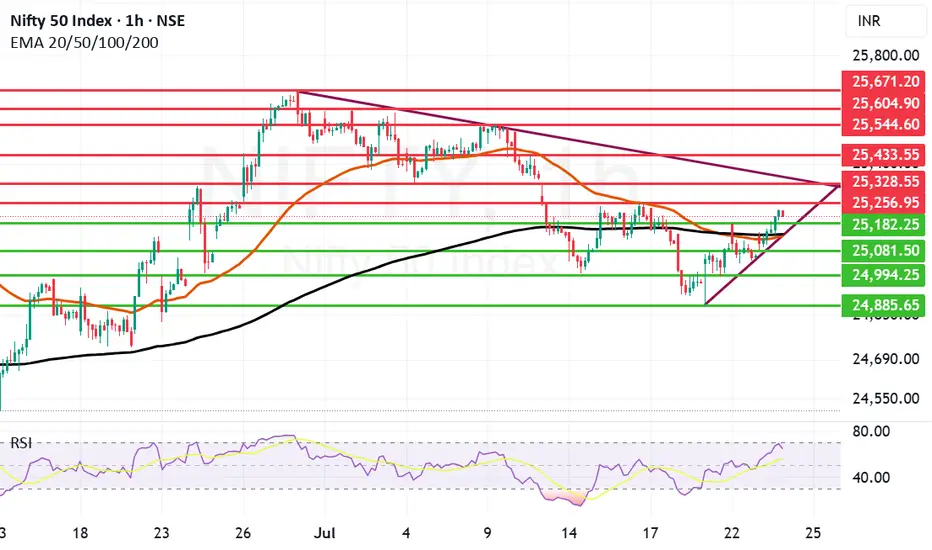
Strong Comeback by Nifty few Resistances ahead.Nifty made a remarkable comeback today ending 159 points up closing at 25219. Infosys has posted better than expected result and as of now the Infosys ADR is up by 1.26%. So if there is a turnaround in the IT sector we can see Nifty fly upwards.
The next resistance ahead of Nifty is at 25256 if we get a closing above this the next will be at 25328. These 2 will be critical resistances to cross. Once we get a closing above 25328 Nifty can target 25433 and 25544. Above 25544 Nifty becomes very strong. In case Nifty is not able to cross 25256 or 25328 levels the supports for Nifty are at 25182. After this zone there is a dual support of Mother and Father line of Hourly chart at 25136 and 25142.
These are very strong supports. (Thus the zone between 25182 to 25136 is full of supports). We hope that these supports are held. In case we get a closing below 25136 Nifty will again fall into bearish territory and can plunge towards 25081, 24994 or even 24885.
The shadow of the candles right now is positive but 2 very important resistances mentioned earlier are yet to crossed so game is in balance but only slightly in favour of Bulls.
Disclaimer: The above information is provided for educational purpose, analysis and paper trading only. Please don't treat this as a buy or sell recommendation for the stock or index. The Techno-Funda analysis is based on data that is more than 3 months old. Supports and Resistances are determined by historic past peaks and Valley in the chart. Many other indicators and patterns like EMA, RSI, MACD, Volumes, Fibonacci, parallel channel etc. use historic data which is 3 months or older cyclical points. There is no guarantee they will work in future as markets are highly volatile and swings in prices are also due to macro and micro factors based on actions taken by the company as well as region and global events. Equity investment is subject to risks. I or my clients or family members might have positions in the stocks that we mention in our educational posts. We will not be responsible for any Profit or loss that may occur due to any financial decision taken based on any data provided in this message. Do consult your investment advisor before taking any financial decisions. Stop losses should be an important part of any investment in equity.
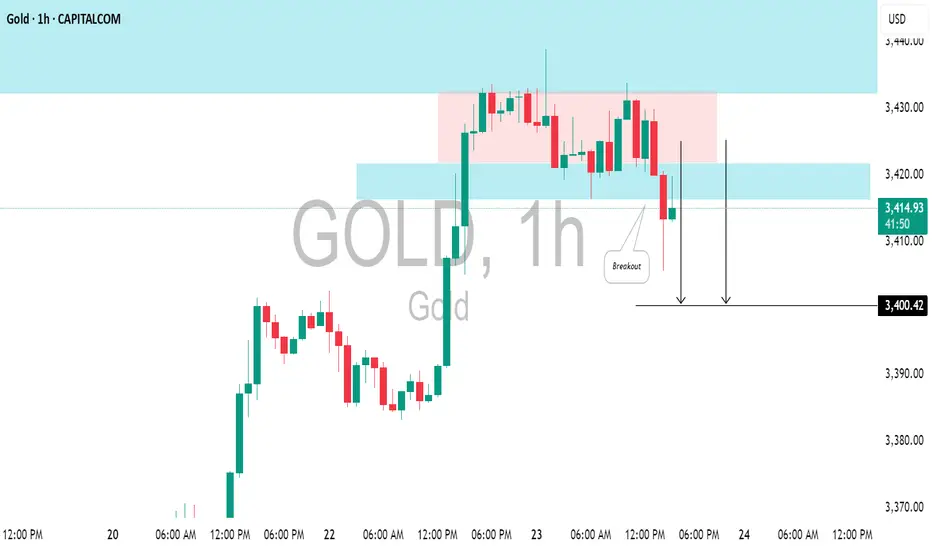
GOLD(#XAUUSD): Pullback From Resistance ConfirmedGOLD could retreat from the highlighted resistance level.
I observed a horizontal trading range pattern following a test of significant intraday resistance, along with a breach of its support level marked by a strong bearish candle.
Target - 3400.
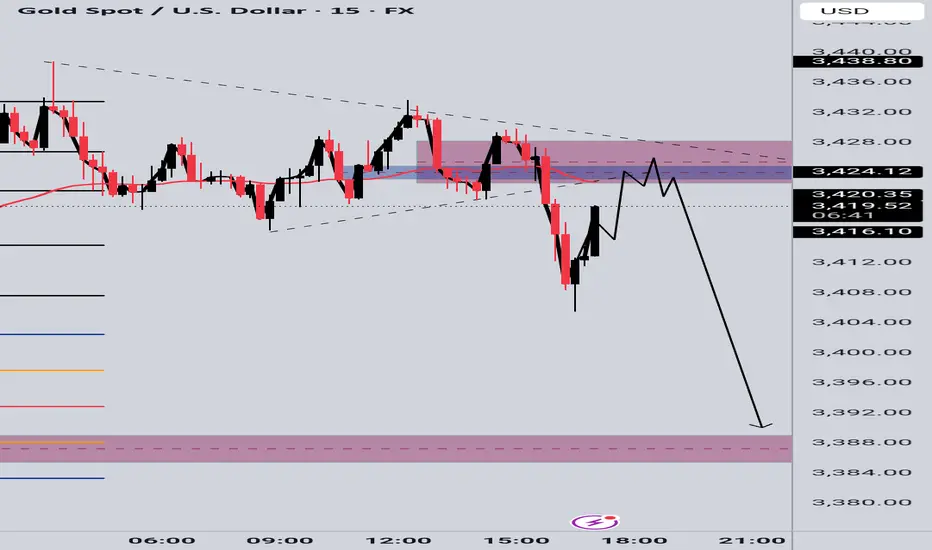
GOLD SELL SETUPWe failed the bullish momentum on previous chart ,now aiming for the continuation to the downside;
🔹 Entry Zone: 3425–3430 (Supply Rejection)
🔸 Trendline Break + Liquidity Sweep Confirmed
🎯 Targets:
— TP1: 3410
— TP2: 3388 (Major Demand Zone)
🔒 Bearish momentum building, watching for continuation toward the lower zone.
CAT watch $308 above 302 below: Major fibs define range to breakCAT just released Earnings report with small "miss".
Price oscillating between major fibs $301.97-308.82
If Bull, look for a pop to tight zone $325.49-326.16

DeGRAM | EURUSD breakout📊 Technical Analysis
● Breakout – candles have closed twice above the channel roof (black), then retested 1.1690 as support (blue circled zone); the pull-back printed higher-lows along the intraday trend-line, confirming a bullish transition.
● The flag forming beneath 1.1750 measures toward the confluence of the July swing high and rising fork top at 1.1810; invalidation rests at the last swing-low 1.1615.
💡 Fundamental Analysis
● Euro sentiment improves after Euro-area core CPI edged up to 2.9 % y/y while soft US durable-goods orders trimmed 2-yr Treasury yields, narrowing the rate gap.
✨ Summary
Buy 1.1685-1.1700; hold above 1.169 targets 1.175 ➜ 1.181. Exit on an H1 close below 1.1615.
-------------------
Share your opinion in the comments and support the idea with a like. Thanks for your support!

NZDUSD: Time For Pullback 🇳🇿🇺🇸
I think that NZDUSD will retrace from the underlined resistance.
As a confirmation, I spotted a bearish imbalance candle on an hourly time frame
after its test.
There is a high chance to see a retracement.
Goal - 0.602
❤️Please, support my work with like, thank you!❤️

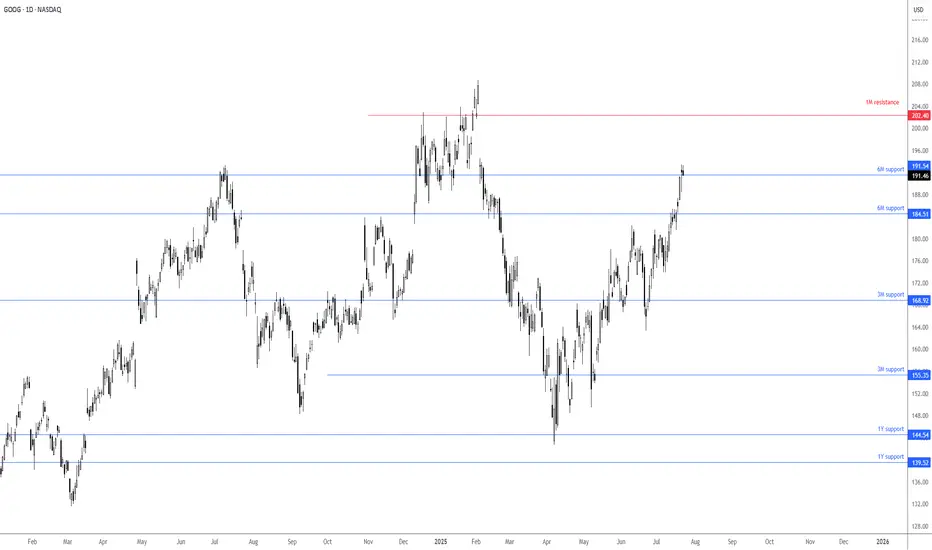
Google trading north of support ahead of earnings!Ahead of today’s Q2 earnings release, you can see the price of Alphabet is trading just above a 6M support at US$191.54. Finding acceptance north of this support level could prompt buyers to change gears and potentially target a 1M resistance level at US$202.40. If price makes it above here, you will likely see the Stock challenge all-time highs of US$208.70, formed in early February this year. Failure to hold above US$191.54, nevertheless, could see price action target 6M support at US$184.51.
FP Markets Research Team.
The real target of gold is more than 3400
💡Message Strategy
The United States has recently made frequent moves in global tariff policies. Treasury Secretary Bensont has clearly set August 1 as a hard deadline for tariff negotiations among countries. At present, EU trade negotiations have been decoupled from the issue of sanctions against Russia and Ukraine, while Japan's negotiations are progressing smoothly.
These dynamics reflect that the United States is reshaping the global trade pattern through differentiated strategies, and countries are forced to adjust their economic and trade policies under the pressure of tariffs. As the deadline approaches, gold is facing a test of long and short positions.
The White House's pressure on the Federal Reserve is still fermenting. The US Treasury Secretary said that the Federal Reserve should cut interest rates now, but at the same time said that there is no sign that Powell should resign now. If he wants to leave early, he should do so. Powell gave a public speech yesterday, but to the disappointment of the market, he did not mention monetary policy and the possibility of resignation. However, Trump's pressure on the Federal Reserve has taken effect, and the market has turned its attention to interest rate cuts.
📊Technical aspects
Yesterday, Tuesday, we believed that the trade negotiations between Europe and the United States were on the verge of breaking down, which led to a rise in risk aversion in the market, boosted gold safe-haven buying, and supported the price of gold to a one-month high.
Therefore, we suggest that you take a bullish approach in terms of operation. Pay attention to the support below at $3,380, and pay attention to the breakthrough of $3,402 above. As expected, it broke through to $3,440, reaching our expected profit target.
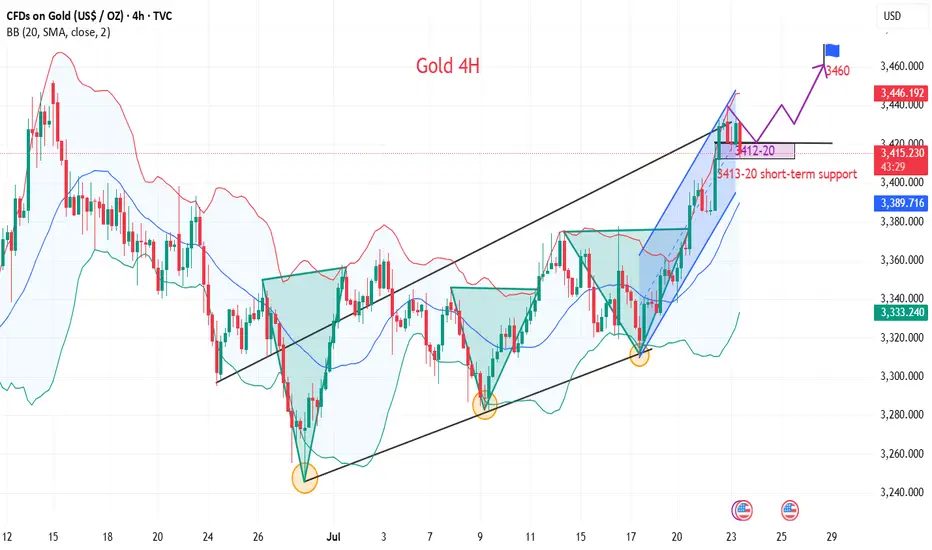
From the 4H trend structure, gold has been climbing rapidly along the upward channel recently. It broke through yesterday and took the 3400 mark in one fell swoop, reaching our expected target of 3440. At present, gold is blocked and falls back on the channel boundary support.
At the same time, the 1-hour RSI broke through the upward trend line support and tested the resistance again, releasing a callback signal in the short term. It is necessary to pay attention to the possibility of short-term adjustments. Today, we can focus on the key resistance around 3415 and try long opportunities.
💰Strategy Package
Long Position:3410-3420,SL:3390,Target: 3440,3460
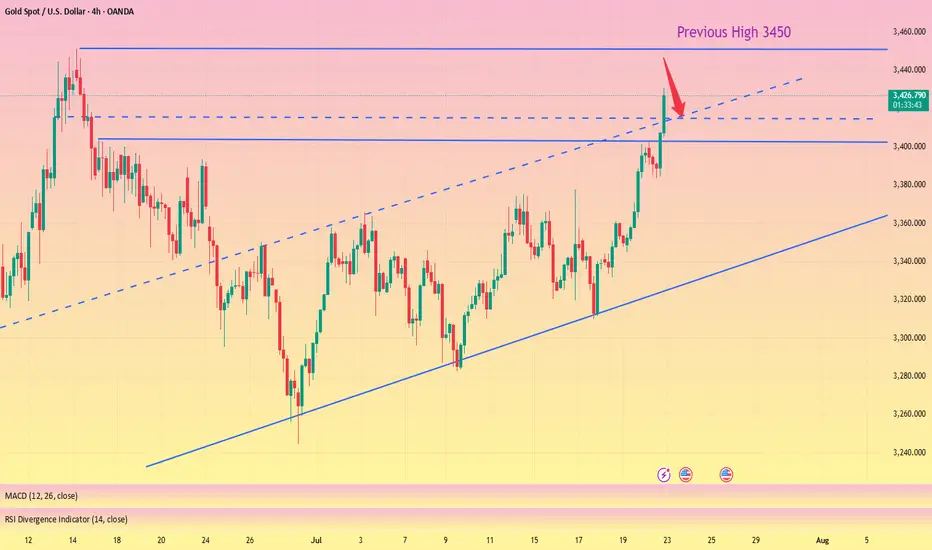
Gold breaks new high, expect a pullback in the evening#XAUUSD
After the rapid rise of the previous day, the gold market has fallen into an overbought state, but yesterday's increase of nearly $60 still provided solid support for the bulls. It is expected that the market will show repeated fluctuations in the future⚖️.
In terms of operation, it is recommended to pay close attention to the gains and losses of the 3,400 mark. If it is successfully broken through, it is expected to further test the 3,420-3,425 and 3,450 lines; on the downside, pay attention to the top and bottom conversion support of 3,403📈.
📊At present, you can consider shorting near 3430, defending 3440, and aiming at 3410💡
🚀SELL 3430-3440
🚀TP 3415-3405
GOLD | Bullish Bias Amid Fed & Trade Policy UncertaintyGOLD | Bullish Bias Amid Fed & Trade Policy Uncertainty
Gold prices edge higher as markets weigh conflicting signals from the Federal Reserve and renewed trade policy uncertainty. Diverging opinions among Fed officials regarding the inflationary impact of President Trump's proposed tariffs have fueled demand for safe-haven assets.
While some members like Waller and Bowman appear open to rate cuts, others remain cautious about lingering inflation risks, adding to market volatility.
Technical Outlook:
Gold maintains bullish momentum above 3365. A break and hold above this pivot supports continuation toward 3375, and if momentum builds, toward 3385 and 3395.
However, any sustained move below 3365 may trigger a bearish correction toward the support zone between 3355 and 3342.
Pivot Line: 3365
Resistance Levels: 3375 · 3385 · 3395
Support Levels: 3355 · 3342
Bias: Bullish above 3365

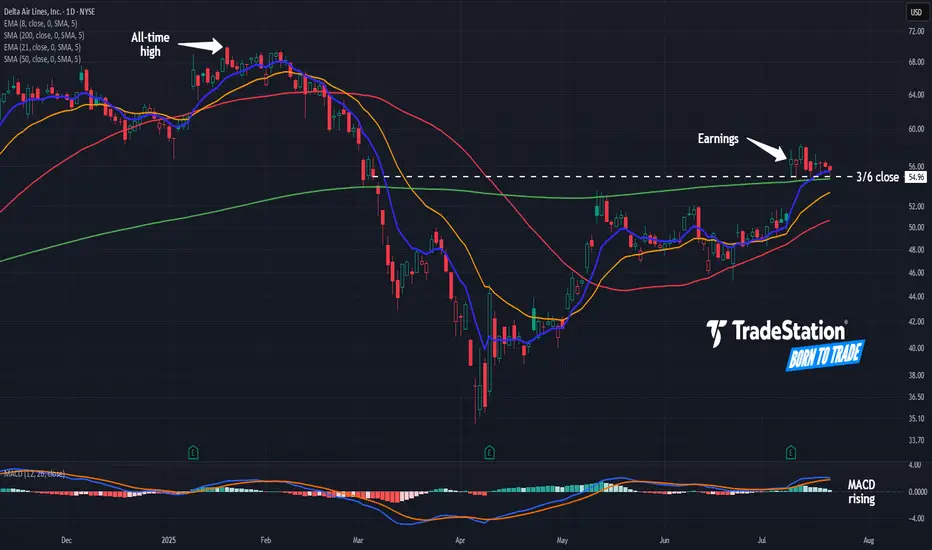
Delta Airlines: Where’s the Pullback?Delta Airlines rallied two weeks ago on strong earnings, and some traders may see further upside.
The first pattern on today’s chart is the tight consolidation pattern since July 10. The lack of pullback could reflect a lack of selling pressure in the transport stock.
Second, DAL has remained above the March 6 closing price of $54.96 and its 200-day simple moving average. Has new support been established above the pre-earnings highs?
Third, the 8-day exponential moving average (EMA) is above the 21-day EMA. MACD is also rising. Those signals may be consistent with short-term bullishness.
TradeStation has, for decades, advanced the trading industry, providing access to stocks, options and futures. If you're born to trade, we could be for you. See our Overview for more.
Past performance, whether actual or indicated by historical tests of strategies, is no guarantee of future performance or success. There is a possibility that you may sustain a loss equal to or greater than your entire investment regardless of which asset class you trade (equities, options or futures); therefore, you should not invest or risk money that you cannot afford to lose. Online trading is not suitable for all investors. View the document titled Characteristics and Risks of Standardized Options at www.TradeStation.com . Before trading any asset class, customers must read the relevant risk disclosure statements on www.TradeStation.com . System access and trade placement and execution may be delayed or fail due to market volatility and volume, quote delays, system and software errors, Internet traffic, outages and other factors.
Securities and futures trading is offered to self-directed customers by TradeStation Securities, Inc., a broker-dealer registered with the Securities and Exchange Commission and a futures commission merchant licensed with the Commodity Futures Trading Commission). TradeStation Securities is a member of the Financial Industry Regulatory Authority, the National Futures Association, and a number of exchanges.
TradeStation Securities, Inc. and TradeStation Technologies, Inc. are each wholly owned subsidiaries of TradeStation Group, Inc., both operating, and providing products and services, under the TradeStation brand and trademark. When applying for, or purchasing, accounts, subscriptions, products and services, it is important that you know which company you will be dealing with. Visit www.TradeStation.com for further important information explaining what this means.
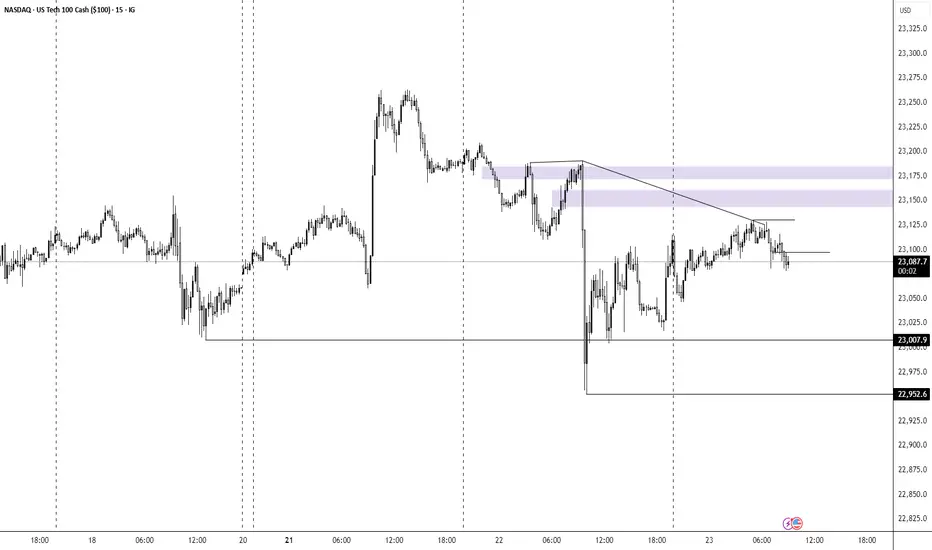
USNAS100 Eyes 23350 Ahead of Powell & Earnings StormUSNAS100
The price maintains bullish momentum, as outlined in the previous idea, with a clean rejection from the 23280 zone. Today, volatility is expected to increase ahead of Jerome Powell’s speech and a wave of key earnings reports.
As long as price holds above 23140, the outlook remains bullish toward 23230 and 23350.
A short-term correction toward 23045 is possible if we get a 1H close below 23140.
Resistance: 23230 · 23350 · 23510
Support: 23045 · 22920

Gold is Targeting Fresh HighsHey Traders, in today's trading session we are monitoring Gold for a buying opportunity around 3,410 zone, Gold is trading in an uptrend and currently is in a correction phase in which it is approaching the trend at 3,410 support and resistance area.
Trade safe, Joe.

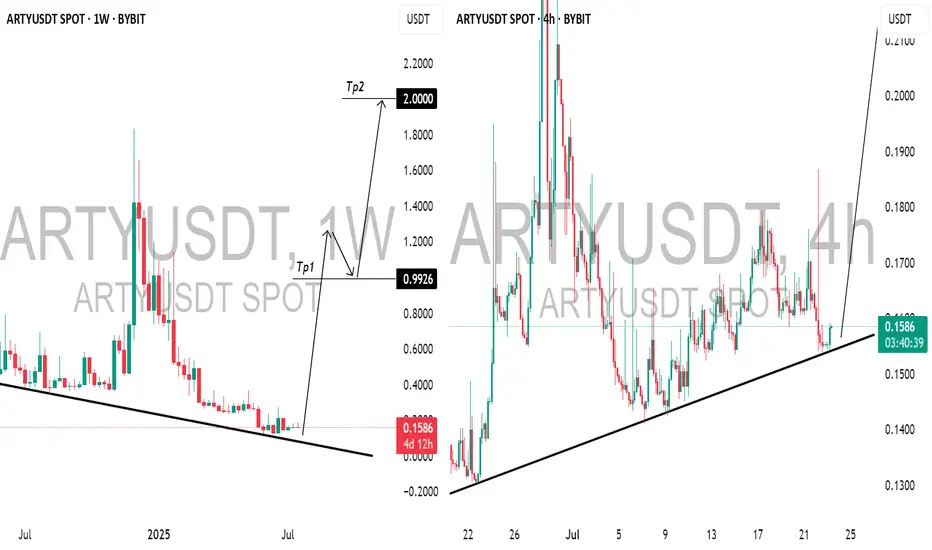
ARTFACT (ARTYUSDT): Bullish Outlook ExplainedThis morning, while analyzing 📈ARTY on a weekly chart, I noticed a promising bullish signal following a test of a falling trend line.
The price has been adhering well to a rising trend line on the 4-hour chart, and after a recent test, we observed a positive bullish reaction, prompting me to enter a long position.
Recently, early investors took profits from three years of staking, alleviating sell pressure. Additionally, Artyfact has introduced its first Play-and-Earn mode, which is expected to attract hundreds of thousands of new players.
This surge in interest will likely increase the demand for AMEX:ARTY and drive up its price, as players can only purchase gaming NFTs using $ARTY.
I believe the price has good potential to rise to 1.00 then to 2.00 soonest.
ADA - pull back then blast offIf ADA breaks below 0.85 I believe the next level of support will be @ 0.78 - this price level acted as resistance and was the Weekly high on 3 x occassions. Thus it is assumed that resistance will flip into support.
Bearish div. Suggests a move down as well as a break in the uptrend.
Entry @ 0.79
TP 1: 1.13
TP2: 1.43
TP3: 2.00
You could take a small short position now and profit in the event that price does start to retrace to 0.78 (ish)

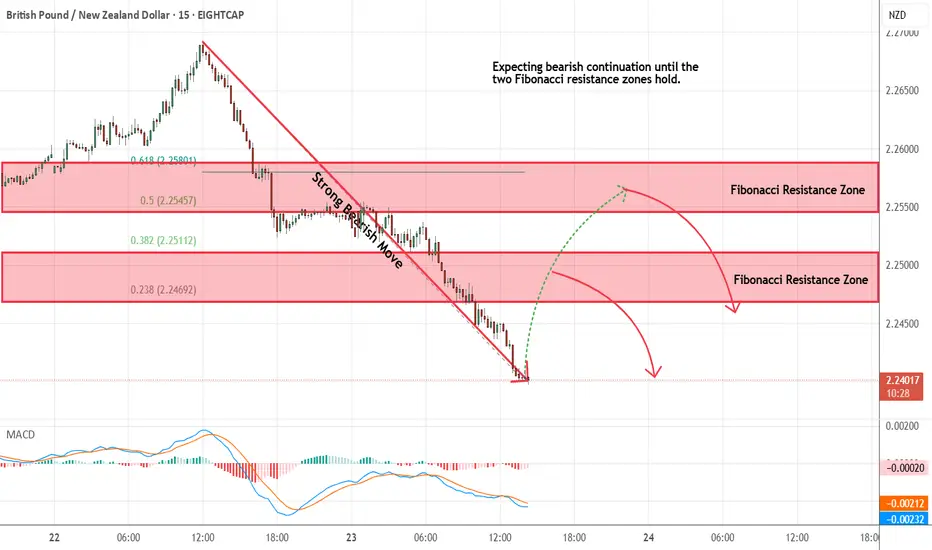
GBPNZD - Looking To Sell Pullbacks In The Short TermM15 - Strong bearish move.
No opposite signs.
Expecting bearish continuation until the two Fibonacci resistance zones hold.
If you enjoy this idea, don’t forget to LIKE 👍, FOLLOW ✅, SHARE 🙌, and COMMENT ✍! Drop your thoughts and charts below to keep the discussion going. Your support helps keep this content free and reach more people! 🚀
-----------------------------------------------------------------------------------------------------
Bitcoin Reinforced Bullish Trend, Range Focus & Key Volumes__________________________________________________________________________________
Technical Overview – Summary Points
➤ Strong bullish momentum across all main timeframes
➤ Key supports: 117600–116500 (short term), 115736/114000 (swing pivot)
➤ Major resistances: 119676, 120998, 123218 (potential short-term distribution risk)
➤ Volumes normal, no climax nor flush
➤ Risk On / Risk Off Indicator: "Strong Buy" bias (all TFs except 30min/15min neutral)
➤ ISPD DIV: No significant divergences
➤ Market consolidating in tight range below immediate resistance
__________________________________________________________________________________
Strategic Summary
➤ Dominant bias: strong bullish on all major TFs
➤ Opportunities: buy on pullback to 117600–116500 support, or on confirmed breakout 119676/120998, targets: 123218–130000
➤ Risk zones: clear break below 115736/114000 or extreme bearish volume
➤ Macro catalyst: No major impact expected short term. Watch Powell/Fed news, possible volatility without trend shift.
➤ Action plan: Prioritize long entries with stops (~2% below support pivot), partial profit taking above 123k, strict risk management in case of behavioral reversal or abnormal volume.
__________________________________________________________________________________
Multi-Timeframe Analysis
Daily/12H/6H/4H/2H/1H :
- All trend signals bullish (Risk On / Risk Off Indicator "Strong Buy", MTFTI "Strong Up")
- All major supports below price
- No structural weakness
- Consolidation range just below 119676–120998 resistance
30min/15min :
- Neutral setup, lack of directional momentum
- Normal volumes, no excessive activity
- Flat consolidation, market awaiting catalyst
Risk On / Risk Off Indicator : Fully confirms momentum. Shifts neutral short-term, no sell or reversal signal.
Key summary :
- Bullish trend dominant
- Major supports well below, immediate risk is low unless flash volume spike or sudden news
- Closely monitor the market under major resistance clusters
__________________________________________________________________________________
Cross-Analysis & Strategic Synthesis
Perfect convergence Daily to 1H: "Strong Up" momentum, bullish Risk On / Risk Off Indicator, healthy volumes
Active consolidation on 30min/15min: market awaits catalyst, no notable bearish strength
Structured pivot supports: 117600–116500, 115736/114000
Key resistances: 119676, 120998, 123218 (potential distribution/resistance zone)
Preferred entries: support pullback or confirmed breakout above 120k
Limited macro risk short term. Focus on Powell/Fed news and US calendar events (see table)
On-chain: Short-term holders profit-taking in progress, alert if deterioration accelerates
Plan: Partial profit taking above 123k extension, systematic stops below 115736 on invalidation
__________________________________________________________________________________
Professional Summary
BTC market shows a strong multi-timeframe bullish impulse, underpinned by robust sector and trend signals. Maintain risk discipline: key supports remain solid, but major resistance cluster requires increased vigilance for volume spikes or air pockets. Partial profit-taking recommended above 123–130k. R/R >2:1 for buys on pullback, strict stop loss in case of technical or behavioral invalidation.
__________________________________________________________________________________

LONG ON GBP/CADGBP/CAD is now at a major key area/demand zone after completing its pullback phase.
I expect price to now rise to the next level of supply or previous high.
looking to catch 200-400 pips throughout the week.

LMT: Lookheed Martin Dropped on Earnings 23-07-2025The dividends now is around 3% which is good for a strong company like Lookheed Martin. But as we are seeing a drop in company profits & Equity, and the stock price is near to a support level, we have to monitor the stock for the next few days or weeks. If all is ok, I will consider buying it.
Disclaimer: This content is NOT a financial advise, it is for educational purpose only.
