GBPUSD Potential UpsidesHey traders, in today's trading session we are monitoring GBPUSD for a buying opportunity around 1.35100 zone, GBPUSD is trading in an uptrend and currently is in a correction phase in which it is approaching the trend at 1.35100 support and resistance area.
Trade safe, Joe.
Support and Resistance

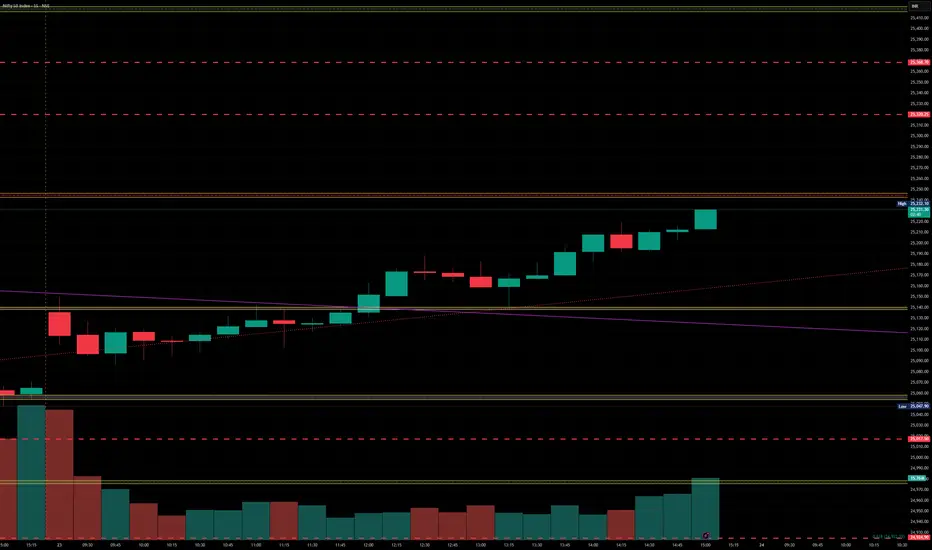
Nifty levels - Jul 24, 2025Nifty support and resistance levels are valuable tools for making informed trading decisions, specifically when combined with the analysis of 5-minute timeframe candlesticks and VWAP. By closely monitoring these levels and observing the price movements within this timeframe, traders can enhance the accuracy of their entry and exit points. It is important to bear in mind that support and resistance levels are not fixed, and they can change over time as market conditions evolve.
The dashed lines on the chart indicate the reaction levels, serving as additional points of significance to consider. Furthermore, take note of the response at the levels of the High, Low, and Close values from the day prior.
We hope you find this information beneficial in your trading endeavors.
* If you found the idea appealing, kindly tap the Boost icon located below the chart. We encourage you to share your thoughts and comments regarding it.
Wishing you success in your trading activities!
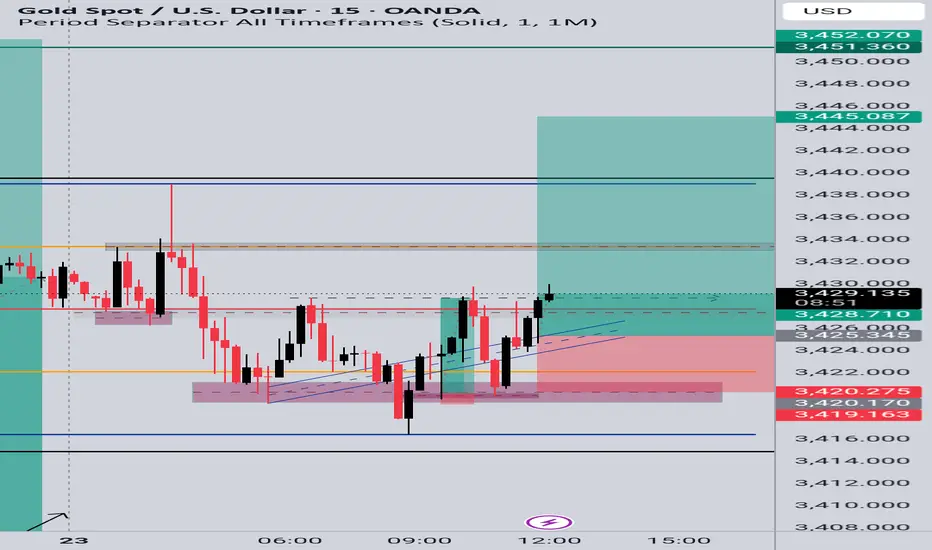
Gold (XAU/USD) Technical Analysis:Gold is currently retesting the $3,440 zone — a key level for the next move.
🔹 Bullish Scenario:
If the price breaks and holds above $3,440, we may see a continuation toward $3,455, where a pullback or bearish correction could occur.
🔹 Bearish Scenario:
If selling pressure increases and the price breaks below $3,420 with confirmation, a move down to retest the $3,385 area is likely.
⚠️ Disclaimer:
This analysis is for educational purposes only and does not constitute financial advice. Always do your own research before making any trading decisions.

SILVER (XAGUSD): Confirmed Break of Structure
Silver updated a year's high yesterday, breaking a strong daily resistance.
With a confirmed Break of Structure BoS, we can expect that
the market will rise even more.
The next strong resistance is 40.
It is a round number based psychological level.
It can be the next goal for the buyers.
❤️Please, support my work with like, thank you!❤️
I am part of Trade Nation's Influencer program and receive a monthly fee for using their TradingView charts in my analysis

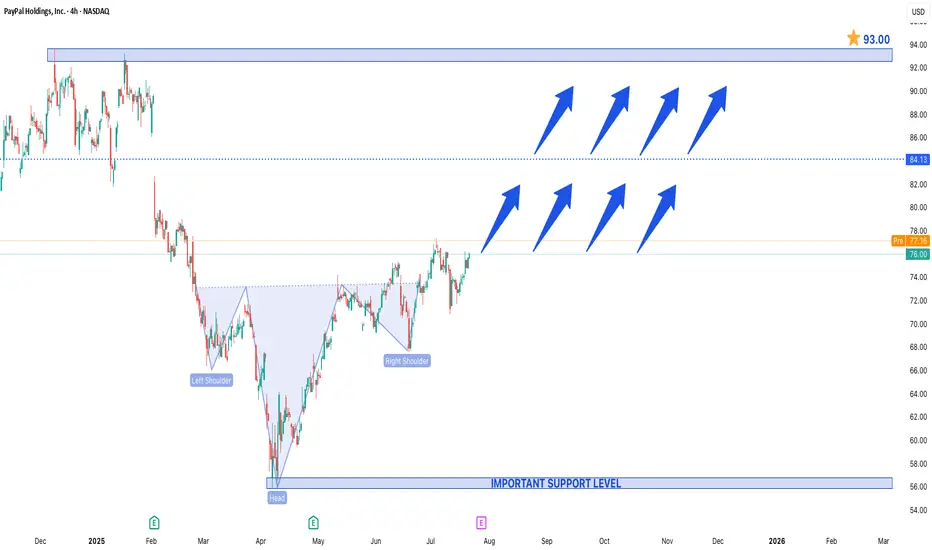
Head & Shoulders Pattern Spotted in PayPal Holdings IncHead & Shoulders Pattern Spotted in PayPal Holdings Inc.
A Head & Shoulders (H&S) pattern has been identified in PayPal Holdings Inc. (PYPL), but unlike the traditional bearish reversal setup, this could be an inverse Head & Shoulders, signaling a potential bullish turnaround.
Key Observations:
1. Left Shoulder – A decline followed by a rebound.
2. Head – A deeper low, then a recovery.
3. Right Shoulder – A higher low, suggesting weakening selling pressure.
4. Neckline Break – A decisive close above the resistance (neckline) confirms the bullish reversal.
Price Projections:
- Support at $55 – This level has held strong, acting as a critical demand zone. A bounce from here could fuel the next rally.
- Upside Target at $93 – A successful breakout above the neckline could propel PYPL toward $93, representing a ~40% upside from current levels.
Why This Matters for Traders:
- Bullish Momentum – The pattern suggests that sellers are exhausted, and buyers are stepping in.
- Volume Confirmation – Increasing volume on the breakout would strengthen the bullish case.
- Market Sentiment Shift – If PayPal sustains above key resistance, it could attract institutional interest.
Trading Strategy:
- Stop Loss – Below $55 for risk management.
- Target – $93, with interim resistance near $75 and $85.
Final Thoughts:
While technical patterns are not foolproof, the inverse H&S in PYPL suggests a potential trend reversal. If the breakout holds, $93 could be the next major target, making PayPal an interesting watch for swing traders and investors.
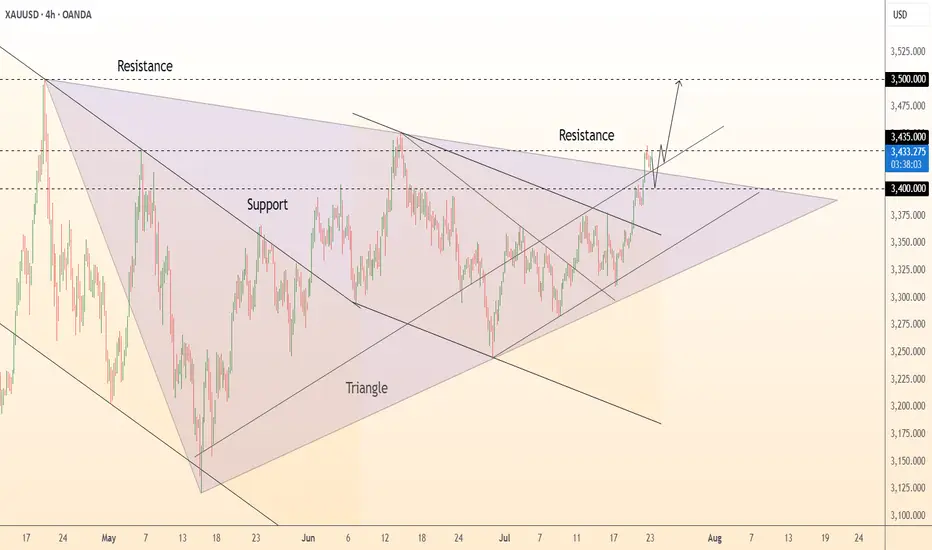
DeGRAM | GOLD exited from the triangle📊 Technical Analysis
● Price has burst above the five-month symmetrical-triangle ceiling at 3 400, converting that line into support; the breakout’s measured move targets the June peak 3 435 and aligns with the rising-channel top near 3 500.
● A tight bull flag is forming on higher-lows inside the new micro up-trend; repeated bids on pull-backs to 3 400-3 405 confirm fresh demand and favour continuation.
💡 Fundamental Analysis
● Gold is buoyed by a softer USD and safe-haven demand as trade frictions grow and Fed guidance turns less certain, keeping XAU/USD firm above $3 400.
✨ Summary
Buy 3 400-3 410; sustained trade over 3 435 eyes 3 500. Bull view void on an H4 close below 3 360.
-------------------
Share your opinion in the comments and support the idea with a like. Thanks for your support!
USDJPY → Hunting for liquidity before the fallFX:USDJPY is changing its local trend and succumbing to global pressure. The market is seeing a change in price movement following the decline in the dollar index...
The trend has broken and the price movement has turned bearish. The fall in the dollar index is allowing the Japanese yen to strengthen, which is generally negative for the currency pair. The decline may continue after a slight correction.
Fundamentally, the dollar is correcting amid uncertainty due to the tariff war, as well as expectations of interest rate cuts.
Resistance levels: 147.20, 147.89
Support levels: 145.85, 145.23
As part of the correction, the price may test the liquidity zone of 147.7 or 0.7f. A false breakout and consolidation of the price in the selling zone may trigger a further decline in both the short and medium term.
Best regards, R. Linda!

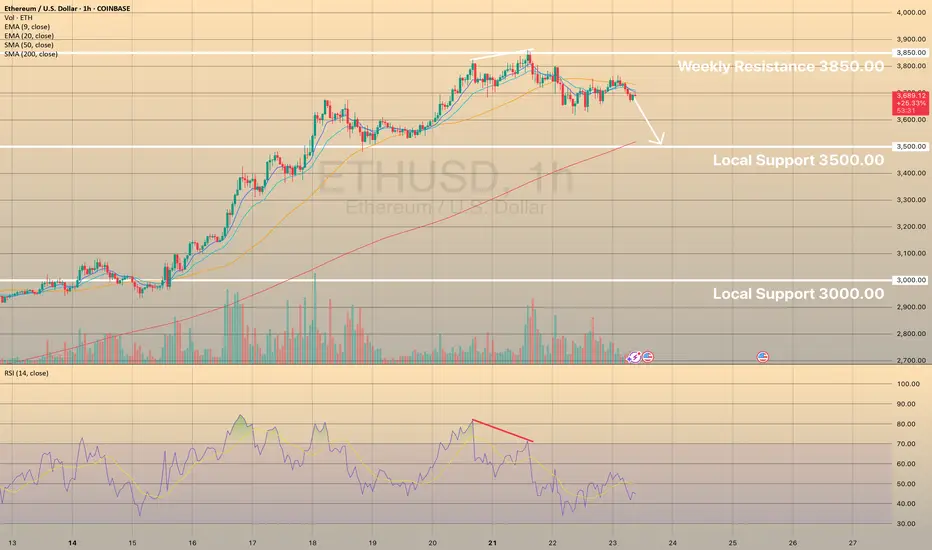
ETHUSD SEEMS TO RETEST SUPPORT LEVEL OF 3,500.00ETHUSD SEEMS TO RETEST SUPPORT LEVEL OF 3,500.00
The ETHUSD has hit some resistance at around 3,850.00 this week. But it's since pulled back from that level, which might be a sign of a cooling trend. That's backed up by the RSI going bearish.
Right now, the price is below the 50 SMA on the 1-hour chart, indicating a mid-term downtrend.
We could see the price find some support at 3500.00 or so. Additionally the SMA 200 lays nearby, providing extra support here.
XAUUSD BULLISH CONTINUATION GOLD BUY ENTRY
🔹 Entry: 3425.40
🎯 Targets:
— TP1: 3438
— TP2: 3445
🔸 Expecting bullish continuation after recent structure break and momentum shift.
Gold to $3720Gold has been trading within an ascending triangle since late April, staying above the support line and the 50-day EMA. This is the fourth time Gold is testing the resistance line at $3440, and it will likely break soon. The breakout FOMO should push Gold to around $3720, IMO.

SHIBUSDT OLD enough to break the resistance and pump soon While the spots are waking up it seems here we have kind of sleep and dead coin named BINANCE:SHIBUSDT but this turtle🐢 usually pump later than any one else in market and kill the emotions of some holders.
So be patient + wait for breakout of red trendline = Heavy pump and profit coming.
DISCLAIMER: ((trade based on your own decision))
<<press like👍 if you enjoy💚

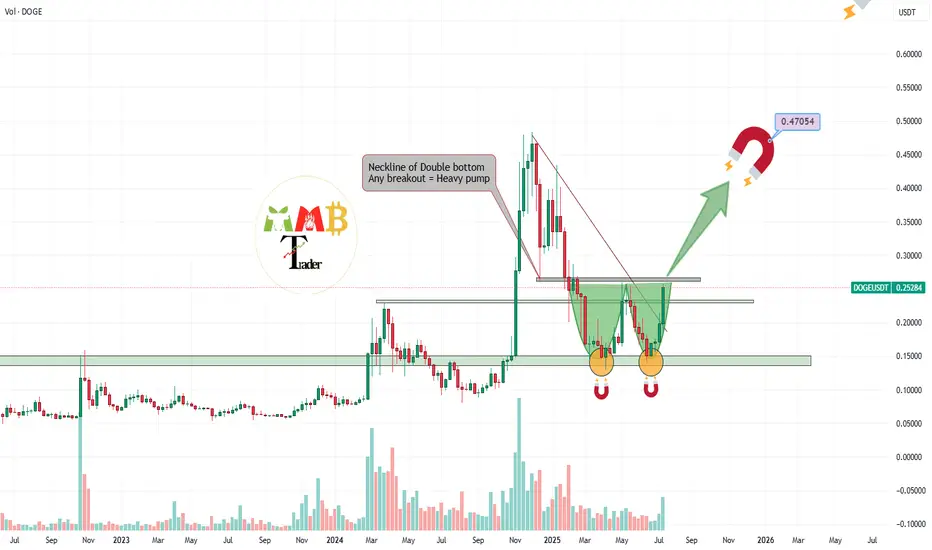
DOGEUSDT double bottom pattern or my Magnet pattern???So many of Traders around the world sees weekly Strong reversal pattern which is double Bottom and they are waiting for breakout of neckline which is last major resistance of 0.26$ and i think soon it can break the resistance and heavy pump ahead after breakout is expected.
But you may be wrong the upcoming pump here is due to my magnets on chart.
find them all and see how it pump price.
Who finds all targets for BINANCE:DOGEUSDT ?
But remember and never forget this was not
DISCLAIMER: ((trade based on your own decision))
<<press like👍 if you enjoy💚
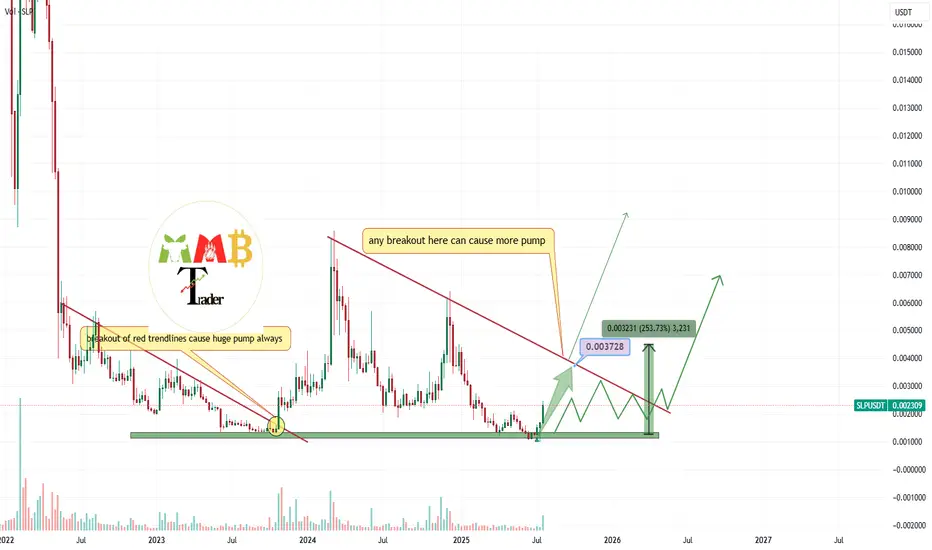
SLPUSDT do not miss that +200% which is cookingWe mentioned before, near green support zone price is currently around major weekly supports and at least +150% pump to red trendline is ahead and after a valid breakout there even more rise and gain is ahead for BINANCE:SLPUSDT holders after a long sleep.
DISCLAIMER: ((trade based on your own decision))
<<press like👍 if you enjoy💚
3400 has been reached, wait patiently for a pullback to go longGold opened on Monday with a volatile rise. After breaking through the 3360-65 area, the bulls turned strong. After breaking through the 3375~80 area in the evening, the bulls accelerated their rise, reaching the highest point of 3402. It fluctuated sideways in the late trading, and the daily line closed at around 3397 with a big positive line! Gold temporarily broke the small range oscillation pattern, but the bulls were not strong, and it still fluctuated upward.
From the perspective of the intraday cycle, after yesterday's rapid rise, the market fell into a serious overbought state; however, yesterday's $60 big positive line supported the bulls, and it is expected that the market will fluctuate; the next focus is still the 3400 mark area. The pressure in the 3400~05 area was dense last night, and adjustments may be made at any time before the breakthrough; and since the rise of 3282, it has just touched the upper edge of the parallel channel. The big sweep will continue, but the range is constantly changing!
So although gold broke the recent volatility yesterday and hit the 3400 mark with a big positive line; however, if it cannot stand above it, then it will continue to fall; recently we have repeatedly and many times emphasized the importance of the 3400 mark. If it stands here, the market will gradually rise to 3420~25 and break through to the 3450 area before looking for a decline.
Today we will continue to focus on the 3400 mark area. First, we will rush to the high altitude, with the goal of retracement to the 3375 and 3356 regional support platforms, and then pay attention to long opportunities; if the bulls stand above the 3400 mark, they will further bullishly impact 3420~25 and break through the 3450 area before falling back.
OANDA:XAUUSD
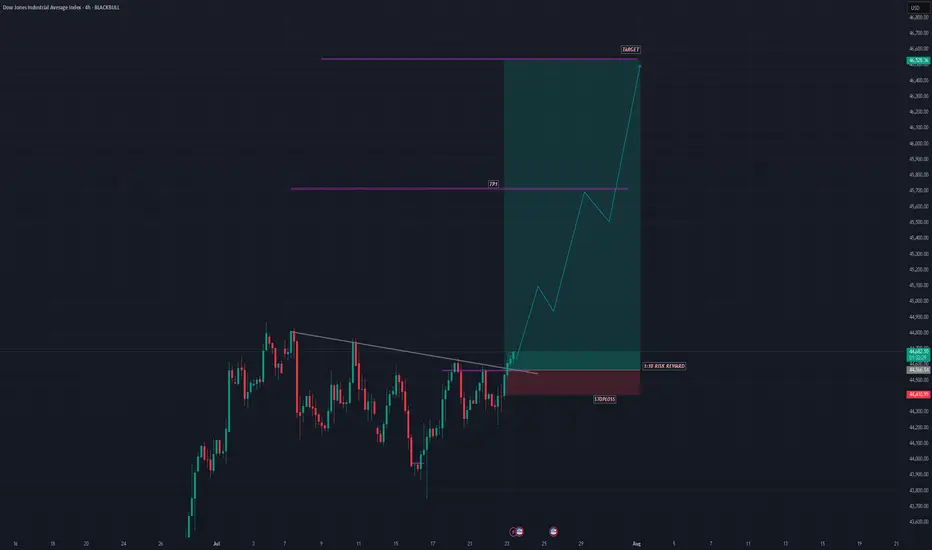
US30 SHOWING A GOOD UPWARD MOVE WITH 1:10 RISK REWARDUS30 SHOWING A GOOD UPWARD MOVE WITH 1:10 RISK REWARD
DUE TO THESE REASON
A. its following a rectangle pattern that stocked the market
which preventing the market to move any one direction now it trying to break the strong resistant lable
B. after the break of this rectangle it will boost the market potential for break
C. also its resisting from a strong neckline the neckline also got weeker ald the price is ready to break in the outer region
all of these reason are indicating the same thing its ready for breakout BREAKOUT trading are follows good risk reward
please dont use more than one percentage of your capital follow risk reward and tradeing rules
that will help you to to become a better trader
thank you
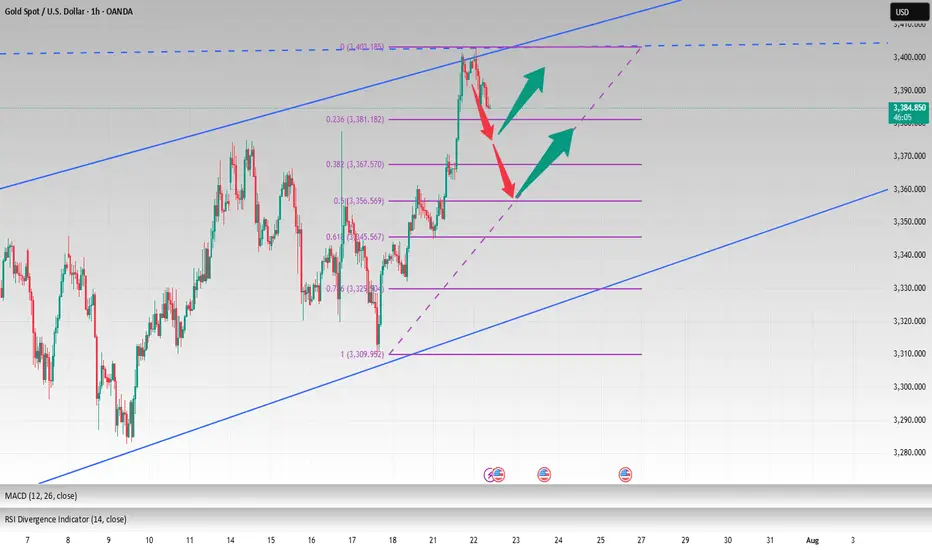
DeGRAM | GOLD above the resistance📊 Technical Analysis
● Five successive rebounds (green arrows) from the 4-month rising‐channel base at 3 293 keep the primary up-trend intact while turning the former wedge roof into support.
● Price is compressing inside a 4-day ascending triangle whose ceiling sits at 3 366; a break projects 1 : 1 to the March top/outer channel rail at 3 435.
💡 Fundamental Analysis
● FXStreet notes bullion ETF holdings rose for a second week as softer US PMI prices dragged 2-yr real yields back to early-July lows, trimming the dollar bid.
✨ Summary
Buy 3 345-3 355; triangle breakout >3 366 opens 3 389 then 3 435. Long bias void on an H4 close below 3 293.
-------------------
Share your opinion in the comments and support the idea with a like. Thanks for your support!

DeGRAM | EURUSD in the consolidation zone📊 Technical Analysis
● Price broke the month-long bearish channel and is now basing inside the 1.165-1.169 consolidation block; repeated intraday retests (blue zone) turn the former cap into fresh support.
● A steep hourly up-sloper is carving successive higher-lows; its width and the prior channel depth project follow-through toward 1.1745 (mid-July pivot) with room to the next swing line at 1.1800.
💡 Fundamental Analysis
● FXStreet highlights softer US PMIs and a pull-back in 2-yr yields, while ECB sources flag “data-dependent patience” rather than imminent cuts—narrowing the short-rate gap and favouring the euro.
✨ Summary
Long 1.1650-1.1680; hold above the blue base targets 1.1745 ➜ 1.1800. Long view void on an H1 close below 1.1615.
-------------------
Share your opinion in the comments and support the idea with a like. Thanks for your support!

GOLD SHORT REVERSALThe GOLD is on a short-term reversal, but it is expected to resume a new uptrend.
KO: Coca-Cola (CFD) Earnings 23-07-2025Yesterday we have the Coca-Cola earnings report came out and beat on both earning and revenue. But due to the technical position I do not see it a good entry on the stock CFD, still see PepsiCo stock CFD is a better option.
Disclaimer: This content is NOT a financial advise, it is for educational purpose only.

GBPUSD 4H FRAMEWORK.The British pound starts a new trend to the upside after a long fall against the US dollar, but hopes are still short, as this may be a short-lived move for the pound.
Trade Responsibly.

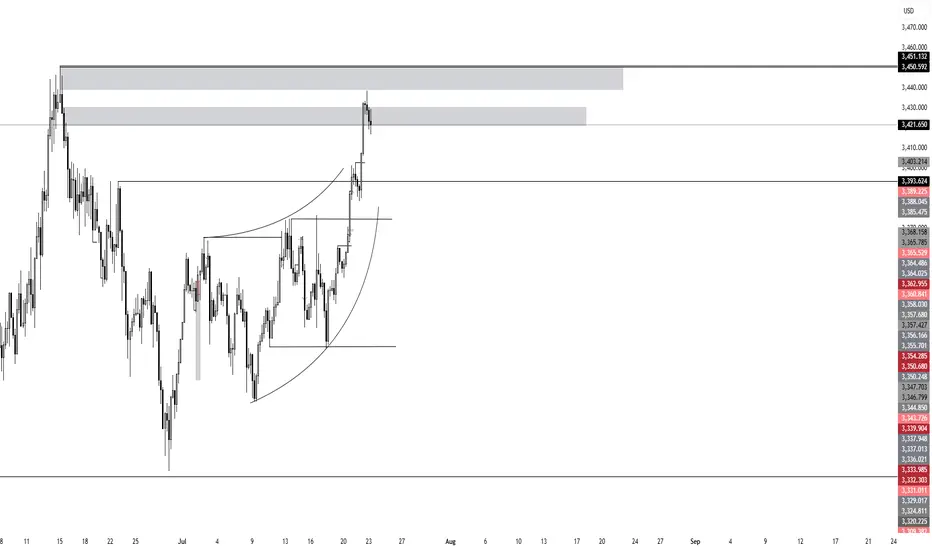
XAUUSD SEEMS TO ESTABLISH NEW BULLISH IMPULSEXAUUSD SEEMS TO ESTABLISH NEW BULLISH IMPULSE
The recovery of the gold market appears to have gained momentum in recent days. This has resulted in the precious metal surpassing what appears to be a triangular pattern.
What is a triangle pattern?
A triangle pattern is a chart pattern with converging trendlines, signaling consolidation before a breakout. Types: Ascending (bullish, flat top, rising bottom), Descending (bearish, flat bottom, declining top), Symmetrical (neutral, both trendlines converge). To trade: Identify the pattern (two touches per trendline), wait for a breakout with volume, enter after confirmation, set stop loss below (long) or above (short) breakout, and target the triangle’s height projected from the breakout.
From here, a break above the June high of 3,450.00 would increase the probability of a further rise toward the record high near 3,500.00. But before that slight decline towards upper border of the symmetrical triangle with further rebound is expected.

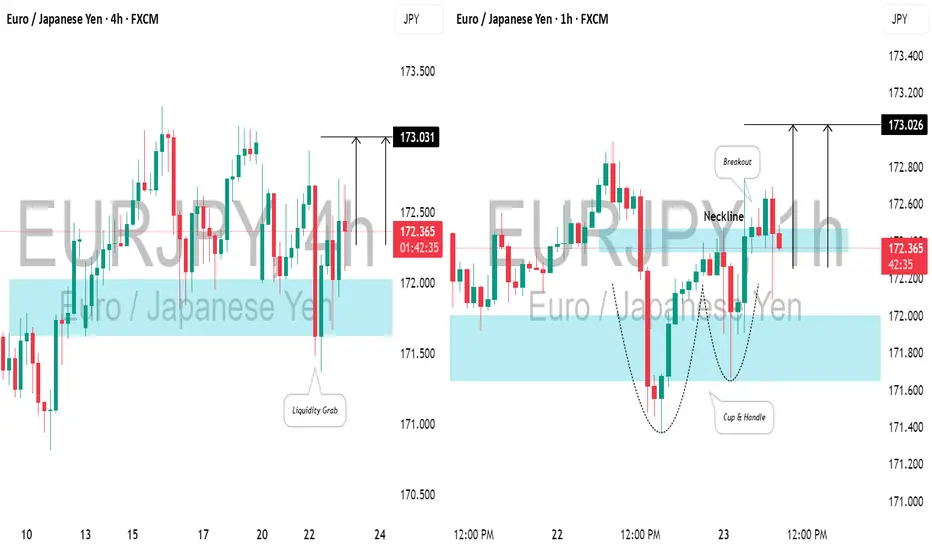
EURJPY: Bullish Move After Liquidity Grab📈EURJPY created a bearish high-range candle beneath a crucial support level in a horizontal trading range on the 4-hour chart.
However, a subsequent recovery and a bullish opening in the Asian session indicate a strong likelihood of an upward movement today, targeting 173.00.
CHFJPY Looks Toppy… Is a 500 Pip Crash Coming?CHFJPY Has Exploded Past 180 — But Is the Top Already In?
After blowing clean through the key 180 resistance level, CHFJPY has continued surging into July — a month historically known for thin liquidity as traders hit holiday mode. These low-volume environments often lead to exaggerated price moves, much like we see in late December.
From a structural standpoint, this pair looks seriously overextended and ripe for a sharp pullback — with potential downside targets around 180 and 178 over the coming weeks.
If I were a bull, I’d want to see a clear break and weekly/monthly close above 186 before considering further upside.
As it stands, I’m gradually building into a short position, eyeing that 180 handle as my first key level.
Let me know your thoughts in the comments — agree, disagree, or seeing something I’m not?
*This is my personal analysis shared for educational purposes only. Always do your own research — never blindly follow anyone’s trades.*
