BTC 108K - 112K ZONE Why 108k to 112k zone is important?
Bitcoin recently made a new all-time high and is now undergoing a healthy correction — nothing to worry about.
The $108,000 to $112,000 zone is a key support area due to three major factors:
1. Strong previous support level
2. A daily trendline aligning with this zone
3. 50% Fibonacci retracement of the recent impulse move
If this support holds, there's a strong possibility Bitcoin will form a new ATH around $130,000 to $140,000.
DON'T PANIC wait for confirmation and see the magic 🚀 🚀
Support and Resistance

CAD_JPY BEARISH BREKAOUT|SHORT|
✅CAD_JPY broke the key structure level of 107.400
While trading in an local downtrend
Which makes me bearish
And I think that after the retest of the broken level is complete
A rebound and bearish continuation will follow
SHORT🔥
✅Like and subscribe to never miss a new idea!✅
Disclosure: I am part of Trade Nation's Influencer program and receive a monthly fee for using their TradingView charts in my analysis.

Learning#03 : VWAP in Intraday TradingLearning#03 : VWAP in Intraday Trading
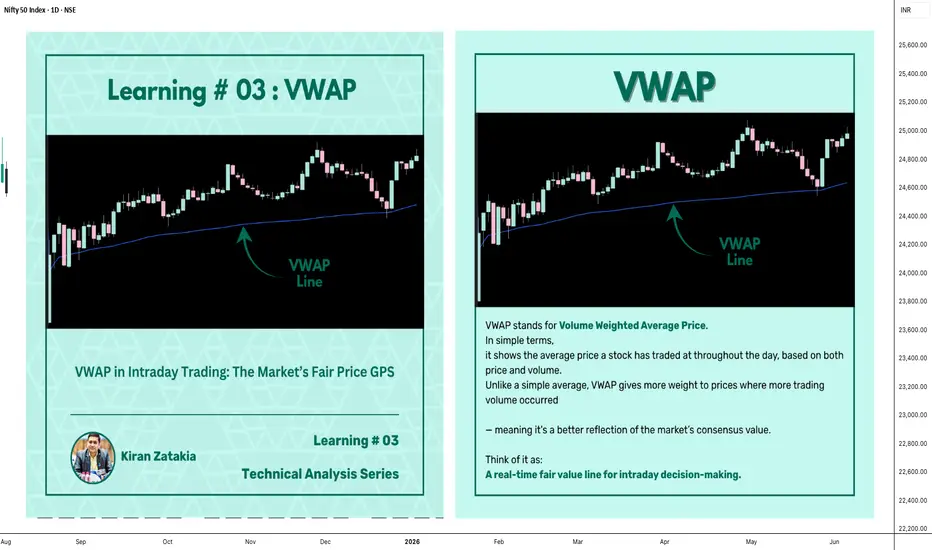
📊 VWAP in Intraday Trading: The Market’s Fair Price GPS
Ever wondered if there’s a level that shows where the real trading action is happening? That’s exactly what VWAP does — it’s like a volume-weighted compass that intraday traders use to orient themselves in the market.
It’s not just another line on your chart. VWAP reflects where institutions and volume-heavy participants are active. That’s why understanding how price interacts with it can give you a serious edge.
Let’s break it down 👇
🧠 What is VWAP?
VWAP stands for Volume Weighted Average Price.
In simple terms, it shows the average price a stock has traded at throughout the day, based on both price and volume.
Unlike a simple average, VWAP gives more weight to prices where more trading volume occurred — meaning it's a better reflection of the market’s consensus value.
Think of it as:
A real-time fair value line for intraday decision-making.
📈 Why VWAP Matters for Intraday Traders
VWAP acts as an intraday anchor. It tells you whether the price is currently trading above or below the day’s volume-weighted average — giving you quick insight into who's in control.
Here’s how to interpret it:
When price is above VWAP, buyers are in control and the bias is bullish.
When price is below VWAP, sellers are dominating and the bias is bearish.
When price is hovering near VWAP, the market is undecided, consolidating, or lacking direction.
In short, VWAP tells you who’s winning the intraday tug of war — and whether it’s even worth stepping in.
⚙️ How to Use VWAP in Your Intraday Strategy
1️⃣ VWAP as a Trend Filter
Before entering a trade, check where price is relative to VWAP:
Price above VWAP with higher lows → Focus on long setups
Price below VWAP with lower highs → Focus on short setups
🔁 Skip counter-trend trades. Stay with the flow.
This helps in trending markets by keeping you aligned with momentum.
2️⃣ VWAP as Dynamic Support or Resistance
VWAP behaves like a magnet. Price often pulls back to it and either:
Rejects (respects the level as support/resistance), or
Breaks and reclaims (signaling a potential reversal)
Use it alongside:
Flag patterns
Inside bars
Break-and-retest structures
3️⃣ VWAP Reversion Play (Snapback Trade)
This is a mean-reversion setup:
Price moves quickly away from VWAP at open
No strong follow-through, signs of exhaustion
Take a counter-trend trade back to VWAP
⚠️ Avoid this in strong trending markets — best used in choppy or fading environments.
4️⃣ VWAP with Price Action for Structure
Pair VWAP with clean price action:
Mark support and resistance zones
Observe price behavior near VWAP
Look for confirmation: inside bars, rejection wicks, engulfing candles
🎯 This adds logic and clarity to your entries — no random trades.
🔍 Bonus VWAP Tips
Combine VWAP with:
CPR (Central Pivot Range) for confluence zones
Opening range for breakout bias
Volume profile to spot high interest areas
These combos create strong, repeatable trade setups.
✅ VWAP Recap: Why It Matters
Here’s a quick breakdown of how VWAP can sharpen your intraday trading game:
Bias Building: VWAP helps confirm whether the market structure is bullish or bearish, giving you a reliable directional bias.
Trend Filtering: It keeps you aligned with the current momentum by filtering out counter-trend trades.
Pullback Entries: VWAP acts as a dynamic support or resistance level, offering clean zones to enter trades during pullbacks.
Mean Reversion: In sideways or fading markets, VWAP becomes a natural magnet — allowing you to target price reversions.
Risk Management: It provides logical reference points for placing stop-losses and defining entry zones, adding clarity to your risk-reward planning.
✍️ Final Thoughts
VWAP may sound simple, but it brings real structure to intraday trading.
It tells you where volume met price, and that’s powerful. When used with price action, it creates a solid framework for:
Building directional bias
Finding clean entries
Managing risk like a pro
VWAP doesn’t predict — it reflects. And in trading, reflection is more useful than prediction.
🛎️ Respect VWAP. Trade with structure.
— Kiran Zatakia
Bullish potential detected for TLCEntry conditions:
(i) higher share price for ASX:TLC along with swing up of the DMI indicators and swing up of the RSI indicator, and
(ii) observation of market reaction at the support/resistance level at $5.31 (from the open of 12th May).
Stop loss for the trade would be, dependent of risk tolerance (once the trade is activated):
(i) below the support level from the open of 21st November (i.e.: below $5.05), or
(ii) below the recent swing low of 3rd June (i.e.: below $4.96).

Potential outside week and bullish potential for CXOEntry conditions:
(i) higher share price for ASX:CXO above the level of the potential outside week noted on 27th June (i.e.: above the level of $0.1025).
Stop loss for the trade would be:
(i) below the low of the outside week on 20th June (i.e.: below $0.083), should the trade activate.

Jazz Pharma Stock Chart Fibonacci Analysis 080125Trading Idea
1) Find a FIBO slingshot
2) Check FIBO 61.80% level
3) Entry Point > 112/61.80%
Chart time frame:B
A) 15 min(1W-3M)
B) 1 hr(3M-6M)
C) 4 hr(6M-1year)
D) 1 day(1-3years)
Stock progress:C
A) Keep rising over 61.80% resistance
B) 61.80% resistance
C) 61.80% support
D) Hit the bottom
E) Hit the top
Stocks rise as they rise from support and fall from resistance. Our goal is to find a low support point and enter. It can be referred to as buying at the pullback point. The pullback point can be found with a Fibonacci extension of 61.80%. This is a step to find entry level. 1) Find a triangle (Fibonacci Speed Fan Line) that connects the high (resistance) and low (support) points of the stock in progress, where it is continuously expressed as a Slingshot, 2) and create a Fibonacci extension level for the first rising wave from the start point of slingshot pattern.
When the current price goes over 61.80% level , that can be a good entry point, especially if the SMA 100 and 200 curves are gathered together at 61.80%, it is a very good entry point.
As a great help, tradingview provides these Fibonacci speed fan lines and extension levels with ease. So if you use the Fibonacci fan line, the extension level, and the SMA 100/200 curve well, you can find an entry point for the stock market. At least you have to enter at this low point to avoid trading failure, and if you are skilled at entering this low point, with fibonacci6180 technique, your reading skill to chart will be greatly improved.
If you want to do day trading, please set the time frame to 5 minutes or 15 minutes, and you will see many of the low point of rising stocks.
If want to prefer long term range trading, you can set the time frame to 1 hr or 1 day.

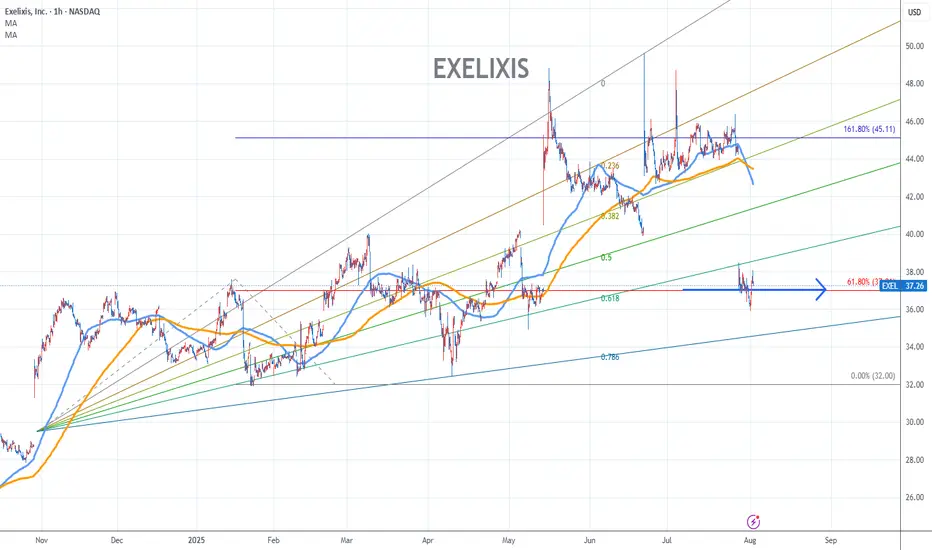
Exelixis Stock Chart Fibonacci Analysis 080125Exelixis Stock Chart Fibonacci Analysis 080125
Trading idea - Entry point > 37/61.80%
Trading Idea
1) Find a FIBO slingshot
2) Check FIBO 61.80% level
3) Entry Point > 37/61.80%
Chart time frame:B
A) 15 min(1W-3M)
B) 1 hr(3M-6M)
C) 4 hr(6M-1year)
D) 1 day(1-3years)
Stock progress:A
A) Keep rising over 61.80% resistance
B) 61.80% resistance
C) 61.80% support
D) Hit the bottom
E) Hit the top
Stocks rise as they rise from support and fall from resistance. Our goal is to find a low support point and enter. It can be referred to as buying at the pullback point. The pullback point can be found with a Fibonacci extension of 61.80%. This is a step to find entry level. 1) Find a triangle (Fibonacci Speed Fan Line) that connects the high (resistance) and low (support) points of the stock in progress, where it is continuously expressed as a Slingshot, 2) and create a Fibonacci extension level for the first rising wave from the start point of slingshot pattern.
When the current price goes over 61.80% level , that can be a good entry point, especially if the SMA 100 and 200 curves are gathered together at 61.80%, it is a very good entry point.
As a great help, tradingview provides these Fibonacci speed fan lines and extension levels with ease. So if you use the Fibonacci fan line, the extension level, and the SMA 100/200 curve well, you can find an entry point for the stock market. At least you have to enter at this low point to avoid trading failure, and if you are skilled at entering this low point, with fibonacci6180 technique, your reading skill to chart will be greatly improved.
If you want to do day trading, please set the time frame to 5 minutes or 15 minutes, and you will see many of the low point of rising stocks.
If want to prefer long term range trading, you can set the time frame to 1 hr or 1 day.
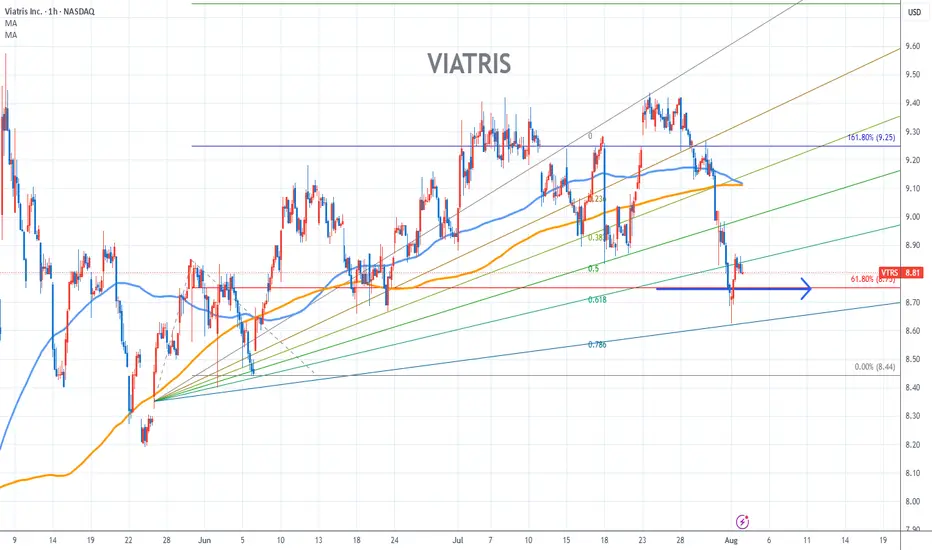
Viatris Stock Chart Fibonacci Analysis 080125Trading Idea
1) Find a FIBO slingshot
2) Check FIBO 61.80% level
3) Entry Point > 8.8/61.80%
Chart time frame:B
A) 15 min(1W-3M)
B) 1 hr(3M-6M)
C) 4 hr(6M-1year)
D) 1 day(1-3years)
Stock progress:A
A) Keep rising over 61.80% resistance
B) 61.80% resistance
C) 61.80% support
D) Hit the bottom
E) Hit the top
Stocks rise as they rise from support and fall from resistance. Our goal is to find a low support point and enter. It can be referred to as buying at the pullback point. The pullback point can be found with a Fibonacci extension of 61.80%. This is a step to find entry level. 1) Find a triangle (Fibonacci Speed Fan Line) that connects the high (resistance) and low (support) points of the stock in progress, where it is continuously expressed as a Slingshot, 2) and create a Fibonacci extension level for the first rising wave from the start point of slingshot pattern.
When the current price goes over 61.80% level , that can be a good entry point, especially if the SMA 100 and 200 curves are gathered together at 61.80%, it is a very good entry point.
As a great help, tradingview provides these Fibonacci speed fan lines and extension levels with ease. So if you use the Fibonacci fan line, the extension level, and the SMA 100/200 curve well, you can find an entry point for the stock market. At least you have to enter at this low point to avoid trading failure, and if you are skilled at entering this low point, with fibonacci6180 technique, your reading skill to chart will be greatly improved.
If you want to do day trading, please set the time frame to 5 minutes or 15 minutes, and you will see many of the low point of rising stocks.
If want to prefer long term range trading, you can set the time frame to 1 hr or 1 day.
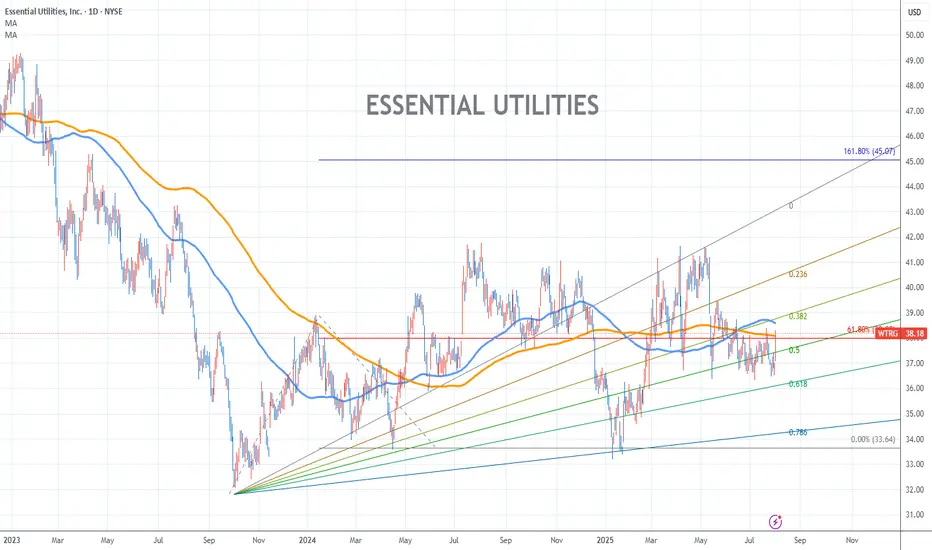
Essential Utilities Stock Chart Fibonacci Analysis 080125Trading Idea
1) Find a FIBO slingshot
2) Check FIBO 61.80% level
3) Entry Point > 38/61.80%
Chart time frame:D
A) 15 min(1W-3M)
B) 1 hr(3M-6M)
C) 4 hr(6M-1year)
D) 1 day(1-3years)
Stock progress:A
A) Keep rising over 61.80% resistance
B) 61.80% resistance
C) 61.80% support
D) Hit the bottom
E) Hit the top
Stocks rise as they rise from support and fall from resistance. Our goal is to find a low support point and enter. It can be referred to as buying at the pullback point. The pullback point can be found with a Fibonacci extension of 61.80%. This is a step to find entry level. 1) Find a triangle (Fibonacci Speed Fan Line) that connects the high (resistance) and low (support) points of the stock in progress, where it is continuously expressed as a Slingshot, 2) and create a Fibonacci extension level for the first rising wave from the start point of slingshot pattern.
When the current price goes over 61.80% level , that can be a good entry point, especially if the SMA 100 and 200 curves are gathered together at 61.80%, it is a very good entry point.
As a great help, tradingview provides these Fibonacci speed fan lines and extension levels with ease. So if you use the Fibonacci fan line, the extension level, and the SMA 100/200 curve well, you can find an entry point for the stock market. At least you have to enter at this low point to avoid trading failure, and if you are skilled at entering this low point, with fibonacci6180 technique, your reading skill to chart will be greatly improved.
If you want to do day trading, please set the time frame to 5 minutes or 15 minutes, and you will see many of the low point of rising stocks.
If want to prefer long term range trading, you can set the time frame to 1 hr or 1 day.
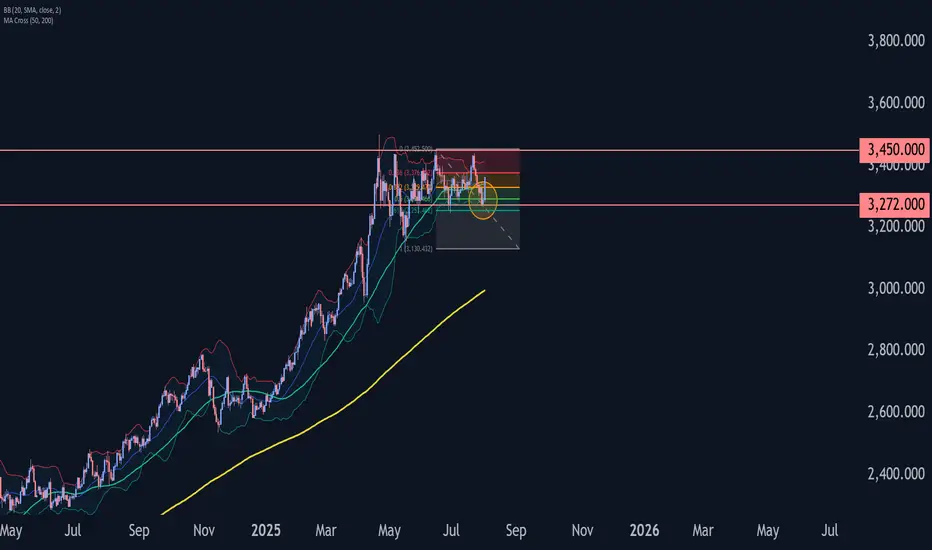
Gold Wave Analysis – 1 August 2025
- Gold reversed from the support zone
- Likely to rise to the resistance level at 3450.00
Gold today reversed from the support zone between the support level 3272.00 (which has been reversing the price from the end of May), lower daily Bollinger Band and the 50% Fibonacci correction of the upward wave B from May.
The upward reversal from this support zone created the daily Japanese candlesticks reversal pattern, Morning Star.
Given the clear daily uptrend and the oversold daily Stochastic, Gold can be expected to rise to the next resistance level at 3450.00 (top of waves B and ii).
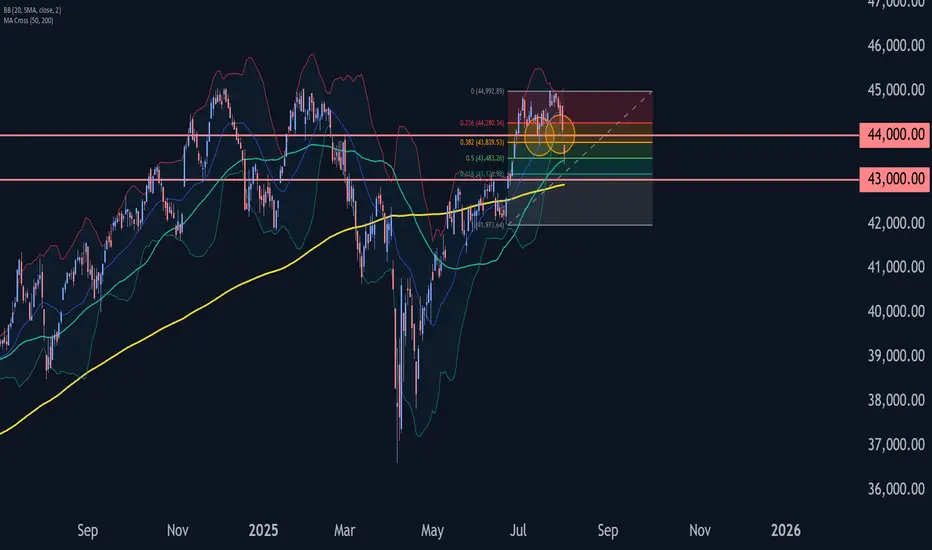
Dow Jones Wave Analysis – 1 August 2025
- Dow Jones broke the support zone
- Likely to fall to support level 43000.00
The Dow Jones index broke the support zone between the support level 44000.00 and the 38.2% Fibonacci correction of the upward impulse from June.
The breakout of this support zone accelerated the active short-term correction iv.
Dow Jones index can be expected to fall to the next support level at 43000.00 (target for the completion of the active correction iv and the former resistance from May and June).
GBP-AUD Growth Ahead! Buy!
Hello,Traders!
GBP-AUD made a retest
Of the horizontal support
Of 2.0420 and we are
Already seeing a bullish
Rebound so we will be
Expecting a further
Bullish move up
Buy!
Comment and subscribe to help us grow!
Check out other forecasts below too!
Disclosure: I am part of Trade Nation's Influencer program and receive a monthly fee for using their TradingView charts in my analysis.

CHF_JPY RISKY LONG|
✅CHF_JPY has retested a key support level of 182.800
And as the pair is already making a bullish rebound
A move up to retest the supply level above at 183.700 is likely
LONG🚀
✅Like and subscribe to never miss a new idea!✅
Disclosure: I am part of Trade Nation's Influencer program and receive a monthly fee for using their TradingView charts in my analysis.

XAUUSDso Gold (XAU/USD) broke support, retested it as resistance, and is holding below. That’s a classic bearish continuation setup.
Structure: Market forming lower highs and lower lows, confirming bearish trend.
Bias: Strongly bearish while price trades under the broken support zone.

Put a lid on what smells badWe are within a resistance range that is as old as 5 years. It has been confirmed impressively in February 2024 again. Perhaps we will test these high again within the next weeks. But I oubt that we may decisive exceed the 230-240 level as this resistance is very strong and even stronger due to the 2024 Fibonacci extension.
The top on Wednesday could no be overcome. This means to me that we are in a decisive zone now with a possible correction attempt towards the open window of mid May.
Another upward attempt may be followed then.

Reddit breaks out for bullish run I have been watching Reddit for a couple of weeks and identified that we had put in the .786 low from the correction since February and then formed a range that was well respected for the past 4 months .
In this video I highlight zones where i expect price to gravitate too and where a nice entry will be if you are looking to long reddit.
Tools used Fib suite , trend based fib , tr pocket , 0.786 + 0.382 and fixed range .

Nifty Analysis EOD – August 2, 2025 – Friday🟢 Nifty Analysis EOD – August 2, 2025 – Friday 🔴
Trapped at the Top, Slammed at the Close – Bulls Burnt Out!
🗓️ Nifty Summary
With the continuation of yesterday's hidden weakness, today's session gave early hope but ended with a bearish surprise. Nifty opened near the key support zone of 24,735 ~ 24,725, hovered indecisively, then suddenly rallied to 24,780, trapping bulls just under resistance.
But the trap was set.
A sharp reversal followed as Nifty broke not just the day’s low, but also the previous day’s support zone of 24,660 ~ 24,675, pulling the index lower into the 24,565.35 close — the second lowest close since May 12.
A fierce 2–3 hour tug-of-war between bulls and bears took place in a tight 40–50 point range until 2:50 PM, when bulls gave up—leading to a 100+ point fall in the last half-hour. shocked many traders, especially those fatigued from the earlier choppy action.
Much like yesterday, both sides of the trade were available today.
Did you catch them?
Zoom Out View :
Today’s close is just 23 points above the June 3 close, wiping out nearly 59 sessions (81 days) of gain.
Will the zone of 24460 ~ 24542 provide support again, or are we headed for a retest of the 24000 ~ 23800 and 23200 ~ 22800 (Pattern Target and Virgin) range?
Yes, you read correctly 23200 ~ 22800…!
Not so soon…but eventually…!
wish you tell me crazy and hope I am wrong…!
📈 5 Min Time Frame Chart with Intraday Levels
📉 Daily Time Frame Chart with Intraday Levels
🕯️ Daily Candle Breakdown
Open: 24,734.90
High: 24,784.15
Low: 24,535.05
Close: 24,565.35
Change: −203.00 (−0.82%)
Candle Structure
🔴 Large bearish body (169.55 pts)
☁️ Moderate upper wick (49.25 pts)
⬇️ Short lower wick (30.30 pts)
Interpretation
Opened lower, climbed early but failed at 24,780+.
Selling dominated the rest of the session, closing near lows.
Moderate upper wick shows early bullish attempt was rejected.
Candle Type
Bearish Marubozu-like – clear seller dominance.
Key Insight
Sellers defended 24,780–24,800 zone.
Closing near 24,560 keeps the short-term bias bearish.
Next support: 24,500, 24,470 ~ 24460
⚠️ Bulls must reclaim 24,735+ on closing basis to neutralize sentiment.
🛡 5 Min Intraday Chart
⚔️ Gladiator Strategy Update
ATR: 212.37
IB Range: 87.55 → Medium
Market Structure: Balanced
Trades Triggered
🕙 10:05 AM – Long Entry → 🎯 Target Hit (R:R – 1:1)
🕚 11:09 AM – Short Entry → 🎯 Target Hit (R:R – 1:2)
🔍 Trade Summary
Both sides were offered—clean hit on long and solid breakdown on short. A Gladiator’s delight.
📊 Support & Resistance Levels
🔼 Resistance Zones
24620
24660 ~ 24675
24725 ~ 24735
24780 ~ 24795
24860 ~ 24880
🔽 Support Zones
24,542 ~ 24,535
24,500
24,470 ~ 24,460
24,380
💬 Final Thoughts
"Traps are laid where confidence is highest. Stay alert, stay flexible."
A textbook day where patience paid off — those who didn’t force trades were rewarded with clean moves in both directions.
✏️ Disclaimer
This is just my personal viewpoint. Always consult your financial advisor before taking any action.

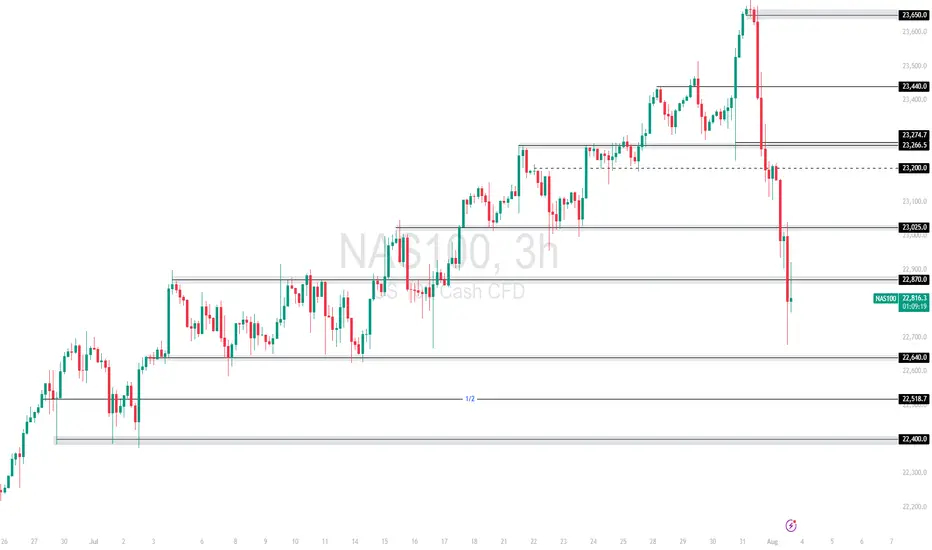
NAS100 – Sharp Breakdown After Tariffs & Jobs Data MissAfter a macro-driven selloff, NAS100 broke decisively below 23,025.0, taking out prior structure and confirming bearish pressure. The drop followed two key catalysts:
📉 Jobs Report Miss: Only 73K jobs added in July vs 200K+ expected — signals a slowing economy.
📛 Tariff Shock: President Trump imposed new tariffs on 90+ countries, up to 41%, rattling global sentiment.
Support at: 22,870.0 🔽 & 22,640.0
Resistance at: 23,025.0 🔼 & 23,200.0
🔎 Bias:
🔼 Bullish: Sustained strength above 22,870 with momentum could aim for 23,025 retest.
🔽 Bearish: Rejection below 23,025 or break under 22,870 opens space to 22,640 and possibly 22,518.
🎯 Let the dust settle – market could still be digesting the shock.
📛 Disclaimer: Not financial advice. Trade responsibly.
BTC/USD Ready to Explode?Watch 116,990 & 120,160 Breakout Zones!Massive move loading on BTC!
Price is trapped in a tight consolidation zone — breakout above 120,160 = 🚀 to 130,400, while a break below 116,990 = 💀 down to 108,270.
Waiting for 2 daily candle confirmations before entering . Stay sharp — this breakout could set the next major trend.

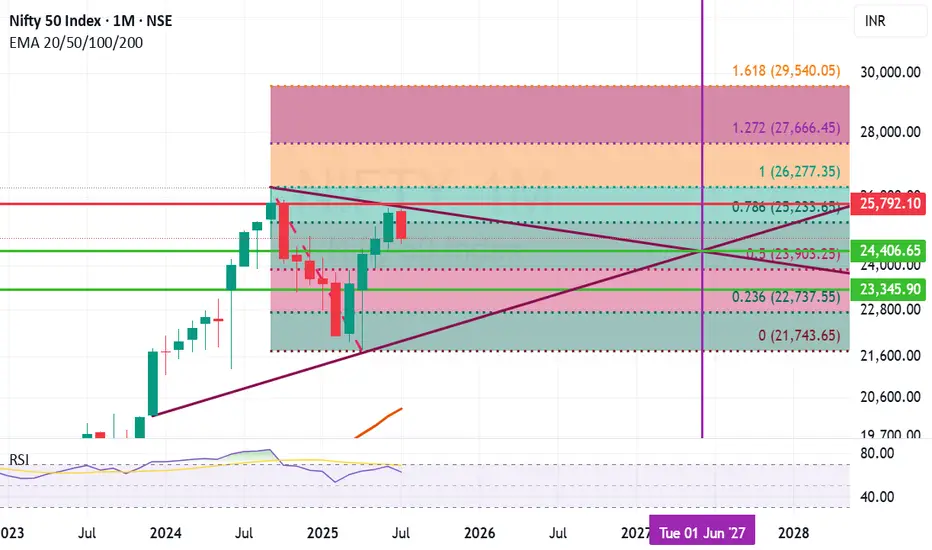
Long Term Nifty Analysis.(With Economic Commentary). We saw phenomenal resistance by Indian markets today after the Tariff announcements. Nifty bounced back and at one point was 330 points above low of the day. However there was Profit booking and selling on bounce due to prevailing Tariff uncertainties and Nifty came of the peak to close at 24768. Even after losing a lot of ground which it gained it ended up 133 points from the low of the day. Nifty ended the day in the negative losing 87.6 points from yesterday's close. This was much better than estimation of many experts. We might not be out of the woods yet but nevertheless fight back was phenomenal.
Now coming to Tariffs. I am not an expert in economy but let us assume the worst case scenario that trade negotiations fail and this is the tariff stays at 25% + Penalty. Again assuming that we loose 50% of our exports to US due to this decision. Say tariff would apply to 50b worth goods exported by us to USA and we 25b worth business. The impact on GDP will be as under.
GDP Impact = 25b/3.7T= 0.0067 = 0.67% of our GDP will be shaved off..(Rough Estimate). So say our is say 6.5. Then we continue to grow at 5.9 or 5.8. (Again I am not an expert and this estimate is based on a lot of assumption). This loss of GDP can be covered by increasing local consumption or exploring other market. Enhancing ties with markets outside USA. Thus it is not something which is going to kill Indian markets. We survived 1991, We survived Covid, We survived, Ukraine - Russia war, Israel-Iran conflict, Operation Sindoor Lows so we will survive this too and continue thriving. India is destined to become 3rd Largest Economy and unless there are local / internal political mishaps or mess-ups our growth will continue.
Fibonacci retracement of Nifty ant trend line analysis suggests few important support and resistance levels. The Horizontal line in the chart here suggests the cut off date. The chart suggests that:
Important Supports for Nifty remain at: 24406 (Mid Trend Support), 23903 (Important Fibonacci Support), 23345 (Important Candle support), (Below 23345 Nifty becomes very week and we will be in Bear grip where bears can drag Nifty down to 22737 or even 21742 in unlikely circumstances).
Important Resistance Levels: 25233 (Important Fibonacci resistance), 25792 (Important Candle resistance), 26277 (Previous All Time high), In the long term we might reach 27666 or even 29540 in close to 24 months time.
Conclusion:
Scenario 1) Indian Growth story continues and business thrive the optimistic range for Nifty by June 2027 seems to be the range between 26277 to 29540 or above.
Scenario 2) Indian economy faces changes and internal / external issues hamper progress the pessimistic range for Nifty by June 2027 seems to be anywhere between 23090 to 26277.
Scenario 3) Local or Global catastrophic events unfurl. Global and Indian economy takes a hit (Long drawn wars or local political leadership changes, Covid like events etc.) during this time frame 23090 to 21743 or below..(This does not seem likely but you never say never).
Disclaimer: The above information is provided for educational purpose, analysis and paper trading only. Please don't treat this as a buy or sell recommendation for the stock or index. The Techno-Funda analysis is based on data that is more than 3 months old. Supports and Resistances are determined by historic past peaks and Valley in the chart. Many other indicators and patterns like EMA, RSI, MACD, Volumes, Fibonacci, parallel channel etc. use historic data which is 3 months or older cyclical points. There is no guarantee they will work in future as markets are highly volatile and swings in prices are also due to macro and micro factors based on actions taken by the company as well as region and global events. Equity investment is subject to risks. I or my clients or family members might have positions in the stocks that we mention in our educational posts. We will not be responsible for any Profit or loss that may occur due to any financial decision taken based on any data provided in this message. Do consult your investment advisor before taking any financial decisions. Stop losses should be an important part of any investment in equity.
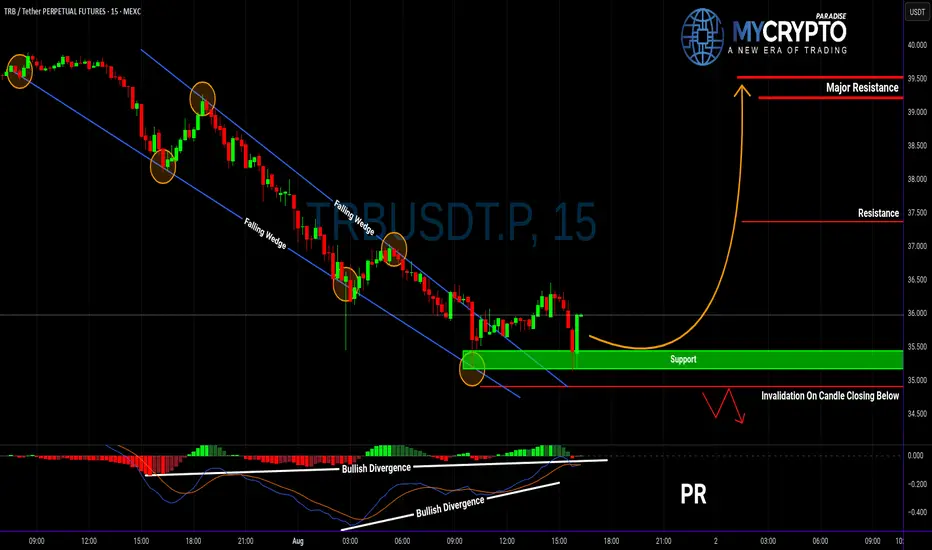
Is TRBUSDT About to Explode or Fake Out Everyone Again?Yello Paradisers! After weeks of quiet price action, is TRBUSDT finally gearing up for a real breakout—or is this just another trap before the next leg down? Let’s break it all down, because the next move could catch many traders on the wrong side.
💎TRBUSDT has recently broken out of a falling wedge pattern, accompanied by a clear bullish divergence—an encouraging sign that momentum may be shifting in favor of buyers. This type of setup historically carries a higher probability of a bullish move, especially if the breakout holds above key support levels. However, the entry strategy here is critical.
💎Ideally, we want to see a minor pullback. If that happens, it could offer a solid bounce opportunity from well-defined support zones, giving a favorable risk-to-reward setup. This is the scenario where patient traders will find the highest probability entries. On the other hand, aggressive traders might consider entering from current levels, but they must understand that doing so offers a less favorable risk-to-reward ratio. Jumping in too early without a clear confirmation could expose you to unnecessary risk, especially if the market reverses quickly.
💎More importantly, we have a clearly defined invalidation level. If TRBUSDT breaks below that level and closes a candle beneath it, this would invalidate the current bullish setup completely. In such a case, the best course of action would be to step aside and wait for a new structure or more reliable price action to form. Forcing trades in uncertain territory is how capital is lost and confidence shaken.
Strive for consistency, not quick profits. Treat the market as a businessman, not as a gambler. Protecting your capital and waiting for high-probability opportunities is what separates professional traders from the rest. Patience here could be the difference between a calculated win and a costly mistake.
MyCryptoParadise
iFeel the success🌴
EUR/AUD LongLike the long off the bottom the range for a bounce back up off the 1.77250 area to maybe first area of 1.78900 and full take profit of 1.79700
FX:EURAUD

Gold at Major Turning Point – Breakdown or Reversal Incoming?🔥 GOLD (XAU/USD) Daily Analysis – July 27, 2025
By: Asad Yaseen | Timeframe: 1D
Gold is currently positioned at a crucial turning point, and price action over the next few days will determine the medium-term direction. Here's a breakdown of all possible scenarios based on key supply-demand zones and institutional behaviour:
🔴 Scenario #01 – Bearish Bias Active (Confirmed Setup)
📉 Market Structure: Bearish
The current trend is clearly bearish, with no strong signs of reversal. Even if bullish patterns appear, they are likely just short-term retracements.
confirmed short target is 3302.
going long unless deeper zones show clear rejection.
🟢 Scenario #02 – Possible Bullish Rejection Zone
📍 Key Zone: 3194 – 3202
If the market tests and rejects this demand zone, a strong upside move is expected. This could mark the start of a rally toward 4000+, indicating a shift in macro sentiment.
A bullish rejection here would favour trend reversal trades.
⚫ Scenario #03 – Bearish Expansion Below Demand
📍 Breakdown Zone: 3122 – 3192
If price breaks below this zone with no rejection, expect a deeper drop. Targets are set between 2650 – 2560 in the coming days. Setup for swing or position traders waiting for clean continuation signals.
⚠️ Neutral Consolidation Warning
If price does not engage the 3194–3246 zone, expect sideways movement between 3370 – 3240 with low momentum.
📰 Fundamental Catalyst to Watch:
Expect major volatility after Jerome Powell’s FED Rate Cut announcement.
This news event may trigger massive liquidity shifts and trend-defining moves.
💡 Reminder for Traders:
Trade with structure, not emotions. Watch how price reacts at key levels and align with macro bias.
No confirmation = no trade.
📈 If you find this analysis helpful, don’t forget to like & follow for more high-probability setups.
Drop your thoughts or questions below 👇
