Supportandresistancezones

MSTR: Mid-term and Macro Price Structure As price holds below $344, odds favor a continuation lower to retest February lows, with later potential bounce and one more push to macro-support levels: 160/150-120 (with a potential extension to 105)
(see. recent idea on BTC price structure)
If BTC and broad market indexes show signs of stabilization and short-term strength over the coming weeks with MSTR price rising above 344, the odds are shifting to a more pronounce bounce to 400-460 resistance levels.
Weekly chart:
From a macro perspective:
as long as price remains below the 460 level, I consider the bullish trend since 2008 lows to have topped in November 2024, with current price action unfolding as part of a larger corrective Wave c.4 structure. Otherwise, If price reclaims ATH the door opens for an extension to 780-1280 resistance levels.
Monthly chart
Recent idea on BTC:

LTC ANALYSIS (support & resistance)🔮 #LTC Analysis 🚀🚀
💲💲 #LTC is trading between support and resistance area. There is a potential rejection again from its resistance zone and pullback from its major support area. If #LTC sustains above major support area then we will a bullish move till its major resistance area
💸Current Price -- $82.20
⁉️ What to do?
- We have marked crucial levels in the chart . We can trade according to the chart and make some profits. 🚀💸
#LTC #Cryptocurrency #DYOR

NKE: Macro structure [Monthly time frame]Price reached the top of the macro support: 56-27.
The correction from Nov'21 top has a picture perfect three-wave structure that has reached area of an ideal extension to finish itself (60-44 support).
Although, within the context of todays market uncertainty, recovery from this support zone, might still be a larger bounce before one more leg-down deeper into macro support
Best of trading and investing decision and thank you for you attention!

Weekly Closing not Good but..Weekly Closing not Good but
the Stock is Still Bullish on Bigger
Time Frames.
Price dropped with Low Volumes.
Weekly Important Support seems to
be around 42.50 - 44.10
49-50 is an Important Resistance as
of now.

Play wisely!Currently at an Important Support level.
Bullish Divergence on Daily Tf.
Currently also at Channel Bottom.
Couple of Bullish Candles will confirm that
Channel Bottom is respected.

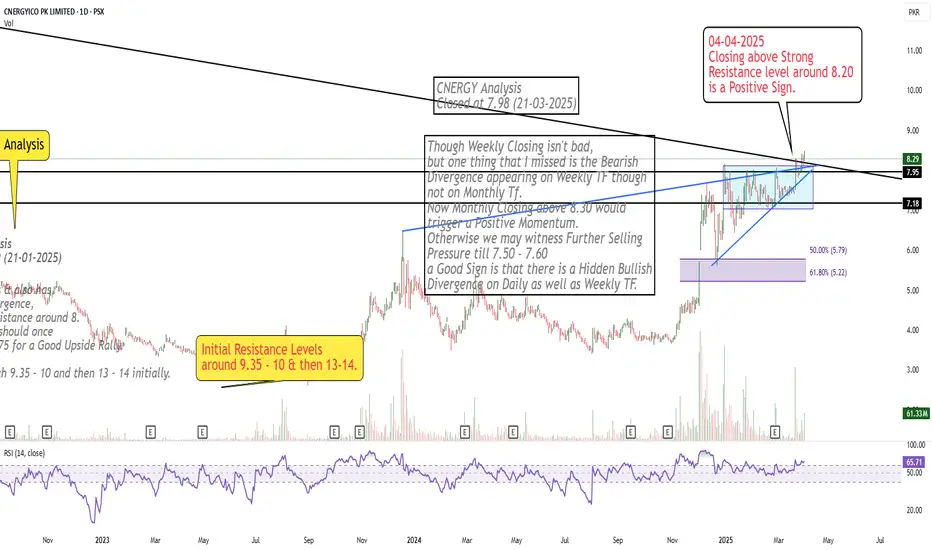
Crossed Important Resistance Area
Closing above Strong
Resistance level around 8.20
is a Positive Sign.
BTC ANALYSIS 🔮 #BTC Analysis 🚀🚀
💲💲 #BTC is trading between support and resistance area. There is a potential rejection again from its resistance zone and pullback from its major support area. If #BTC breaks resistance zone $88500 then there will a chance of bullish movement
💸Current Price -- $84470
⁉️ What to do?
- We have marked crucial levels in the chart . We can trade according to the chart and make some profits. 🚀💸
#BTC #Cryptocurrency #DYOR

NFP REPORT IMPACT ON XAUUSD ALERT!🚨 XAUUSD Market Alert 🚨
🔥 Current Action: XAUUSD is currently range-bound between 3101 and 3114—will it break out soon? The market’s at a critical point, and a sharp move could be on the horizon!
📉 Bearish Scenario: If price slips below this zone, keep an eye on potential support levels at 3070 and 3054. A downward shift could set up fresh opportunities for sellers.
📈 Bullish Scenario: On the flip side, a solid break above 3114 could trigger buying pressure, with targets at 3140 and 3170. A move like this could spark a new uptrend, especially with NFP data on the way, which could impact the gold market!
💬 Let’s Talk Strategy: What’s your take on the XAUUSD setup? Share your insights, and let’s navigate this golden opportunity together! 💰🚀

Warning Signs Flashing: Dow Jones Breaks Key SupportThe Dow Jones Index has officially broken its rising trendline support, signaling a possible shift in the medium-term trend. After losing this key ascending structure, price is now hovering near the psychological support zone of 40,000, which has historically acted as both resistance and support.
This level is crucial. If it holds, we could see a temporary bounce or consolidation. However, if the 40K zone fails to provide support, the index may head toward the next major support area around 38,000, aligned with the longer-term trendline support.
Do like and follow us
THANK YOU

BTC Mid-Term Outlook: Key Levels & Wave StructureAs long as March lows hold, there remains a technical possibility for one more wave up toward the 130K resistance zone. However, given the corrective three-wave structure of the recovery (rather than an impulsive five-wave move), I am now leaning toward the mid-term top being in place at January highs.
If price remains below last week’s high, my operative scenario favors one more leg down to the 64K–55K–51K macro support zone. If the downside scenario unfolds, it would still be technically valid for the entire corrective wave (2) to complete within the support zone mentioned, especially considering the underlying fundamental strength of the asset.
Should price break above last week’s high in the coming weeks, the odds shift in favor of a renewed uptrend, potentially reclaiming ATH and targeting 130K.
The super-macro structure that I'm following as an operative wave count, assumes multi-decades bullish cycle, with the next long-term expansion phase expected once price establishes a firm bottom in the discussed support zone:
Wishing you successful trading & investing decisions. Thank you for your attention!
PS: The wave structure of BTC, proposed in March 2024 idea, has fulfilled itself:

XAUUSD UNEMPLOYEMENT CLAIM BREAKOUT ALERT!🚨 XAUUSD Update 🚨
🔥 Price Action: XAUUSD is locked between 3144 and 3151—breakout imminent?
📉 Bearish View: If it drops below this range, watch for targets at 3130 and 3120. Stay sharp!
📈 Bullish View: A break above 3151 could set up buying opportunities. Target 3165 and 3200.
💬 Join the Discussion: Drop your thoughts and strategies below! Let’s ride the golden wave together! 💰🚀

XAUUSD 1H Head & Shoulders Pattern and Quasimodo!This 1-hour Gold (XAU/USD) chart presents a Head and Shoulders pattern forming near the 3,124 level, indicating a potential bearish reversal. The structure consists of:
Left Shoulder – A peak followed by a retracement.
Head – The highest point in the formation.
Right Shoulder – A lower high, confirming the pattern.
Additionally, a Quasimodo pattern is forming, reinforcing bearish sentiment if price fails to sustain above 3,139. A breakdown below the neckline suggests a potential move toward the projected target zone at 3,039.
Key Levels & Trade Plan
📍 Resistance: 3,139 (Quasimodo level)
📉 Support Levels: 3,107 – 3,085 – 3,039 (Main target)
📊 Bearish Confirmation: Break below the neckline (~3,120)
🎯 Target Zone: 3,039
A clean breakdown below the neckline could accelerate bearish momentum, aligning with the projected drop of approximately 62.7 points (-2.02%). Bulls need to reclaim 3,139 for any invalidation of this bearish outlook. Keep an eye on price action confirmation before entering trades.

EURCHF bullish view
OANDA:EURCHF in first analysis price in moment is make break of crucial zone, at end soon after price is start testing zone again and its make bullish push, currently here now still bullish we can exepct for next periods.
SUP zone: 0.95400
RES zone: 0.96400

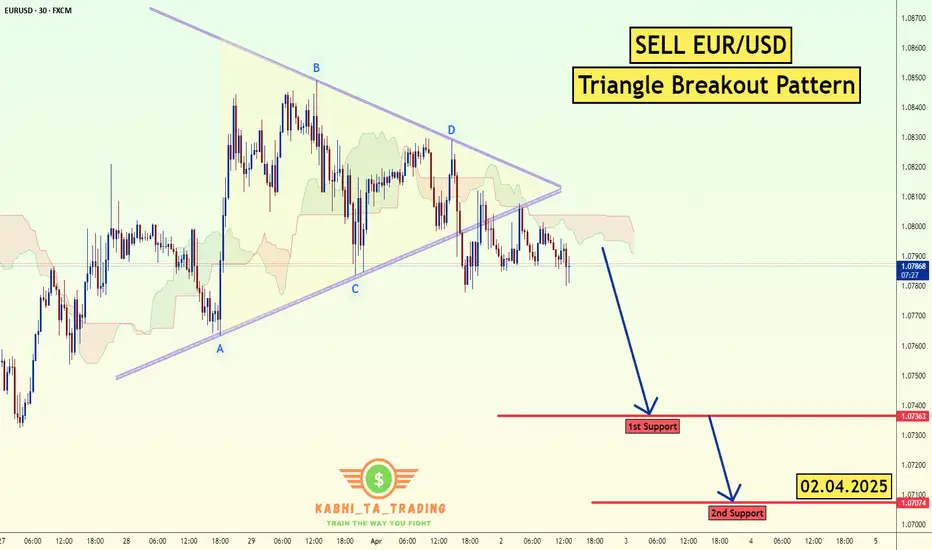
EUR/USD Triangle Breakout (02.04.2025)The EUR/USD Pair on the M30 timeframe presents a Potential Selling Opportunity due to a recent Formation of a Triangle Breakout Pattern. This suggests a shift in momentum towards the downside in the coming hours.
Possible Short Trade:
Entry: Consider Entering A Short Position around Trendline Of The Pattern.
Target Levels:
1st Support – 1.0736
2nd Support – 1.0707
🎁 Please hit the like button and
🎁 Leave a comment to support for My Post !
Your likes and comments are incredibly motivating and will encourage me to share more analysis with you.
Best Regards, KABHI_TA_TRADING
Thank you.
Altseason 2025 is upon us *A different take*Welcome back dearest reader,
I've been covering some altcoins i'm bullish on, and a deeper dive into bitcoin dominance is key for their succes. Well the downfall of the dominance that is.
On the chart:
~The fibonacci extension has shown gradual weakness throughout the cycles starting at the 1.618 then the 1, now the 0.786 is inbound. I expect it to be hit soon topping at around 66% dominance. We can see what happened next ''1''
~MFI is hitting an oversold zone like never seen before on the 3 month ''2''
~Stoch RSI is hitting an oversold zone and is bound to see a cross ''3''
Load up on your favourite alts and enjoy the ride.
~Rustle

Bullish on Monthly TF.Bullish on Monthly TF.
Though HL Confirmed on Bigger TF but Important
to Cross & Sustain 730 & if this level is Crossed with
Good Volumes, we may witness 770 - 775 initially.
On the flip side, 640 - 645 may act as Immediate
Support.
It should not break 608, otherwise we may witness
more Selling Pressure towards 550 - 570.

No Bearish Divergence Yet!Bullish on Monthly TF.
Though HL Confirmed on Bigger TF but Important
to Cross & Sustain 730 & if this level is Crossed with
Good Volumes, we may witness 770 - 775 initially.
On the flip side, 640 - 645 may act as Immediate
Support.
It should not break 608, otherwise we may witness
more Selling Pressure towards 550 - 570.

Play On LevelsRetested the Breakout Level around 180 - 185 &
Closed just above a Very Important fib level around
188.
But, 188 - 195 is Very Important Resistance as of now.
If 195 is Crossed with Good Volumes, 212 - 215 can be
touched initially.
Couple of Positive Weekly Candles with comparatively good
volumes may confirm HL on Monthly basis.
On the flip side, 175 - 184 is a Support Zone & also Double
Bottom around 175 - 176, so Short Term Traders may
expect a bounce from this level.

AUDCHF time to see changes?
OANDA:AUDCHF much upsides-downsides we are not see some special moves here from start of Mart.
Today we are have RBA, AUD looks like its gather power, currently price exepcting to come in zone and break of same expecting in this week.
CHF showing self weak and with other pairs, like CAD and GBP.
SUP zone: 0.55000
RES zone: 0.56200, 0.56600

SOLANA at key support zone - Is $160 within reach?BINANCE:SOLUSDT has reached a major support level, an area where buyers have previously shown strong interest. This zone has acted as a key zone, increasing the likelihood of a bounce if buyers step in.
A bullish confirmation, such as a strong rejection pattern, bullish engulfing candles, or long lower wicks, would strengthen the case for a move higher. If buyers take control, the price could rally toward the $160 target. However, a decisive breakdown below this support would invalidate the bullish scenario and could lead to further downside.
This isn’t financial advice, just my take on how I approach support and resistance zones. Best to wait for clear confirmation, like a strong rejection or a volume spike, before making a move.
Every trader has a unique perspective. Let’s discuss this setup within the TradingView community!

CHZ/BTC about to score a goal?Welcome back dearest reader,
If you have been following me you're quite aware i'm very bullish on this project. Fundamentals aside the charts look amazing. And CHZ/BTC is no exception to this!
Deeper dive:
~Trendlines --> As you can see at trendline ''1'' chz has found support going way back to 2021, you can see what happened next. The bars pattern from 2021 has been copied and shows a strong impulsive move going into june. Trendline ''2'' just shows the downtrend we've been in in relation to BTC, i don't expect this to fall below legacy support ''1''.
~MFI --> The Money Flow Index (MFI) is a technical indicator used in financial analysis to measure the strength and momentum of money flowing in and out of a security, typically on a scale from 0 to 100. It combines price and volume data to help traders identify overbought or oversold conditions, often signaling potential reversals in the market. As we can see it's massively oversold and yearning for a reversal ''3''.
~Stochastic RSI --> The Stochastic RSI (Stoch RSI) is a momentum oscillator that combines the Stochastic indicator and the Relative Strength Index (RSI) to measure the RSI's position relative to its recent high-low range. It ranges from 0 to 1 (or 0 to 100 when scaled), helping traders spot overbought or oversold conditions and potential trend shifts with greater sensitivity than the RSI alone. For CHZ also in a massive oversold condition ''4''.
Summary:
~Trend has bottomed and could provide a strong move for CHZ
~MFI and stoch RSI are massively oversold.
Note: This is the CHZ versus BTC chart, this means that even if BTC trades sideways or bottoms CHZ could do well. This would coincide with BTC.D dropping.
Any questions? Ask.
~Rustle

EURCHF short bearish push expected
OANDA:EURCHF trend based analysis, we can see bearish trend in last period, we are have rectangle channel, which is breaked, price is start moving more bearish, its make few revers on sup zone, few touches of sup zone.
Now we can see strong bearish candle, from here now expecting this structure is confirmed and we can see now higher bearish fall.
SUP zone: 0.95500
RES zone: 0.94350
