EurUsd- The "big" move is down, not upLast week, TRADENATION:EURUSD reached a high of around 1.09 and has been consolidating ever since, now for the fifth consecutive trading day. Despite some weak upward spikes, the pair remains in a range-bound phase.
From a technical perspective, multiple resistance levels lie ahead, with the psychological 1.10 mark acting as a key barrier. Given the current price action, I believe this consolidation is more likely to result in a downside breakout rather than a continuation of the uptrend.
There is a strong possibility that EUR/USD will correct the impressive rally that began in early March.
With this outlook in mind, I see more downside potential than upside and I am considering selling into rallies, targeting a move toward 1.07.
Disclosure: I am part of Trade Nation's Influencer program and receive a monthly fee for using their TradingView charts in my analyses and educational articles.
Supportandresistancezones
XAU/USD (Gold) Triangle Breakout (26.03.2025)The XAU/USD pair on the M30 timeframe presents a Potential Buying Opportunity due to a recent Formation of a Triangle Breakout Pattern. This suggests a shift in momentum towards the upside and a higher likelihood of further advances in the coming hours.
Possible Long Trade:
Entry: Consider Entering A Long Position around Trendline Of The Pattern.
Target Levels:
1st Resistance – 3054
2nd Resistance – 3066
🎁 Please hit the like button and
🎁 Leave a comment to support for My Post !
Your likes and comments are incredibly motivating and will encourage me to share more analysis with you.
Best Regards, KABHI_TA_TRADING
Thank you.
Market Consolidation Key Levels for Profitable Moves and 1000Hey Trader! 👋
Market in Range Consolidation – Time to Make Smart Moves! 🔥
Right now, the market is consolidating in a tight range between 3015 to 3030, creating a perfect opportunity to sell at resistance and buy at support. 📉📈 The price action is bouncing back and forth, and our strategy is simple—wait for the range break to confirm the next big move! 🚀 If we get that break, we're looking at 1000 pips profit potential! 💰
🔑 KEY LEVELS:
- BUY at3050: Watch for a potential breakout above this level! If the market pushes past here, we could see a new all-time high (ATH) and 3100 isn't too far off for gold! 🏅✨
- SELL at 3000: First, let’s see if the market sweeps this level. If it does, we could be headed to **2970**—another great opportunity to capitalize on the bearish move! 📉
As always, follow risk management to protect your capital. 📊🔒 Set your stops and position sizes wisely, and stay patient as we wait for that key range break to confirm the trend! 🛑⚖️
Ready to make moves? Let’s keep an eye on these key levels and let the market come to us! 💪💥
IPG 1H Swing Long Aggressive CounterTrend TradeAggressive CounterTrend Trade
- short balance
+ volumed Sp
+ weak test
+ first bullish bar close entry
Calculated affordable stop limit
1 to 2 R/R take profit
Day CounterTrend
"- short balance
+ support level
+ volumed expanding ICE level"
Month CounterTrend
"- short impulse
+ support level
+ T1 level
- before 1/2 correction"
Year Trend
"+ long impulse
- correction"
XAUUSD: Battle for New Highs – Bullish or Bearish?🚨 Attention Traders!🚨
🔥 XAUUSD is on FIRE! Price action is 🔥, and we're seeing a major battle at 3004 - 3014! Will it break out?
Bearish Alert 📉: If price dips below this zone, we could see targets around 2988 and 2998. Keep an eye on these support levels!
Bullish Opportunity 📈: A breakout above 2911 could lead to buying opportunities! Watch for moves above 3025 with targets at 3035 and 3050.
💬 Join the convo! Share your thoughts & strategies — let’s ride the gold wave together and catch these opportunities! 🚀✨
EUR/USD 1H Chart Analysis – Falling Wedge Breakout StrategyOverview of the Chart
The EUR/USD 1-hour chart is forming a falling wedge pattern, which is a bullish reversal setup. This indicates that although the price has been trending downward, the selling pressure is weakening, and a breakout to the upside is becoming more likely.
Currently, the price has broken above the wedge, signaling potential trend reversal. However, traders should watch for a retest of the breakout level to confirm whether the price holds above the resistance-turned-support area before further upward movement.
Key Components of the Chart
1️⃣ Falling Wedge Pattern (Bullish Reversal Signal)
A falling wedge consists of two downward-sloping trendlines that converge, showing a narrowing price range. This pattern is formed when:
The price makes lower highs and lower lows, indicating a downtrend.
The slope of the lower trendline is less steep than the upper one, meaning sellers are losing momentum.
Eventually, the price breaks out above the upper trendline, confirming a bullish reversal.
2️⃣ Support & Resistance Levels
✅ Support Zone (Key Demand Area)
The price recently tested a strong support level (highlighted in beige), where buyers aggressively entered the market.
This level has held multiple times, indicating that buyers are stepping in whenever the price reaches this zone.
The green upward arrow suggests that this is a key accumulation area, where demand is stronger than supply.
🚫 Resistance Zone (Profit Target)
The resistance zone near 1.09450 is the first major target for bulls.
Historically, price action has struggled to break through this level, making it a logical place to take profits.
3️⃣ Breakout Confirmation & Retest
The price has successfully broken out above the falling wedge, which is a strong buy signal.
However, a retest of the breakout level (marked by the yellow circle) might occur before further bullish continuation.
If the price retests and holds above the previous resistance (now support), this will confirm the breakout and provide an additional buying opportunity.
Trade Execution Strategy
📌 Entry Point:
Enter a long trade after the breakout confirmation.
For conservative traders, waiting for a successful retest before entering can reduce risk.
📌 Stop-Loss Placement:
Place a stop loss just below the recent swing low at 1.07541 to limit downside risk.
This ensures that if the breakout fails, the trade is exited with minimal loss.
📌 Profit Target:
The first take-profit target is at 1.09450, the key resistance level.
If bullish momentum continues, traders can look for higher targets based on price action.
📌 Risk-to-Reward Ratio:
This setup provides a favorable risk-to-reward ratio, meaning that potential profits outweigh the risk taken on the trade.
Technical Indicators Supporting the Trade
📈 Trend Reversal Signals
The market has been in a downtrend, but the falling wedge signals a potential reversal.
A higher low after the breakout would further confirm the uptrend.
📊 Volume Confirmation
Ideally, a breakout should be accompanied by increased volume, showing strong buying pressure.
If volume is low, a false breakout could occur, requiring careful trade management.
🔍 Retest & Price Action
A retest of the breakout level should hold above the wedge to confirm bullish momentum.
If the price fails to hold and falls back below, the breakout may have been a fakeout, meaning traders should exit or wait for re-entry.
Risk Management & Trade Considerations
Always use a stop-loss to manage risk.
If the price fails to stay above the breakout level, consider exiting early.
Watch for external market factors such as news events or economic data releases, which can impact EUR/USD volatility.
Conclusion: Bullish Momentum is Building 🚀
This falling wedge breakout on the EUR/USD chart provides a high-probability long trade setup. As long as price holds above the breakout level, bullish continuation toward 1.09450 is expected. Traders should monitor price action carefully and adjust their positions accordingly to maximize gains while managing risks.
#ARCUSDT is showing signs of reversal📉 Short BYBIT:ARCUSDT.P from $0.06780
🛡 Stop loss $0.07117
🕒 1H Timeframe
⚡️ Overview:
➡️ The main POC (Point of Control) is at 0.05873, indicating the area with the highest trading volume.
➡️ The 0.07117 level acts as strong resistance where the price previously reversed.
➡️ The chart shows a potential topping structure followed by a decline.
➡️ Volume concentration between $0.065 and $0.06210 suggests key zones for potential profit-taking.
🎯 TP Targets:
💎 TP 1: $0.06510
💎 TP 2: $0.06210
💎 TP 3: $0.06050
📢 Watch the key levels and enter after confirmation!
📢 The price has already started to move down — downside momentum remains strong.
📢 The TP levels are near a previous consolidation zone, allowing quick target execution.
BYBIT:ARCUSDT.P is showing signs of reversal — considering shorts with clear downside targets!
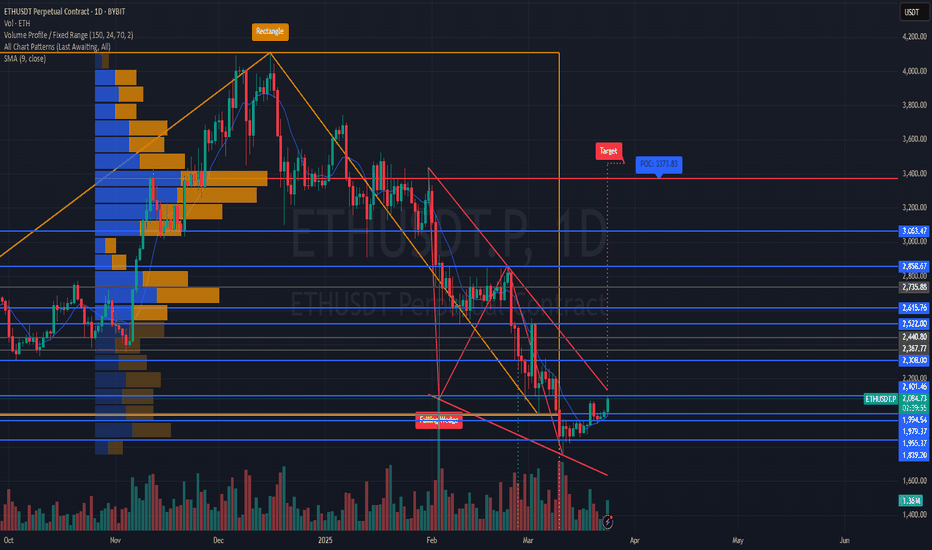
#ETHUSDT is forming a potential mid-term reversal📉 LONG BYBIT:ETHUSDT.P from $2102.90
🛡 Stop loss at $2083.00
🕒 Timeframe: 1D (Mid-term idea)
✅ Overview:
➡️ BYBIT:ETHUSDT.P Falling Wedge breakout confirmed on the daily chart.
➡️ Successful retest of the $1,955–$2,041 zone.
➡️ Holding above $2,101 opens the way to higher levels.
➡️ Volume is increasing post-breakout — confirming buyer interest.
➡️ Next strong resistance block lies between $2,308–$2,522.
🎯 TP Targets:
💎 TP 1: $2112.00 — nearest resistance and key liquidity zone.
💎 TP 2: $2125.00 — a critical daily level, zone of pullback from previous drop.
💎 TP 3: $2134.00 — potential impulse target toward major POC ($3,373).
📢 If price fails to hold above $2,068 and breaks below $2,041 — the setup is invalidated.
📢 A retest of $2,101 from below may be needed before a stronger upward move.
📢 Volume support at $1,955 is critical for the bullish case.
🚀 BYBIT:ETHUSDT.P is forming a potential mid-term reversal — if price holds above $2,101, a move toward $2,200+ and beyond is expected.
POSI 1H Investment Long Aggressive Trend TradeAggressive Trend Trade
- short impulse
+ exhaustion volume
- resistance level
+ long volume distribution
Calculated affordable stop limit
1/2 1M take profit
1D Trend
"+ long impulse
+ support level
+ T2 level?
+ 1/ 2 correction
+ weak approach"
1M Trend
"+ long impulse
+ 1/2 correction
+ biggest volume expanding T1
+ support level
+ biggest volume manipulation"
1Y Impulse
+ long impulse
POSI 1H Swing Long Conservative Trend TradeConservative Trend Trade
+ long impulse?
+ exhaustion volume
+ support level
+ long volume distribution
Calculated affordable stop limit
1/2 1M take profit
1D Trend
"+ long impulse
+ support level
+ T2 level?
+ 1/ 2 correction
+ weak approach"
1M Trend
"+ long impulse
+ 1/2 correction
+ biggest volume expanding T1
+ support level
+ biggest volume manipulation"
1Y Trend
+ long impulse
F 1H Swing Long Conservative Trend TradeConservative Trend Trade
- long impulse
- volumed T2
+ support level
+ 1/2 correction
+ biggest volume Sp
Calculated affordable stop limit
1 to 2 R/R take profit
Day Trend
"+ long impulse
+ 1/2 correction
- neutral zone
- context direction short"
Month CounterTrend
"- short impulse
+ 1/2 correction
- unvolumed T1
+ support level
+ long volume distribution
+ biggest volume manipulation"
Year Trend
"+ long impulse
+ volumed T2 level
+ volumed 2Sp+
+ 1/2 correction
+ weak test"
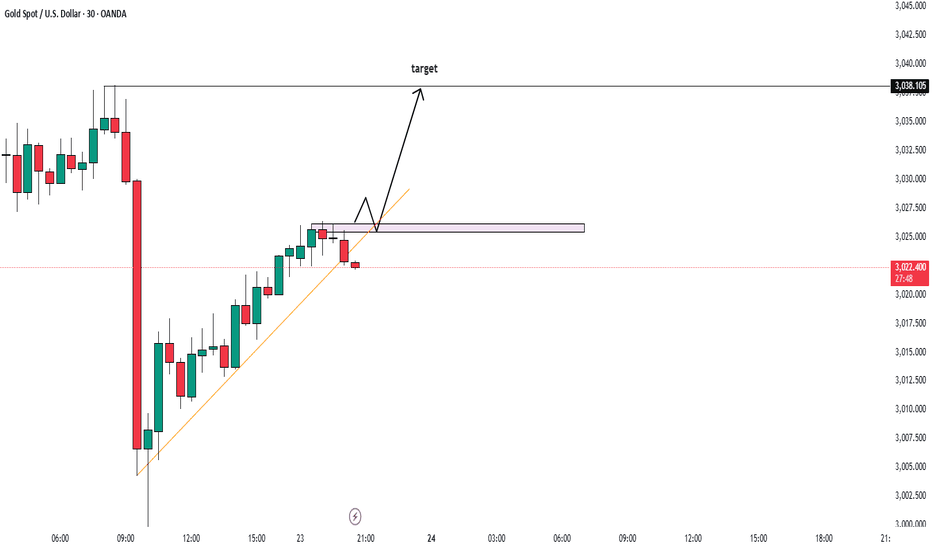
BULLISH MOVEMENT AFTER 3000 LEVEL RETEST ALERT!Hello trader
today market is higher high mark and continue bull pattern and also make a trend line in m30
so we wait to break and test for change the trend wanna gold see 4 Time tap and go for BUY
and trend also bullish so going with bull bias
key level for target 3045 and 3060
GBPCHF still bullish to see?
OANDA:GBPCHF what's next, in first analysis (attached) highly accurate, we are have nice strong bullish push.
Long strong zone is breaked, technicals are still strong bullish, CHF still what can see is to expect bearish and with some other pairs.
Currently price is in ASCENDING CHANNEL, having good sup zones, personally here expecting one more bullish push.
SUP zone: 1.13800
RES zone: 1.15100, 1.15550
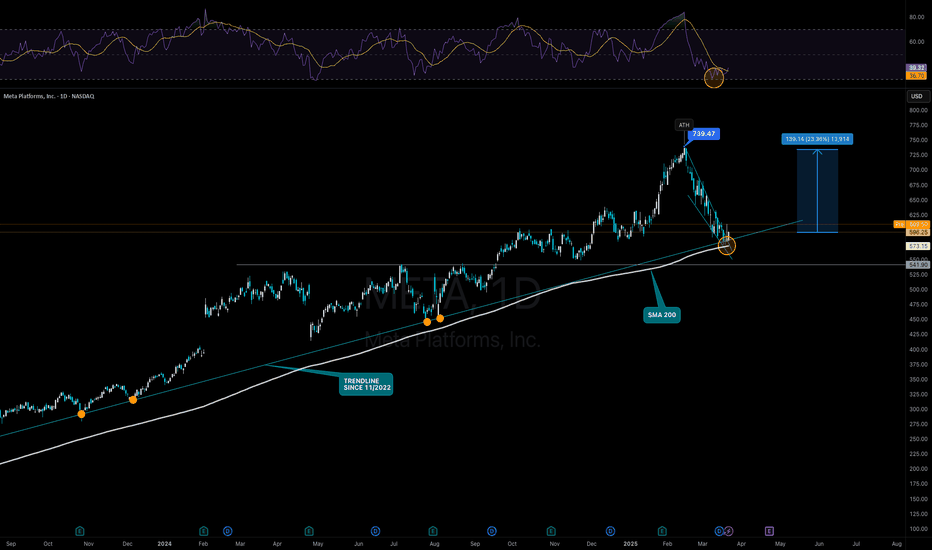
META to $740 - Chance for Strong BounceNASDAQ:META Meta has hit the trend line from November 2022 after a price loss of 20% and has shown with a first small bounce that it is still relevant. At the same time, the SMA200 is also at the same point. Last but not least, the 0.238 Fib is also located in this area (from the entire upward movement from November 2022). Technically, we can therefore definitely expect a bounce that could take us to the previous ATH at $739.
Fundamentally, Meta is also not overvalued due to its strong growth. As with many of the Mag7s, there are still problems with the AI strategy, which does not appear to be well thought out in either monetary or structural terms. However, Meta is a good candidate for actual efficiency gains due to its affiliation with the advertising market. However, the general growth is already reason enough to buy.
Support Zones
$580.00
$541.00
Target Zones
$740.00
S&P500 Next Key Levels I will be waiting to see if we get some short term buying before continuing down to $5,200 levels.
Waiting for price to reach the $5,800 area and anticipating a strong rejection to continue the bearish trend.
After confirmation of the rejection, I will be looking for simple lower lows, lower highs before entering a sell, preferably around the $5,600 mark.
What are your thoughts on the AMEX:SPY and the THINKMARKETS:USDINDEX in general?
CHF/USD Trading Setup – Triple Bottom Reversal & Breakout Setup🔍 Overview of the Chart Setup
The CHF/USD (Swiss Franc vs. U.S. Dollar) 1-hour timeframe chart reveals a classic Triple Bottom pattern, which is a well-known bullish reversal signal. This pattern indicates that sellers have attempted to break the support level three times but failed, suggesting a potential shift in momentum from bearish to bullish.
Traders closely watch this structure as it often leads to a strong upward breakout once key resistance levels are breached. The current setup provides an excellent risk-to-reward trading opportunity, especially for those looking to capitalize on the breakout.
📊 Key Levels in the CHF/USD Chart
1️⃣ Support and Resistance Zones
🟢 Support Level (~1.1300 - 1.1280 Zone)
This zone has been tested three times, confirming strong buying interest at this price level.
The formation of long wicks on candlesticks signals strong demand and buyer dominance.
A breakdown below this level would invalidate the bullish setup and may indicate a continuation of the bearish trend.
🔴 Resistance Level (~1.1415 - 1.1430 Zone)
This level acts as a price ceiling, where previous bullish attempts were rejected.
A break and retest above this zone would confirm the Triple Bottom breakout.
🎯 Target Level (~1.1457 Zone)
The projected target is based on the height of the pattern, which is measured and added to the breakout point.
This level aligns with previous price action zones and acts as a natural take-profit area for traders.
🚨 Stop-Loss Level (~1.1243 Zone)
A stop-loss is placed below the support zone to protect against false breakouts or an invalidation of the pattern.
📉 Understanding the Triple Bottom Pattern
The Triple Bottom is a strong bullish reversal formation that occurs at the end of a downtrend. It signals that sellers are exhausted, and buyers are gradually taking control.
🔹 Breakdown of the Triple Bottom Formation
✅ Bottom 1 (First Low)
The first bottom forms when the price hits the support level and bounces back.
Sellers are still active, so price declines again to test the same support zone.
✅ Bottom 2 (Second Low - Confirmation of Support)
The second test of the support zone validates the demand area.
Buyers step in again, pushing the price upward.
The market still lacks enough momentum for a breakout, leading to a third retest.
✅ Bottom 3 (Final Low and Strong Rejection)
The third bottom is crucial because it signals the last test of support before a breakout.
The failure to break lower creates a higher probability of an upside move.
📌 Breakout Confirmation & Price Action Signals
🔵 The breakout is confirmed when:
The price closes above the resistance zone (1.1415 - 1.1430) with strong momentum.
Volume spikes during the breakout, indicating institutional buying interest.
A successful retest of the resistance zone as new support further validates the trend reversal.
If the breakout lacks volume or gets rejected, traders should be cautious of a fakeout or potential retracement.
📈 Trading Strategy & Execution Plan
🔹 Conservative Entry (Safe Approach)
Enter after a confirmed breakout above 1.1415, ensuring a strong candle close above resistance.
Look for a retest of the breakout level before entering the trade.
🔹 Aggressive Entry (Early Positioning)
Enter near the third bottom (~1.1300 - 1.1320) with a tight stop-loss.
Higher risk but better reward if the price moves upward without retesting.
🔹 Stop-Loss Placement
Conservative traders: Place the stop-loss below the support zone (~1.1243).
Aggressive traders: Place a tight stop below the recent swing low for better risk management.
📌 Profit Target Projection
Take Profit Target: 1.1457, based on the height of the pattern.
📌 Risk-to-Reward Ratio
Risk: ~60 pips (from entry to stop-loss).
Reward: ~150 pips (from entry to target).
Risk-to-Reward Ratio: 1:3, making it a high-probability trade.
📡 Additional Confirmation Indicators for Stronger Trade Setup
📊 1. Volume Analysis
A spike in volume at the breakout level suggests strong buyer interest.
Low volume on the breakout may indicate a potential fakeout.
📈 2. RSI (Relative Strength Index) Confirmation
RSI should be above 50 and trending upward to confirm bullish momentum.
If RSI is overbought (>70), watch for a pullback before entering the trade.
📉 3. Moving Averages Support
If the 50-period or 200-period moving average supports the breakout level, it adds extra confirmation.
A moving average crossover may further validate the trend reversal.
🔍 4. Beware of Fake Breakouts
If the price briefly moves above resistance but fails to hold, it may be a bull trap.
Always wait for a candle close above resistance and a potential retest before confirming the entry.
🛠️ Alternative Scenarios & Market Risks
🔺 Bullish Scenario (Breakout & Rally to Target)
Price breaks above 1.1415, confirming a trend reversal.
A retest of resistance as support gives additional buying confidence.
Price reaches 1.1457 target before facing new resistance.
🔻 Bearish Scenario (Fakeout & Breakdown Below Support)
Price fails to hold above resistance and falls back below support.
A breakdown below 1.1243 invalidates the pattern, triggering a bearish continuation.
Traders should cut losses quickly if the setup is invalidated.
⚠️ Fundamental Risks to Watch
U.S. Dollar news events (FOMC, NFP, CPI reports) can increase volatility.
Swiss economic data may impact CHF strength.
Unexpected geopolitical events can influence currency movements.
🔎 Summary of the Trading Plan
📌 Trading Strategy Checklist
✅ Pattern: Triple Bottom (Bullish Reversal).
✅ Entry Strategy: Buy after breakout confirmation above 1.1415.
✅ Take Profit Target: 1.1457.
✅ Stop-Loss Level: Below 1.1243.
✅ Risk-to-Reward Ratio: 1:3 (High-Profit Potential with Proper Risk Management).
💡 Final Thought:
This setup provides a high-probability bullish trade with strong technical confluence. However, always remain cautious of market news, economic reports, and sudden volatility that could influence price action.
🚀 Patience & discipline are key—wait for confirmation before entering! 📊
#VICUSDT shows signs of reversal and strength📉 LONG BYBIT:VICUSDT.P from $0.2507
🛡 Stop loss $0.2470
🕒 1H Timeframe
📍 Important Note:
Wait for confirmation around the $0.2507 level. Enter the trade only if price holds above with volume.
✅ Overview BYBIT:VICUSDT.P :
➡️ The chart shows a completed Falling Wedge — a bullish reversal pattern that typically leads to an upside breakout.
➡️ After that, a Bearish Pennant formed but failed to push the price significantly lower, indicating weakness in sellers.
➡️ Currently, the price is breaking out of the triangle pattern, hinting at a possible bullish continuation.
➡️ Entry level marked at $0.2507, right after the breakout zone, supported by steady volume and short-term uptrend.
➡️ Volume Profile on the left reveals a low-volume zone above, making it easier for price to climb toward TP targets.
🎯 TP Targets:
💎 TP 1: $0.2525
💎 TP 2: $0.2545
💎 TP 3: $0.2565
⚡ Plan:
➡️ Monitor price reaction at TP1 — partial exit recommended.
➡️ Watch for confirmation above $0.2507.
➡️ Enter LONG after retest and volume confirmation.
➡️ Set stop loss below recent low — at $0.2470.
🚀 BYBIT:VICUSDT.P shows signs of reversal and strength — holding above the breakout zone could lead to upside movement!
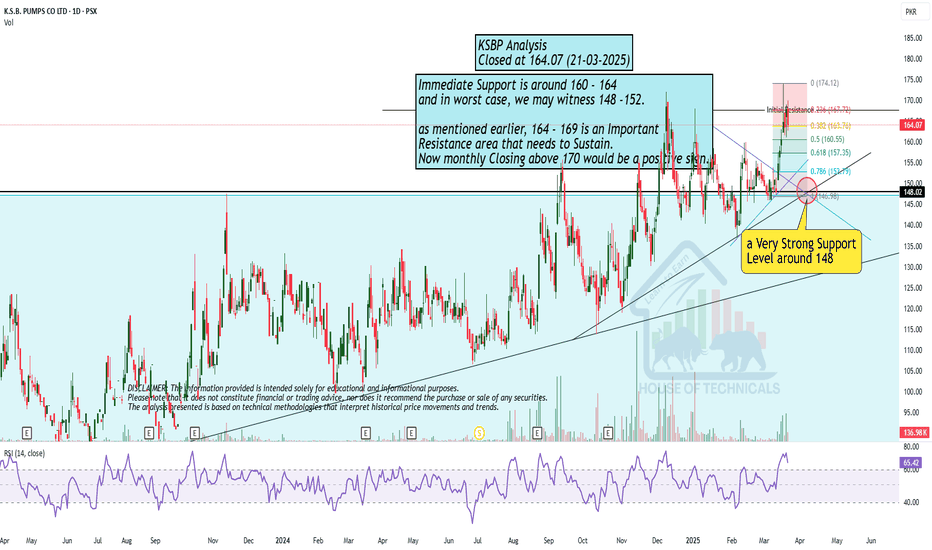
Weekly Closing just at Resistance!Weekly Closing just around Resistance
level (580), so a slight pressure may be seen, unless it
Sustains 580. If this be the case, 545 - 565 can be witnessed.
Bullish on Weekly TF & a perfect
Morning Star Formation on Weekly Tf.
Also, it has retested the previous breakout level
around 520.
Now it should Cross & Sustain 605-606 to continue
its Bullish Momentum & immediate targets can be around
650 - 655.
On the safe side, 596 - 621 Zone is a Resistance zone.


