BNB - will there be enough time for further growth in this cycleHello everyone, I invite you to review the current situation on BNB. When we enter the one-month interval, we can see how the price, after a long period of bearishness, turned into an upward trend in which it came out on top of the long-term downward trend line. Currently, we can see the movement along the upward trend line, which is also a support line for declines.
Here we can see how the price is currently based on support at $ 670, however, if this support is broken, we can then see the price quickly descending again to the area of a strong support zone from $ 540 to $ 460.
Looking the other way, we can see that when the trend reverses, we first have a resistance zone from $ 744 to $ 810, only when we come out on top of this zone can we see further movement towards $ 893, which may open the way towards another strong resistance in the area of $ 1134.
The RSI indicator shows that we are staying above the upper limit, which could potentially indicate an approaching larger rebound, but before that we may still see an attempt at growth so that the indicator reaches its previous highs.
Supportandresistancezones

#ADAUSDT Approaching Key Resistance – Breakout or RejectionBYBIT:ADAUSDT.P is showing strong bullish momentum, breaking above the $0.8150 resistance zone. Volume is increasing, confirming buyer interest, and the price remains above POC $0.7848, supporting the uptrend. However, the next move will depend on the reaction at $0.8190.
📊 LONG BYBIT:ADAUSDT.P from $0.8190
🛡 Stop Loss: $0.8085
⏱ 1H Timeframe
✅ Overview:
➡️ BYBIT:ADAUSDT.P is testing the upper boundary of its recent range, attempting to hold above $0.8150.
➡️ Buyers are active, but confirmation of the breakout is still needed.
➡️ Holding above $0.8190 would increase the likelihood of reaching $0.8410.
⚡ Plan:
✅ Long confirmation requires a breakout above $0.8190 with strong volume.
✅ If volume decreases, a pullback to $0.8085 is possible before further upside.
✅ Another option is a retest of $0.8150 before a new breakout attempt.
🎯 Take Profit:
TP1: $0.8410 – next resistance level.
🚀 BYBIT:ADAUSDT.P is gaining strength — expecting a test of $0.8410!
⚡ Best approach – watch price reaction at $0.8190. If price holds above this level, the long trade remains valid. If weakness appears, a pullback to $0.8085 is likely.
⚡ Key rule – wait for confirmed breakout before entering, don’t anticipate it!

O 1H Long CounterTrend TradeCounterTrend Trade
- short impulse
+ volumed T1
+ volumed Sp
+ weak test
+ below first bullish bar close entry
Calculated affordable stop limit
1 to 2 R/R take profit expandable to Investment
Daily Trend:
"+ long impulse
+ exhaustion volume
+ T2 level
+ support level"
Monthly Trend:
"+ long impulse
+ 1/2 correction
- SOS broken"
Yearly Trend:
" + long balance
+ volumed manipulation
- neutral zone"

#AIXBTUSDT: Get Ready for a Breakout! Short Still the Priority?BYBIT:AIXBTUSDT.P is showing significant weakness after a prolonged downtrend, and now the market is at a critical level. Buyers failed to initiate even a minor rebound, indicating strong selling pressure.
🔎 Key Factors Right Now:
✔ Current Price: $0.23480
✔ Daily Change: -10.76%
✔ Key Levels:
🔹 Resistance: $0.38080, $0.31670
🔹 Support: $0.22063
━━━━━━━━━━━━━━━━━━━━━━
💡 Main Signals Influencing the Market:
📌 No rebound after the drop – the lack of buying pressure increases the chances of further decline.
📌 Empty space ahead – below $0.2206, there are no strong support zones, meaning a sharp drop could follow.
📌 Closing near a critical level – price remains at risk, increasing the likelihood of a breakdown.
📌 Breakout from consolidation – the asset has left its range, signaling the potential formation of a new trend.
━━━━━━━━━━━━━━━━━━━━━━
📉 Main Scenario: Continued Decline
🔻 If BYBIT:AIXBTUSDT.P breaks below $0.2206, the market may accelerate downward:
✅ Target 1: $0.2100 – the nearest technical support.
✅ Target 2: $0.1955 – a zone where a short-term bounce could occur.
✅ Target 3: $0.1780 – a major support level where stronger buyer resistance is expected.
📢 Short remains the priority as long as price stays below $0.2300.
A breakdown of $0.2206 could trigger liquidations and accelerate the drop.
Be cautious with long positions – there are no strong reversal signals yet.
━━━━━━━━━━━━━━━━━━━━━━
🟢 Alternative Scenario: Bullish Reversal
If BYBIT:AIXBTUSDT.P holds above $0.2300 and starts to recover, potential targets include:
✅ Target 1: $0.2700 – a local resistance zone.
✅ Target 2: $0.3167 – a level where a pullback is likely.
✅ Target 3: $0.3800 – a key resistance, breaking which could change the overall trend.
📢 A long entry is only valid if price holds above $0.2400.
Reversal confirmation requires an increase in volume and stability above $0.2500.
📢 As long as the price is below $0.2300 – long positions remain risky.
Conclusion : Critical Moment! Be Ready for a Sharp Move!
📌 BYBIT:AIXBTUSDT.P is at a make-or-break level – any move could lead to an explosive price shift.
📌 Sellers remain in control, but if $0.2300 holds, an unexpected rebound could happen.
📌 Short remains the main scenario, unless price successfully stabilizes above $0.2400.
🚀 Get ready for a major move! Watch $0.2206 closely – this level will determine BYBIT:AIXBTUSDT.P is next direction! 🔥

GBPNOK - Watching Key Support for a Potential Bullish ReversalFOREXCOM:GBPNOK is approaching a key support zone that has previously acted as a strong support for bullish reversals. With the current bearish momentum bringing price into this zone again, it presents a potential buying opportunity if buyers step in.
Signs of bullish strength, including rejection wicks, bullish engulfing patterns, or increased buying pressure, could indicate that buyers are gaining control and a reversal is incoming.
I anticipate a move toward at least 14.040 if this momentum sustains.
However, if the price breaks below this level, the bullish bias would be invalidated, potentially leading to further downside.
Patience is key—waiting for confirmation of buyer strength can help refine entries.

#BILLYUSDT remains in a downtrend signal📉 SHORT BYBIT:BILLYUSDT.P from $0.0036300
🛡 Stop Loss: $0.0036860
⏱ 1H Timeframe
✅ Overview:
➡️ BYBIT:BILLYUSDT.P continues its downward trend, testing the $0.0036300 level as a potential short entry point.
➡️ POC (Point of Control) at $0.0040257 indicates the highest liquidity zone, located significantly above the current price, confirming seller dominance.
➡️ The price failed to hold above $0.0038700, reinforcing the bearish scenario.
➡️ If the price breaks below $0.0036300, a further decline towards the target levels is likely.
⚡ Plan:
➡️ Enter short below $0.0036300, confirming further downside movement.
➡️ Risk management via Stop-Loss at $0.0036860, placed above the nearest resistance.
➡️ Primary downside targets:
🎯 TP Targets:
💎 TP1: $0.0034890
🔥 TP2: $0.0033642
🚀 BYBIT:BILLYUSDT.P remains in a downtrend — expecting further decline!
📢 BYBIT:BILLYUSDT.P is under strong selling pressure with no signs of buyer recovery.
📢 If $0.0036300 breaks with increasing volume, a move towards $0.0034890 – $0.0033642 becomes more likely.
📢 However, if the price rebounds above $0.0036860, the scenario may change.

#TRBUSDT remains bullish📈 LONG BYBIT:TRBUSDT.P from $38.35
🛡 Stop Loss: $38.00
⏱ 1H Timeframe
✅ Overview:
➡️ BYBIT:TRBUSDT.P is in a strong uptrend, breaking the key $38.35 resistance level.
➡️ POC (Point of Control) at $34.47 indicates the highest liquidity zone far below the current price, confirming strong buyer support.
➡️ The price has broken through the $38.30 area and is consolidating above, opening potential upside toward $39.30.
➡️ If the price holds above $38.35, bulls may continue pushing towards target levels.
⚡ Plan:
➡️ Enter long after confirmation above $38.35, signaling a bullish continuation.
➡️ Risk management via Stop-Loss at $38.00, placed below the support zone.
➡️ Primary upside targets:
🎯 TP Targets:
💎 TP1: $38.90
🔥 TP2: $39.30
🚀 BYBIT:TRBUSDT.P remains bullish—expecting further upside!
📢 BYBIT:TRBUSDT.P shows strong buying momentum, breaking key resistance levels.
📢 If $38.35 holds as support, the probability of reaching $39.30 increases.
📢 However, if the price drops below $38.00, a pullback to lower levels may occur.

CHFJPY - Potential Buying Opportunity to 168.700OANDA:CHFJPY is currently approaching a critical demand zone and as the market has been in a strong downtrend, everyone’s watching to see if buyers will step in and turn things around.
That particular demand zone has previously acted as a strong support level and now as price tests this area again, the question is whether support will hold or if sellers will push through to lower levels.
If support holds, I anticipate a move toward 168.700, where price could encounter resistance.
However, the market rarely moves in a straight line. If buyers can’t hold this demand zone, we could see price break lower, leading to further downside and possibility for a continuation of the bearish trend. For now, let's see how price reacts at this key zone—will it be a turning point, or will sellers remain in control?

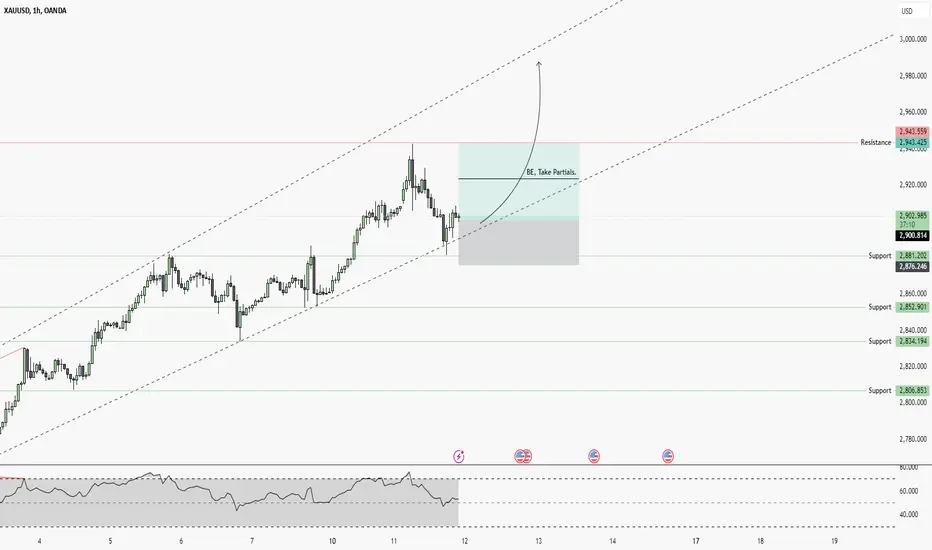
XAUUSD - Technical Analysis [Long Setup]🔹 XAUUSD Analysis on 1H chart
- The current Trend is BULLISH
- There is no divergences
- Continuation pattern is present which is bullish flag
🔹 Trade Plan For 1HR
- Entry Level = 20386.3
- Stop Loss = 20312.7
- TP1 = 20458.6
🔹 Risk Management
- First TP is 1:1
- Second TP 1:2
- BE @ TP1
🔹 How to Take Trade?
- Only risk 1% of your portfolio
Like and subscribe to never miss a new idea! ✌🏼
Bitcoin’s Price Squeeze—What’s Next?Bitcoin (BTC) is currently consolidating within a marked accumulation zone after facing resistance near its all-time high (ATH). The price is fluctuating within a broad range of approximately $17,800, indicating a phase of indecision between buyers and sellers.
The key observation is that a previous resistance trendline has now flipped into support, showing a potential shift in market sentiment. Additionally, the 100-day EMA around $93,458 is providing dynamic support, reinforcing this bullish structure.
The key support zone (highlighted in green) remains critical; as long as BTC holds above this area, the bias leans bullish. A breakout above the accumulation range could trigger a strong upward move, potentially retesting the ATH. Conversely, if BTC loses the support of both the trendline and the 100 EMA, it may lead to a deeper correction toward lower support levels.

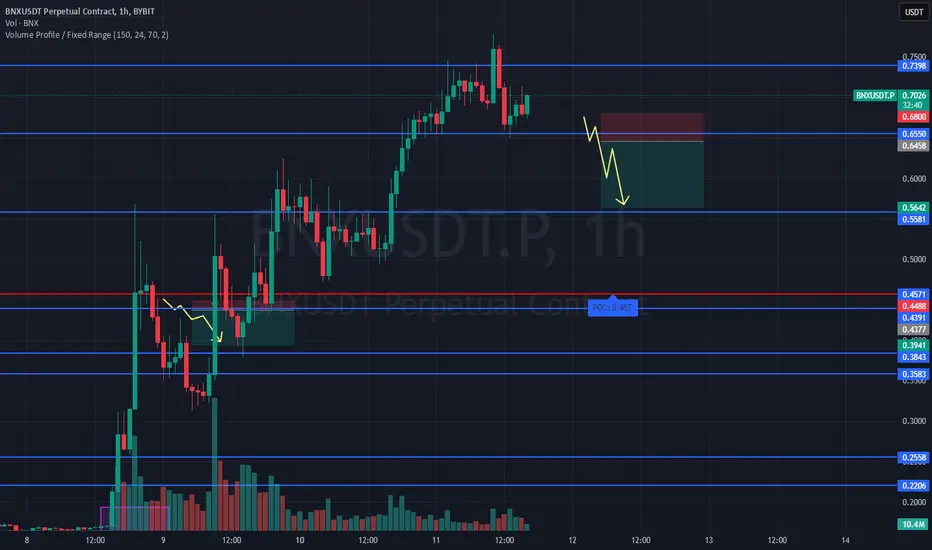
#BNXUSDT is weakening expecting a drop📉 SHORT BYBIT:BNXUSDT.P from $0.6458
🛡 Stop Loss: $0.6800
⏱ 1H Timeframe
✅ Overview:
➡️ BYBIT:BNXUSDT.P is near resistance at $0.6853, showing signs of weakness.
➡️ A pullback is expected after failing to hold above $0.6550.
➡️ Targeting support levels at $0.6060 → $0.5642.
⚡ Plan:
✅ Bearish scenario confirmation – price needs to break $0.6550 and stay below it. If confirmed, the short position remains valid.
✅ Critical resistance level – $0.6853. If the price moves above $0.6800, the trend may shift bullish, invalidating the setup.
✅ Volume analysis shows weakening buying interest, supporting the possibility of a correction.
✅ Profit-taking zones – $0.6060 → $0.5642. If price slows down around $0.6060, a bounce is possible, so partial profit-taking is recommended.
✅ Alternative scenario – if price bounces from $0.6060, a long position with a tight stop could be considered.
📍 Take Profit targets:
🎯 TP1: $0.6060 – testing the nearest support level.
💎 TP2: $0.5642 – deeper correction zone.
🚀 BYBIT:BNXUSDT.P is weakening — expecting a drop to $0.5642!
📢 A break below $0.6550 confirms the bearish scenario.
📢 Holding below this level strengthens the case for further decline.
📢 If price surges above $0.6800, the setup is invalidated.
GOLD Builds Strength in Ascending Channel, next at 2,920?OANDA:XAUUSD remains within a well-defined ascending channel. This suggests a continuation of the uptrend, with the next target near 2,920, aligning with the upper boundary of the channel.
A short-term pullback could present a buying opportunity, particularly if bullish candlestick patterns like an engulfing candle pattern appears, confirming buyer strength. A decisive move above recent highs could reinforce momentum toward the expected target.
But if we get a break below the channel’s lower boundary, it would invalidate the bullish outlook and signal a potential shift in market direction.
Just my take on support and resistance zones—not financial advice. Always confirm your setups and trade with solid risk management!

Tata motor at golden Fib ratio Tata motor at golden Fib ratio
Disclaimer :-
This is only for the knowledge purpose don't take it as a buy or sell recommendation do your own analysis before dealing in securities

USDCAD on 1h time frame . Testing historical Resistance levelsUSDCAD 1H Analysis – February 10, 2025
📈 Potential Bullish Reversal
The chart shows a double bottom formation near 1.4280, which is a strong bullish reversal pattern.
Price has bounced from this level, suggesting a possible upward move.
📊 Key Resistance Zones to Watch:
1.4550 - 1.4570 → First key resistance (previous support turned resistance).
1.4780 - 1.4800 → Major resistance area where price previously rejected strongly.
🔍 Trading Outlook:
A break above 1.4350 could confirm the bullish momentum.
If price clears 1.4550, the next target would be 1.4800.
A rejection from resistance zones could lead to another decline.
📌 Conclusion: USDCAD is forming a potential bullish structure, but confirmation of a breakout above 1.4550 is needed before expecting further upside. 🚀

EURJPY LongEuro Yen Analysis
The pair is on a strong support line and on a fibonacci level; its expected to bounce back and be in the triangle shape it formed.
What are your technical and fundamental analysis on this pair?

Will the market turn bullish or bearish after this Pin Bar?Channel breakout and surpassing the price of 0.33397, followed by a corrective move in Dogecoin based on the analysis on January 27 and a correction down to 0.20145.
After a corrective move and the formation of a Pin Bar candle, if a bullish move forms at 50% of the Pin Bar’s shadow, we can expect a rise up to 0.30695. Otherwise, the current movement will continue.

#POPCATUSDT Expecting further bullish continuation📈 LONG BYBIT:POPCATUSDT.P from $0.2850
🛡 Stop Loss: $0.2760
⏱ 1H Timeframe
✅ Overview:
➡️ BYBIT:POPCATUSDT.P is showing strong bullish movement, breaking above key resistance at $0.2778, confirming buying interest.
➡️ The $0.2778 - $0.2850 zone now acts as a support, and if the price holds above it, further upside is likely.
➡️ The first major resistance level is at $0.2900, followed by $0.2989 and $0.3100 if the momentum continues.
➡️ Volume remains high, indicating strong liquidity and potential for further growth.
⚡ Plan:
➡️ Enter LONG after confirming a breakout above $0.2850, reinforcing bullish momentum.
➡️ Risk management with Stop-Loss at $0.2760, below key support.
➡️ Key upside targets:
🎯 TP Targets:
💎 TP1: $0.2900 — first take-profit level.
🔥 TP2: $0.2989 — potential resistance.
⚡ TP3: $0.3100 — major upside target.
🚀 BYBIT:POPCATUSDT.P - Expecting further bullish continuation!
━━━━━━━━━━━━━━━━━━━━━━
📢 BYBIT:POPCATUSDT.P is maintaining bullish momentum, and a breakout above $0.2850 could confirm further upside movement.
📢 Watch for price action at $0.2900, as this level might act as short-term resistance.
📢 If the price holds above $0.2989, a strong push towards $0.3100 is possible. However, a drop below $0.2760 would invalidate the bullish setup.

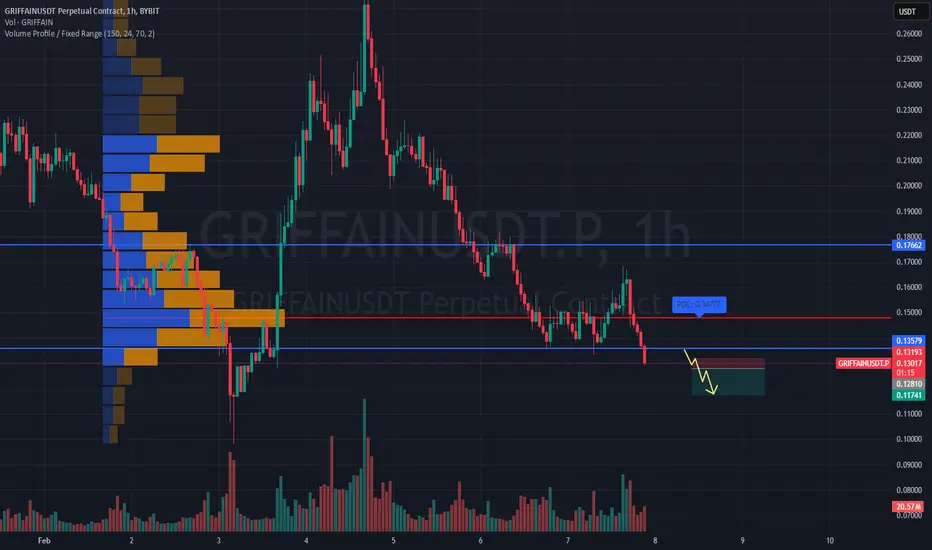
SHORT #GRIFFAINUSDT expecting further downside📉 SHORT BYBIT:GRIFFAINUSDT.P from $0.12810
🛡 Stop loss $0.13193
⏱ Timeframe: 1H
✅ Overview:
➡️ BYBIT:GRIFFAINUSDT.P is showing weakness after reaching a local high, rejecting from a resistance zone.
➡️ POC (Point of Control) at 0.13193 acts as a key volume area with significant trading activity.
➡️ Price action suggests seller dominance, indicating a potential continuation of the downtrend.
➡️ If the 0.12810 support level breaks, expect an increase in bearish momentum.
⚡ Plan:
➡️ Short entry upon confirmation of a breakdown below 0.12810.
➡️ Increased selling volume will confirm the continuation of the bearish trend.
➡️ Holding the position with dynamic monitoring until the first Take Profit level.
🎯 TP Targets:
💎 TP 1: 0.11741 – first target based on the nearest support level.
📢 BYBIT:GRIFFAINUSDT.P is showing bearish signs, but volume and pullback dynamics should be monitored.
📢 A break below 0.12810 could trigger a deeper decline.
📢 If buyers show strength, watch 0.13193 as a possible reversal point.
🚀 BYBIT:GRIFFAINUSDT.P maintains bearish momentum — expecting further downside!
#1000PEPEUSDT expecting further decline!📉 SHORT BYBIT:1000PEPEUSDT.P from $0.009650
🛡 Stop Loss: $0.009875
⏱ 1H Timeframe
📍 Overview :
➡️ BYBIT:1000PEPEUSDT.P remains under selling pressure after failing to sustain an upward move. The price is trading below the key POC $0.010072 , which previously served as a high-liquidity zone.
➡️ The recent breakdown of $0.009815 , followed by a retest as resistance, confirms the bearish scenario.
➡️ If the asset holds below $0.009650 , this could trigger a move toward $0.009242, where buying interest was previously observed.
➡️ Current price action shows weakness in buyers as volume does not support an upward breakout.
⚡ Plan :
➡️ Enter short once a firm breakdown below $0.009650 is confirmed.
➡️ Risk management through Stop-Loss at $0.009875 , positioned above the nearest resistance zone.
➡️ The main downside target is $0.009242 , where profit-taking and a possible bounce could occur.
🎯 TP Targets:
💎 TP 1: $0.009242
📢 BYBIT:1000PEPEUSDT.P is showing signs of further downside, with no strong buying reaction at the moment.
📢 The $0.009242 level should be closely monitored as a potential support zone. If weakness persists, breaking this level could accelerate downward pressure.
📢 For those holding long positions, caution is advised when facing repeated resistance retests.
🚀 BYBIT:1000PEPEUSDT.P continues to show weakness — expecting further decline!

RGTI: both ways potential Chart on the daily looks like being in no-mans is about to decide of its further direction.
I have two main alternatives:
1. If price moves above Jan 24th highs the road is opened to following resistance zone: 20-25, 28-33 and a push towards ideal macro-resistance target at 37-45 levels;
2. If price break down bellow Feb 3rd lows, odds are moving in favour of one potential leg down to potentially test 4-3 macro support levels.
Weekly macro view:
Thank you for your attention!

Bulls and Bears zone for 02-05-2025 All this week markets have been very volatile.
During ETH session traders are testing yesterday's Low.
Level to watch: 6046 ---6044

TOTAL DAILY The flash crash of Monday took TOTAL all the way down under the previous cycles high and tapped the 1D 200 EMA before reacting well to move price between the DAILY RESISTANCE & SUPPORT.
For me I still think crypto has space to grow, seasonality tells us the first quarter of a bullrun year is great in terms of returns with a tail off in Q2-3, coupled with the US administration being pro crypto and the looming strategic reserve getting closer, ETFs relentlessly buying Bitcoin, same with MicroStrategy.
The two entry options for me are when the wick gets filled and a reclaims the '21 ATH once again, that would sweep the demand zone and take out a lot of stop losses before targeting the DAILY RESISTANCE and the HIGHS.
Another entry would have to be a reclaim of the DAILY RESISTANCE, I would be worried that the wick still needs filling but maybe it would be during the bear market. For that reason a close SL would be useful.

GBPAUD new bearish expecting here
OANDA:GBPAUD strong bearish in last periods, currently price in zone, its bounce 4-5 times on SUP zone, looks like DIAMOND pattern here is created, based on past for me still here having enough bearish volumen gathered for one more push.
SUP zone:1.97800
RES zone: 1.95000, 1.94500, 1.93900
