GBPCAD bearish for expect
OANDA:GBPCAD last 4 ideas on this pair attached, we are have one strong fall, price is make few pushes on sup zone (violet doted), which taking for legal zone, currently price in ASCENDING TRIANGL better visible on 15TF (will make in note), expecting break of same and higher bearish continuation.
SUP zone: 1.85750
RES zone: 1.84500
Supportandresistancezones


EURUSD bearish push expected
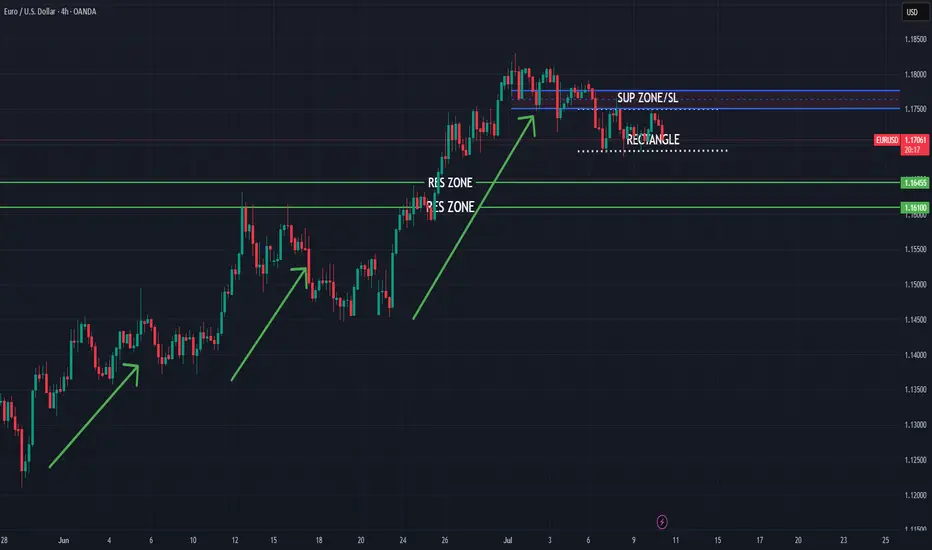
FX:EURUSD trend based analysis, few bullish pushes we are have in last periods, currently expecting from here short bearish push.
SUP zone: 1.17500
RES zone: 1.16450, 1.16100
EURAUD higher bearish for expect
OANDA:EURAUD bullish trend nearly last two months.
Good structure visible, we have breaked trend line, sup zone (1.79100) breaked and DESCENDINGING TRIANGL is breaked, we are have and RBA and RBNZ in last days.
EUR looks like is start losing power and like cant more pushing, from here expectations are for more bearish.
SUP zone: 1.79500
RES zone: 177500, 177000

EURUSD Eyes Key Levels Ahead of DataFOREXCOM:EURUSD
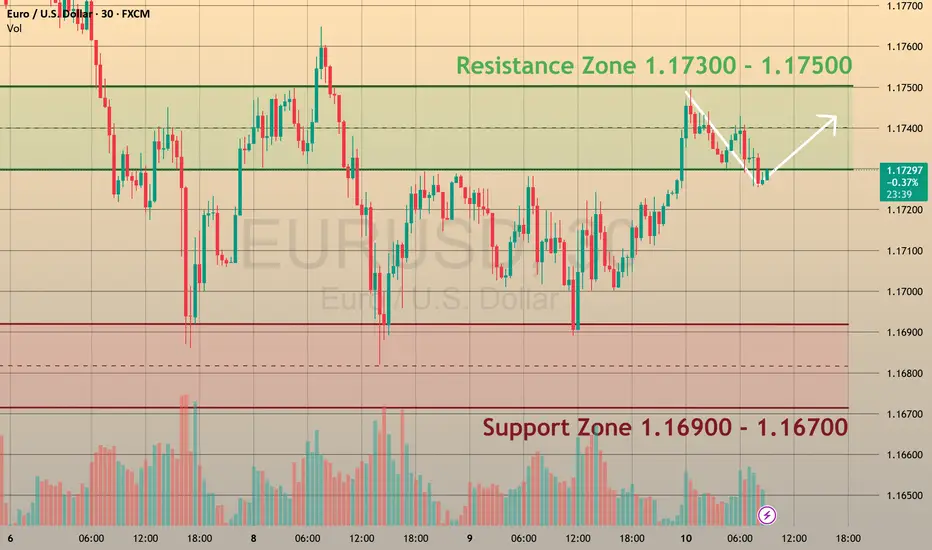
EURUSD is trading within the 1.1680 – 1.1810 range 📊, continuing its upward momentum during the Asian and early European sessions 🌏⬆️.
⚡️ Markets are now focusing on potential trade negotiations with India and the EU 🤝, which could shape near-term currency moves and risk sentiment 🌐.
📈 Today at 12:30 p.m. UTC 🕧, the U.S. Jobless Claims report 📑 may trigger volatility across all USD pairs ⚠️. Stronger-than-expected data could delay Fed rate cuts 🕰️🔻 and push EURUSD below 1.1700 🩻, while weaker figures may weigh on the U.S. dollar 💵⬇️ and lift EURUSD above 1.1800 🚀.
👀 We will monitor these levels closely for potential breakout opportunities. Stay tuned for live updates!
Gold Extends Gains Amid Uncertainty FOREXCOM:XAUUSD
XAUUSD is currently moving within the $3,270 – $3,360 range 📈, holding steady under buying pressure over the last few hours ⏳.
🌏 During today’s Asian and early European sessions, gold climbed to around $3,330 🥇, extending gains as investors monitored trade tensions and absorbed the latest FOMC Minutes 🗂️. A weaker U.S. dollar 💵⬇️ continues to support gold, attracting safe-haven flows 🛡️ amid ongoing market uncertainty.
📊 Meanwhile, the Fed’s June meeting minutes 🪙 revealed disagreements among officials 🤔 on the timing and scale of potential rate cuts 🔻. While most anticipate some easing later this year, views range from cuts as early as July to no cuts until year-end. The Fed maintains a cautious, data-driven approach 🧭, citing tariff-related inflation risks, slowing consumer spending, and a strong labour market as key factors for their policy outlook.
👀 We will continue to monitor gold closely for potential breakout or reversal signals within this range. Stay tuned for updates!

USDJPY still bullish to expect
FX:USDJPY strong bullish push, expectations are still bullish to see, currently we can see price is break ASCENDING TRIANGLE, JPY still looks the weakest, dont see changes, here still bull to expect.
SUP zone: 146.000
RES zone: 147.700

Is the Trend Intact? Key Signal Emerging on GER40 4H ChartHey Guys,
We could see a pullback on the GER40 index from the 24,060 level. If that happens, the 23,824 – 23,675 zone could present a potential buying opportunity. The primary trend still points upward, and bullish momentum remains intact.
Also worth noting—the rise in volume is quite striking, which supports my target level of 24,500.
I meticulously prepare these analyses for you, and I sincerely appreciate your support through likes. Every like from you is my biggest motivation to continue sharing my analyses.
I’m truly grateful for each of you—love to all my followers💙💙💙

$CROUSDT Just Broke Out, Is a 130% Pump Coming?GETTEX:CRO has broken out above a long-term descending trendline and reclaimed the 100-day moving average, a bullish signal.
If it holds above this zone, the next targets are $0.1079, $0.1498, and potentially $0.2155, offering up to 132% upside.
Watch for a successful retest to confirm momentum.
DYOR, NFA

$AVA/USDT is Heating Up Are We About to See a Big Move?NYSE:AVA is testing a key descending trendline on the 6H chart.
A breakout above this level could trigger strong upside momentum.
Immediate targets are $0.5605, $0.6237, and $0.6776 with the potential to reach $0.7690.
I'm watching for breakout confirmation.
DYOR, NFA.

GBPUSD - 2 potential selling opportunitiesLooking at GBPUSD
We have 2 potential selling POI's.
The first one being a point in which we will need to sit on our hands for a little bit to see what price does at there is no inducement in the push down in the impulse leg. With that being the case we will need to see some sort of inducement built before we enter that POI
IF we clear the first POI I think I will take a more aggressive entry on the secondary POI that sits a little bit higher. This is due to us having already put in some sort of liquidity in and around that POI before pushing lower.
Will wait and see what happens.
Tomorrow could be a very good trading day

$BTC/USDT Eyes $121KCRYPTOCAP:BTC has broken out of the descending wedge and is holding above key support around $106K.
The structure looks bullish with a potential move toward $121K (+11.24%).
As long as the price stays above the breakout zone, momentum favors the bulls.
DYOR, NFA

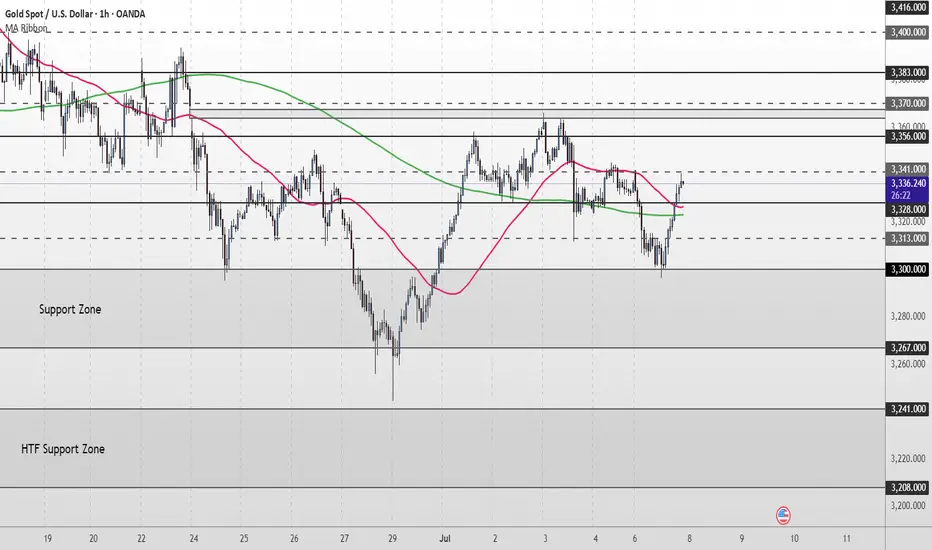
Gold Short Term OutlookGold dipped earlier in the session as the $3,328 support level failed, pushing price into the upper boundary of the broader Support Zone. From there, we’ve seen a strong bounce, with price now trending around the $3,341 minor resistance.
Price has reclaimed both the 50MA and 200MA, suggesting bullish momentum may be returning. A clean break and hold above $3,356 would likely open the path toward higher resistance levels, including $3,370 and $3,383.
However, failure to break and hold above $3,356 could lead to another pullback toward the Support Zone. If that zone fails to hold, we may see a deeper move into the higher timeframe (HTF) support area below $3,300.
📌 Key Levels to watch:
Resistance:
$3,356 ‣ $3,383 ‣ $3,400 ‣ $3,416
Support:
$3,328 ‣ $3,300 ‣ $3,267 ‣ $3,241 ‣ $3,208 (HTF Support)
EURCHF bullish push expecting
OANDA:EURCHF price u PAu, currently looks like its on good, valid sup zone.
From here expecting bullish push
SUP zone: 0.93400
RES zone: 0.93950, 0.94100

GBPJPY sitting at resistance – Is a drop to 193.360 likely?GBPJPY is sitting right at a key daily resistance zone. This is a level where it has struggled to break through and reversed strongly to the downside. So this makes it definitely one to monitor, especially if you’re eyeing potential short setups.
If we start seeing signs that the price is getting rejected here: like long wicks, strong bearish candles, it could be the early indication of another move lower. My focus is on a moderate drop toward the 193.360 area, similar to what we’ve seen in past pullbacks. Nothing too dramatic, just a simple downside play if sellers step in again.
But if we get a strong breakout? That changes everything: it would hint that bulls are taking full control. This area is pretty important and could give us a better idea of where price is headed next.
Just sharing my thoughts on support and resistance, this isn’t financial advice. Always confirm your setups and manage your risk properly.
Disclosure: I am part of Trade Nation's Influencer program and receive a monthly fee for using their TradingView charts in my analysis.

AUDJPY bullish continuation for expect
OANDA:AUDJPY we are have strong bullish push from 22.April, price is start reversing from 14.5., currently how looks price is find ground on strong zone 92.100, based on PA what can see we will have strong bullish push here.
SUP zone: 92.550
RES zone: 95.500, 96.300

AUDNZD still bullish here
OANDA:AUDNZD second analysis on this pair. We have strong zones visible/created, DESCENDING CHANNEL breaked, from first analysis bullish here and still for new week bullish view having.
SUP zone: 1.08000
RES zone: 1.08850, 1.09250

NVDA Support and Resistance Lines Valid from July 1 to 31st 2025Overview:
These purple lines act as Support and resistance lines when the price moves into these lines from the bottom or the top direction. Based on the direction of the price movement, one can take long or short entries.
Trading Timeframes
I usually use 30min candlesticks to swing trade options by holding 2-3 days max. Anyone can also use 3hr or 4hrs to do 2 weeks max swing trades for massive up or down movements.
I post these 1st week of every month and they are valid till the end of the month.

OIL: Sideways - Waiting for R2/S2 BreakoutsOil has been in a clear sideways consolidation for several days, reflecting a period of indecision in the market. While this tight range holds, a patient approach to trading is warranted. A long position will be considered if a confirmed breakout and sustained price action above R2 occur, indicating strong bullish momentum. Conversely, if oil breaks down and holds below S2, a short position will be initiated, anticipating further bearish movement. This current consolidation phase suggests a significant directional move is likely imminent, and observation of these key resistance and support levels will be crucial for entry signals.

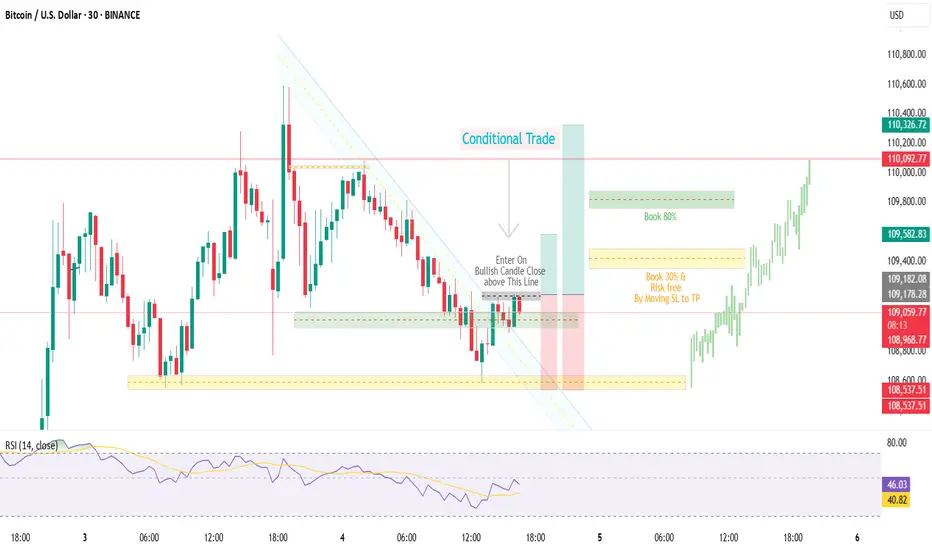
BTCUSD BTCUSD | Quiet Market Play Conditional | Trade Based On Candle Closure
After a sharp impulsive move, price is now in consolidation.
Currently entering a long position after support And trenline confirmation
Trade includes full risk management, marked on chart.🟢📈
OIL fell sharply, opportunity for upside target of 70$OIL fell sharply and has now been in a contraction for a while, I am taking it into account for a potential breakout, as it shows tightening price action, which reflects market indecision.
Price action has now coiled into a symmetrical triangle, this is often a classic continuation or reversal pattern, and it’s building pressure for a potential breakout. So, if we do get a clean breakout above this pattern, with strong bullish candles, volume, or bullish divergence, that’s your confirmation cue.
This is totally achievable. It aligns beautifully with the 0.25 to 0.5 Fibonacci retracement zone from the recent swing high to low. It’s not just a psychological round number, it’s technically supported.
If the lower boundary of the triangle is broken with momentum, you’ve got to step back. No trade is better than a bad one. Watch how price interacts with the zone. If it loses it, you could be looking at a deeper leg down, potentially revisiting deeper support levels from prior bullish structure.

Gold Short Term OutlookIn yesterday’s analysis, we highlighted that the $3,327–$3,328 support zone needed to hold for bulls to maintain momentum. Price respected that level, bouncing off intraday support and is now attempting a recovery.
Currently, the 50MA is acting as dynamic resistance, and we need to see a clean break above the $3,352–$3,356 resistance zone for bulls to challenge higher levels.
However, if price fails to break above this resistance cluster, we may see a pullback toward the $3,327 support once again. A break below that would likely expose price to a deeper retracement toward $3,298.
📌 Key Resistance:
‣ $3,352
‣ $3,356
‣ $3,364
‣ $3,383
📌 Key Support:
‣ $3,328
‣ $3,298
‣ $3,270
🧠 Fundamental Focus:
With U.S. markets partially closed today, expect low liquidity and increased volatility.

GBPCAD higher fall expecting
OANDA:GBPCAD strong bearish fall we are have, price currently on sup zone, expecting break of same and higher bearish here.
SUP zone: 1.85600
RES zone: 1.84000
