TOTALCAP — The Next Trillion Crypto Move: Are You Ready?When people analyse the crypto market, they often default to Bitcoin and for good reason. It’s the one and only, the king. But sometimes, to see the forest instead of just the tree, you need to zoom out and study the broader picture.
That’s where the Crypto Total Market Cap (TOTALCAP) chart comes in. It’s essentially the mirror of Bitcoin, but it offers powerful macro insight — not just price, but scale. Looking at trillions instead of dollars changes how you frame support, resistance, and overall sentiment. Let’s dive in.
🧠 Why TOTALCAP Matters
TOTALCAP aggregates the value of every coin and token — the complete valuation of the entire crypto industry.
And while it often moves in sync with Bitcoin, it carries a different weight.
Shows the “big picture” of institutional and retail money flow
Offers clearly defined round-number zones (Trillions) as psychological S/R
Removes coin-specific anomalies and focuses on collective momentum
In bull and bear markets, these trillion-dollar thresholds act like major checkpoints. Watching how TOTALCAP interacts with these levels can give early signals that BTC or alts alone can’t.
Historical Key Levels & Structure
Let’s break it down by macro phases:
✅ November 2021 — Peak of Last Bull Market:
TOTALCAP peaked exactly at $3 Trillion.
This level acted as a ceiling — once hit, the market reversed sharply.
This marked the top of the 5-wave impulsive move (Elliott Wave theory).
📉 November 2022 — Bear Market Bottom:
TOTALCAP dropped below $1 Trillion, bottoming at $727 Billion.
This was almost a 0.786 fib retracement from peak — similar to BTC’s historical retracements.
The $1T mark was retested as resistance before being reclaimed as support.
📈 2023–2025 — The Bull Awakens:
$1 Trillion flipped into solid support throughout 2023.
A clear sign the macro market structure had shifted bullish.
Once $2T was breached, things moved fast.
🚀 Current State:
The market surged above the previous $3T ceiling.
TOTALCAP has hit a new ATH: $3.73 Trillion
Now, the question is: Is this the start of a new leg higher, or a bull trap before a correction?
🔍 Fibonacci Confluences — Why $3.7T Was Key
The sharp rejection at $3.7T wasn’t random. It aligns with:
1.0 Trend-Based Fib Extension: From 91.24B → 3T high → 727B low = 1.0 = 3.65T ✅ precise hit
1.272 Fib Extension of the macro move
Upper Pitchfork Resistance
Channel Top Rejection
→ All signals converged to mark that level as major resistance
🌀 Elliott Wave Macro Count
Looking at the weekly timeframe, we can see a clear impulsive 5-wave movement from the 2022 lows:
Wave 1: $727B → $1.26T
Wave 2: Correction to $975B ($1T) (support confirmed)
Wave 3: Massive rally toward $2.72T
Wave 4: Pullback toward $1.69T (VWAP retest)
Wave 5: $3.73T ATH
What does this imply?
According to classical Elliott Wave theory, after a full 5-wave move, the market tends to enter an corrective phase.
🔍 Some key levels to watch:
$3T: Historical S/R (was the 2021 top, now acting as a key level)
$2.31T: Recent swing low
$2T: Psychological and structural support
📌 Zone of Interest for Longs: $2.31T–$2T
This zone holds:
Previous consolidation zone from mid-2024
Fib retracement confluence
Likely forming Wave C bottom if this is a full ABC
🎯 Upside Targets — What If We Continue Higher?
Looking ahead:
🔸 1.618–1.666 Fib Extension = $4.42T–$4.53T
🔸 1.618 TBFE from previous cycle = ~$5.45T
📌 Rounded Targets: $4.5T, $5T and $5.5T
These are the next likely macro cycle targets — but only after a healthy correction and consolidation.
☀️ Macro Context & Summer Seasonality
Historically, summer tends to be a weaker period:
Lower volume
Institutional rebalancing
Geopolitical and macroeconomic uncertainty
📚 Educational Insight: TOTALCAP as a Tool
Treat TOTALCAP like the S&P500 of crypto.
Use round trillions as psychological levels: 1T, 2T, 3T, etc.
Always check if BTC’s price is aligned with where TOTALCAP is on the macro structure
Helps judge market strength even when BTC dominance is shifting
It’s especially useful when altcoins pump or dump out of sync with BTC — you can use TOTALCAP to track the real flow of money.
💡 Final Thoughts
We are likely in a corrective phase after a complete 5-wave cycle.
The area between $2.31T and $2T offers high-probability long entries
Watching how TOTALCAP reacts to these levels will help us anticipate the broader market’s next move
Summer slowdown could mean chop — but this also creates opportunities
💬 Let me know your thoughts: Are we entering a deeper correction? Or will TOTALCAP surprise us with a new leg higher?
Don’t forget to zoom out. The charts always tell the story.
_________________________________
💬 If you found this helpful, drop a like and comment!
Want breakdowns of other charts? Leave your requests below.
Supportandresistancezones

GBPUSD - Next point of interestAfternoon All,
So our GBPUSD trade from earlier didn't quite go to plan however I knew full well that we were building liquidity to the left on the higher timeframe.
This will be my next point of interest for a potential long.
Lets see how price plays out when we get down there.
GBPUSD - LongUnfortunately I can't post the idea on the 5min to give you a better idea of where we are at in terms of the entry for this.
However I am looking to be tagged into this trade and have a limit order where I have set it.
Hoping to be tagged in. If we aren't we move on. and if we lose we move on.
If im able to help with any questions you may have do send them my way

GBPUSD - LONG Looking at GBPUSD
We have a great set up occurring on the 5min timeframe for a potential long.
We will see how it plays out and will do an update video on this later.

NZDUSD - Trade Re-cap Take a look at the NZDUSD trade re-cap.
Here I explain exactly what I was looking for in getting this 1:10RR trade from start to finish.
Hope this helps

CADCHF new view, still bullish expectations
OANDA:CADCHF first analysis till TP1 (attached), having thoughts we are not see to much here and expecting higher bullish push than in previous analysis.
We are have break of zone, price is start pushing, at end its revers on first res zone (0.60600), in meantime DESCENDING CHANNEL is be created, on 22.Jun is be breaked, currently price is break and ASCENDING TRIANGL.
SUP zone: 0.59600
RES zone: 0.60800, 0.61200

Positive market: OIL rises sharply - Important area to watch forThe recent escalation of tensions in the Middle East has had a strong ripple effect across all commodities market. Just as we observed with Gold, it’s no surprise we’ve seen oil prices climb as well, given this uncertainty.
If you’ve seen my latest Gold analysis, you’ll understand how market sentiment has turned uneasy, and in times like these are what people trust when everything else feels risky. And naturally, with everything going on, Gold is seeing stronger demand again, and I expect the price to steadily climb and reach new highs because the momentum is unmistakable.
On Friday the 13th, oil prices spiked abruptly before pulling back slightly, showing just how sensitive the market is to potential supply disruptions. What’s fueling this rally is obvious, and it’s the fear around supply from such an important oil-producing area. This creates a great opportunity to take a position.
As you can see in my analysis, the price has recently broken above a key resistance zone and may come back for a retest. If this level holds as support, it would really confirm the bullish bias and make the move towards my anticipated target of 77,50 high probability, towards the next resistance zone level at 77,50 and 79,50.
If the price remains over this support zone, my bullish outlook stays the same. But, if it doesn’t hold above this level we could see a slight pullback before another definitve move up.
In such times, it’s important to watch price action closely especially near key technical levels, and let the market show your next move.

META June 2025 Monthly Support & Resistance Lines Valid till EOMOverview:
The purple lines serve as support and resistance levels for META stock throughout the month of June. When the price approaches these lines from either the bottom or the top, I will consider taking long or short positions in META stock, depending on the direction of the price movement.
Trading Timeframes
I usually use 30-minute candlesticks to swing trade options by holding 2-3 days max. Some can also use 3hr or 4hrs to do 2 weeks max swing trades for massive up or down movements.
I post these 1st week of every month and they are valid till the end of the month.

TSLA June 2025 Monthly Support & Resistance Lines Valid till EOMOverview:
The purple lines serve as support and resistance levels for TSLA stock throughout the month of June. When the price approaches these lines from either the bottom or the top, I will consider taking long or short positions in TSLA stock, depending on the direction of the price movement.
Trading Timeframes
I usually use 30min candlesticks to swing trade options by holding 2-3 days max. Some can also use 3hr or 4hrs to do 2 weeks max swing trades for massive up or down movements.
I post these 1st week of every month and they are valid till the end of the month.
Extra:
I added Blue Lines which are weekly line for June 16th to 20th.

Extremely Bullish.Closed at 281.50 (05-06-2025)
Extremely Bullish.
But 289 - 290 is an Important Resistance.
Needs to cross & sustain 295 - 308 Zone for
further upside.
as mentioned in yesterday's video, 277 - 279
may act as Support.
Breaking 272 will bring more selling pressure.

Stock is in DownTrend but ..4013 CMP 254.20 (15-06-2025)
Stock is in DownTrend but it Beautifully hit Channel
Bottom & Bounced.
Currently at a Good Support level.
Now the Immediate Resistance is around 256 - 257
& then around 270.
Crossing this level & Sustaining on Monthly basis would
lead it towards 283 - 285 initially.
However, should not break 253 - 254.

VIX June 2025 Monthly Support & Resistance Lines Valid till EOMOverview:
These purple lines act as Support and resistance lines for VIX for the entire month of June, when the price moves into these lines from the bottom or the top direction. Based on the direction of the price movement, I will take long or short entries in QQQ or SPY.
Trading Timeframes
I usually use 30min candlesticks to swing trade options by holding 2-3 days max. Some can also use 3hr or 4hrs to do 2 weeks max swing trades for massive up or down movements.
I post these 1st week of every month and they are valid till the end of the month.

Profit taking on Netflix for the summer, only to buy in lowerNASDAQ:NFLX is still in a strong high time frame uptrend, I'm not saying the stock has turned bearish overall, however profits need to be taken when trading and this is one of those times.
I'd prefer to buy back in closer to $1,000 if possible though either way I'll keep 33% of my stack.

Monthly Closing above 122000 will be a +ve sign.KSE100 Closed at 122143.57 on 13-06-2025
Monthly Closing above 122000 will be a +ve sign.
However, if the Index Stays above 122700, we may
witness upside again.
Breaking 118600 would bring more selling pressure.
& then Important Support would be around 112000 - 113000
and then around 110000.

SOL (Weekly timeframe): Trend structure Price is approaching a key macro support zone. However, as long as it remains below the $148 level, I cannot rule out the possibility of one more corrective leg toward the $76–$55 range before a medium-term bottom is established and a potential resumption of the broader uptrend begins.
A breakout and sustained close above the $148 level would serve as the first technical signal that either:
- a corrective wave B (preceding a deeper correction toward the macro support zone) is unfolding, or
- a new long-term bullish trend aiming for all-time highs is beginning.
Monthly outlook:
My previous idea from November 2024 has fully realized its structure:
Thanks for reading and wishing you successful trading and investing decision!

EURUSD - Long from hereDue to having internal Breaks of Structure to the upside here I have entered a long position as it is a reasonable area to potentially get long as it is a strong area of demand.
I'm aware that there isn't much liquidity built up in and around this area before hitting the demand but its a risk im willing to take as price may just be filling the FVG from all the buying pressure that was in the market yesterday
Any questions please message

EURUSD - Current long positionVideo analysis of EURUSD
Hopefully we will get some bullish momentum however its not looking great

GBP/JPY - Triangle Breakout (12.06.2025)The GBP/JPY Pair on the M30 timeframe presents a Potential Selling Opportunity due to a recent Formation of a Triangle Breakout Pattern. This suggests a shift in momentum towards the downside in the coming hours.
Possible Short Trade:
Entry: Consider Entering A Short Position around Trendline Of The Pattern.
Target Levels:
1st Support – 194.34
2nd Support – 193.76
🎁 Please hit the like button and
🎁 Leave a comment to support for My Post !
Your likes and comments are incredibly motivating and will encourage me to share more analysis with you.
Best Regards, KABHI_TA_TRADING
Thank you.
Disclosure: I am part of Trade Nation's Influencer program and receive a monthly fee for using their TradingView charts in my analysis.

Bulls and Bears zone for 06-12-2025Overall market is continuing to rally in general.
However, market sold off during ETH session and it's trying to recover in the morning.
Level to watch : 6017----6019

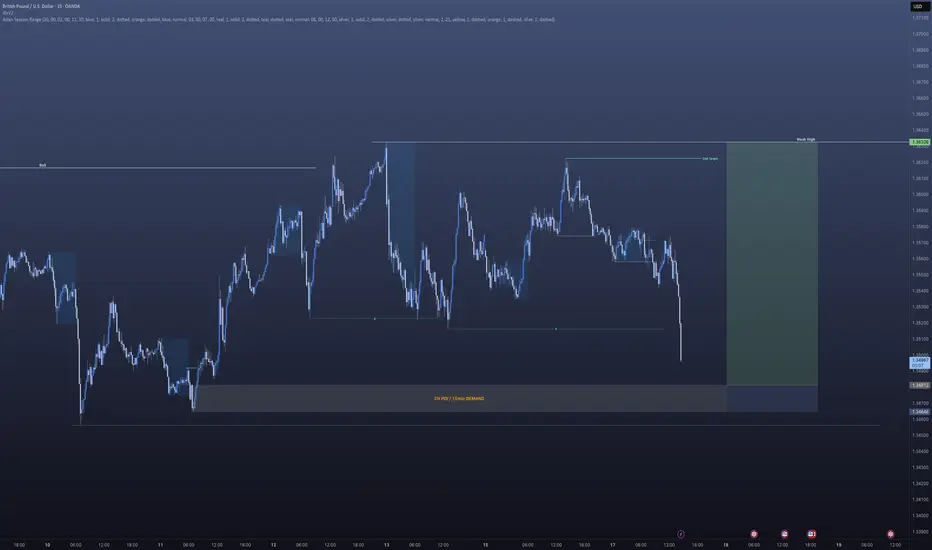
GBPUSD - Long after a structural shiftBased off of yesterdays analysis.
We can see we are fast approaching a very nice POI.
Will post below my mark up chart from yesterday so you can see below. Will now be sending most of my day on the 15min TF waiting for our structural shift to the upside.
Let's see how price plays out today.
Don't just dive into the trade. Wait for your structural shift first.
If I can offer any help please do let me know

Make it Break it Situation!FCCL Closed at 46 (25-03-2025)
Bearish Divergence is there.
Important to Sustain 45.80 at least
on Weekly basis for upside move.
Otherwise, Important Support levels seems
to be around 43.30 - 43.50 & then 41.30 - 41.50.
41.30 - 41.50 is also a Channel bottom that can
be respected.
Upside move can be up to 49 -50 initially &
Channel top is around 52.

Aggressive Trend Trade 1HAggressive Trend Trade 1H
- short trend
+ volumed T1
+ support level
+ biggest volume 2Sp+
Daily Trend
+ long impulse
+ T2 level
+ support level
+ 1/2 correction"
Monthly CounterTrend
"- short balance
+ expanding ICE
+ support level
+ unsuccessful biggest volume manipulation"
Yearly Trend
"+ long impulse
+ 1/2 correction
- below exhaustion volume?
- below SOS"
Will add more when 5M, 1H or 1D will show entry point

GBPUSD - Long at some pointVery similar with what we are looking for in relation to EURUSD
Will wait for a mitigation of the demand at lower price. Will wait for an internal structure break before looking to get long.
Will have a nice sleep now and will re-evaluate in the morning.
Caught 2 lovely trades on this today and hopefully I may be able to catch 1 or 2 more before the week is out.
Again, if you have any questions don't be shy to get in touch
