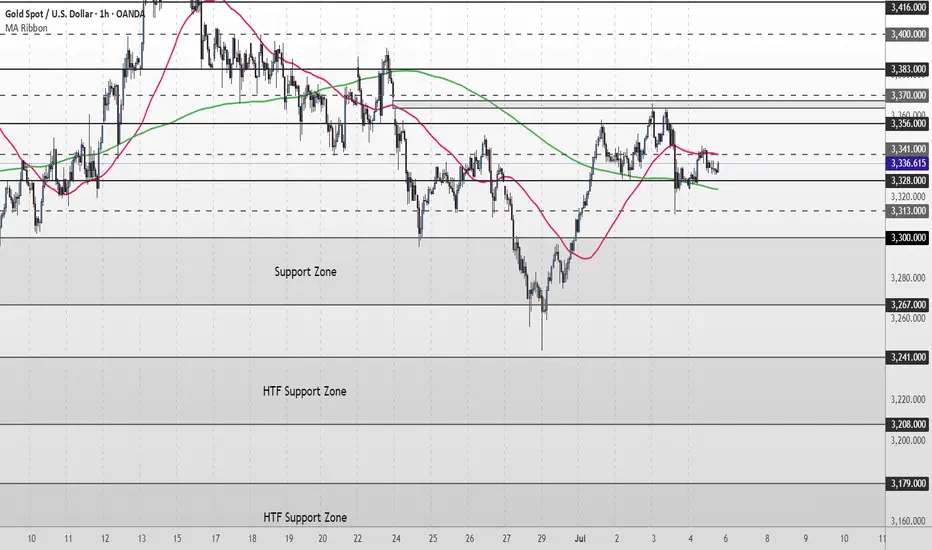
XAU/USD Weekly & Daily Outlook | What’s Next for Gold?Gold starts the new trading week still locked in a consolidation range, holding just above the $3,328–$3,327 support zone. Despite multiple attempts, price continues to struggle at the $3,356 resistance.
The 50MA and 200MA are now compressing, suggesting the market is preparing for a breakout. Until then, structure remains neutral and range-bound.
📌Key levels to watch:
Resistance:
$3,356 ‣ $3,383 ‣ $3,400 ‣ $3,416 ‣ $3,440
Support:
$3,328 ‣ $3,313‣ $3,300 ‣ $3,267 ‣ $3,241
‣ $3,208 / $3,179 – Deeper downside if bearish pressure builds
🔎 Fundamental Focus
The key risk event this week is Wednesday’s FOMC Meeting Minutes. Markets will be looking for clues on the Fed’s internal stance regarding future rate cuts and inflation expectations.
🔗 Follow for live updates and intraday chart setups.
Supportandresistence
Bitcoin MMC Analysis – Mirror Market Concepts in Action + Target📌 Overview:
In this idea, I’m using Mirror Market Concepts (MMC) to break down Bitcoin’s current price behavior. MMC is a powerful way to spot repetitive price patterns, psychological zones, and mirrored moves that help us predict where the market might go next.
Let’s break down what this chart is really telling us. 👇
🔁 1. Mirror Market Concept in Play
MMC is all about symmetry. Think of it like looking into a mirror—what price did on the left side, it might repeat (or mirror) on the right side.
Look at the two rounded zones (highlighted in light blue ellipses). Price dipped into the support zone, formed a rounded bottom, and then shot up. A similar pattern is forming again on the right-hand side. This mirroring behavior gives us a clue that price could follow the same path upward again.
📉 2. Trendline Resistance – A Key Level
The chart shows a clear descending trendline that has been respected multiple times. Every time price tries to break above this line, it gets rejected. This tells us that sellers are still in control at that level.
Until this trendline is broken cleanly, bullish momentum remains capped. However, multiple tests of the trendline also indicate it's getting weaker, so a breakout might be coming.
🟪 3. Support Zone – Buyer’s Stronghold
See the purple shaded area near $108,400? That’s the support zone. Price bounced off this area several times, showing that buyers are defending this level.
This zone is important because:
If it holds, we can expect another upward push.
If it breaks, price could drop to the next support level (not shown here, but could be around $107,000–$107,500 based on structure).
🎯 4. Previous Target Hit – New Target Identified
Using MMC, we previously predicted a move up to around $110,800, and that target has been successfully hit (labeled as "Previous Target" in the chart).
Now, a new target zone is forming around $109,600–$109,800, marked on the right side of the chart. If price breaks above the trendline and central zone, this is the next likely destination.
🔵 5. Central Ellipse Zone – Compression Area
The blue ellipse on the right side represents a central zone—an area of price compression and indecision. In MMC, this is where price builds up energy before a move. It acts like a spring: the longer price consolidates here, the bigger the breakout move will be.
Right now, BTC is compressing in this central zone. This is a critical moment. The breakout direction from here could decide the short-term trend.
📊 Trade Plan Ideas:
🔹 Bullish Scenario:
Wait for a clean breakout above the trendline and central zone.
Look for a retest of the breakout area (confirmation).
Target the $109,600–$109,800 zone.
🔹 Bearish Scenario:
If price fails to break the trendline and drops below the support zone at $108,400…
We could expect a deeper pullback toward $107,000–$107,500.
🔹 Key Levels:
Resistance: $109,200 (trendline area), $109,800 (target zone)
Support: $108,400 (zone), $107,500 (next major support if broken)
📘 Final Thoughts:
This chart is a perfect example of how MMC (Mirror Market Concepts) can give us a visual roadmap of what price might do next. It’s not about guessing—it’s about recognizing the psychological patterns that repeat over and over in the markets.
Right now, Bitcoin is sitting at a decision point:
Break above the trendline = possible bullish continuation
Break below support = likely bearish shift
Watch the central zone closely—because the next big move could start from right there. 🔍

XAGUSD Triangle Pattern Forming – Breakdown on the Horizon?🧠 Technical Analysis – XAG/USD
Silver (XAG/USD) has entered a compression phase, forming a classic Symmetrical Triangle Pattern within a broader Black Mind Curve structure, which adds additional psychological and visual significance. These patterns, when paired together, often signal a build-up of volatility ahead of a powerful breakout.
🔍 Pattern Explanation: Triangle + Black Mind Curve
Symmetrical Triangle Pattern: This pattern is marked by converging trendlines of higher lows and lower highs. It reflects indecision between bulls and bears — a tug-of-war where volatility decreases as price coils into the apex.
Black Mind Curve Structure: The curved support and resistance arcs highlight a rounded structure often seen before large breakout moves. These curves create an intuitive framework for understanding how the market is behaving on a broader scale — the "mind of the market" if you will.
🔺 Curve Resistance: Acting as a ceiling suppressing bullish attempts.
🔻 Curve Support: The dynamic floor that has held price within bounds until now.
📉 Breakout & Retest Phase in Play
The triangle has now been breached to the downside, and price is currently in the retest phase — a textbook behavior before continuation. The market is now revisiting the lower boundary of the triangle (~$32.30–$32.40), which is potentially flipping into resistance.
This retest is critical: if price fails to reclaim the triangle and gets rejected, it strengthens the case for further downside.
We’ve also seen a slight uptick in bearish momentum and volume on the initial breakdown.
🎯 Projected Price Targets
We apply the measured move technique, which calculates the triangle’s height and projects it downward from the breakout point:
TP1: $31.68 – A short-term support level and the first technical target.
TP2: $31.12 – Measured move target and key demand zone from the past week.
These levels are not arbitrary — they align with both psychological round numbers and historical structure zones, which often act as magnets for price.
📌 Why This Setup Matters
This isn’t just a triangle breakout. The confluence of the triangle pattern and the Black Mind Curve framework suggests a psychologically significant shift is underway.
Price has respected the curved structure for nearly two weeks.
The triangle represents compression — the final phase before directional expansion.
The false breakout risk is real, but the context (bearish trend leading in, lower highs, failed rallies) favors a downward continuation.
💡 Trade Setup Idea (Example Only)
Parameter Value
🧩 Pattern Symmetrical Triangle
⏳ Phase Retesting after breakdown
🎯 Entry On bearish confirmation at ~$32.30
❌ Stop Loss Above triangle upper bound (~$32.65)
✅ TP1 $31.68
✅ TP2 $31.12
⚖️ Risk/Reward 1:2 or better
Note: Wait for clear rejection candlesticks (e.g., bearish engulfing, shooting star) to confirm bearish intent.
⚠️ Risk Management & Considerations
Avoid premature entries — wait for candle confirmation on the retest zone.
Adjust lot size and leverage according to personal risk tolerance.
Remember: triangle patterns can break either way — monitor invalidation levels carefully (e.g., a breakout back into triangle with strong volume).
💬 Mindset & Market Psychology
This triangle and curve setup mirrors a battle between consolidation and trend continuation. The curves represent the market’s subconscious behavior — as price rounds out and tests boundaries, the final breakout reveals collective trader sentiment.
“Patterns are footprints of psychology. Trade the behavior, not the prediction.”
Be the trader who waits for the story to unfold. Let structure speak before you act.
✅ In Summary
📌 Pattern: Triangle inside Black Mind Curve
🔍 Key Levels: $32.30 (retest), $31.68 (TP1), $31.12 (TP2)
📉 Bias: Bearish, with potential continuation after retest rejection
⏱️ Timeframe: 1H – Suitable for intraday to short-term swing trades
💬 What do you think – is Silver ready to break down, or will bulls reclaim control? Drop your analysis below! Like & follow for more smart technical setups every week.

BTC.D There is no sign of Bitcoin dominance falling and it will likely move towards 70-73% without interruption...

GBP/USD 4H Analysis – Bearish Breakdown SetupThis chart presents a bearish trading setup for GBP/USD on a 4-hour timeframe from OANDA.
Key Observations:
Ascending Channel Breakdown: GBP/USD was previously trading inside an ascending channel, but it has now broken below support, signaling a potential downtrend.
Retest Level: The price is currently retesting the broken support at 1.29645, which may act as a new resistance.
Resistance Zone: The key resistance level is at 1.30261, marking the last swing high before the breakdown.
Bearish Target: The expected downside target is at 1.26827, aligning with a previous demand zone and support level.
Trading Plan:
Entry: Consider short positions after rejection from the 1.29645 retest.
Stop Loss: Place above 1.30261 to avoid false breakouts.
Take Profit: First target at 1.26827, with the possibility of further downside.
Market Outlook:
If the price fails to reclaim the broken support and starts dropping, it could confirm a bearish trend continuation, making this a strong short setup.

EUR/JPY Chart Analysis - Falling Wedge Target with Bullish SetupThis EUR/JPY 1-hour chart reveals a well-defined falling wedge pattern, which is a bullish reversal formation. Additionally, we see key support and resistance levels, a double bottom, and a breakout potential that traders can use to plan an entry. Let’s dissect this chart in a professional and detailed manner to understand the trade setup and market psychology.
🔹 Market Trend & Structure Analysis
The market was previously in an uptrend, making higher highs and higher lows, until it faced strong resistance at the 163.500 level. Upon reaching this zone, the price reversed downward, forming a series of lower highs and lower lows, which resulted in a falling wedge pattern.
This downward movement was accompanied by a trendline break, signaling a shift in momentum. The price has since reached a strong support level and is showing signs of potential bullish reversal.
🔹 Key Technical Patterns & Indicators
1️⃣ Falling Wedge Pattern (Bullish Reversal Signal)
A falling wedge is a pattern characterized by two downward-sloping trendlines that converge, indicating that selling pressure is weakening. This pattern is considered a bullish signal because:
✔️ The declining price movement shows exhaustion of sellers.
✔️ Volume typically decreases as the wedge forms, indicating a breakout is coming.
✔️ Once price breaks out of the wedge, a strong bullish move often follows.
The key here is to wait for a breakout above the upper trendline, which will confirm the bullish momentum.
2️⃣ Double Bottom Formation at Support (Reversal Confirmation)
The price tested the 160.500 support level twice, forming a double bottom pattern. This is another bullish sign, as it indicates:
✔️ Buyers are actively defending this level.
✔️ There’s strong demand around this price zone.
✔️ If price breaks above the wedge resistance, it could trigger a significant rally.
🔹 Key Support & Resistance Levels
Identifying support and resistance is crucial for defining entry and exit points.
✅ Support Levels:
160.500 – Strong horizontal support (Price tested this twice).
158.982 – Stop-loss level (Below this, the bullish setup is invalid).
✅ Resistance Levels:
163.500 – Major resistance (Previous high and supply zone).
165.090 – Final target (Key breakout level).
If the price successfully breaks out of the wedge, it has room to rise significantly, with 163.500 as the first target and 165.090 as the ultimate goal.
🔹 Trade Setup & Execution Plan
🎯 Bullish Breakout Trade Strategy
Since this setup signals a potential reversal, here’s how traders can execute a high-probability trade:
🔹 Entry Points:
✅ Aggressive Entry: Enter as soon as price breaks above the wedge resistance.
✅ Conservative Entry: Wait for a breakout and a retest of the resistance-turned-support before entering.
🔹 Target Levels:
🎯 First target: 163.500 (Previous resistance level).
🎯 Final target: 165.090 (Major resistance zone).
🔹 Stop-Loss Placement:
❌ Place the stop loss below 158.982, as a break below this level would invalidate the bullish setup.
🔹 Risk-Reward Ratio & Trade Justification
📈 Why This Trade Has a High Potential Reward?
Low-risk, high-reward: The stop loss is tight, while the upside potential is large.
Confluence of bullish signals: Falling wedge + Double bottom + Strong support.
Institutional interest likely: Buyers are stepping in at key levels.
A proper risk-to-reward ratio (RRR) for this trade would be at least 1:3, meaning for every 1% risk, there’s a 3% profit potential. This makes it a great swing trading setup.
🔹 Market Psychology Behind the Setup
The falling wedge represents a market correction after a strong bullish trend.
The double bottom shows that sellers are exhausted and buyers are gaining control.
If price breaks out, many traders will enter, triggering a strong upward rally.
This bullish breakout setup aligns with the smart money concept, where institutions accumulate positions before a big move.
🔹 Final Thoughts & Trade Outlook
This EUR/JPY setup presents a high-probability trade opportunity with a bullish breakout scenario. The combination of:
✅ Falling Wedge Pattern (Bullish reversal)
✅ Double Bottom at Support (Buyers stepping in)
✅ Key Resistance Targets (Clear trade exit points)
…creates a great trading setup.
📌 Trading Plan Summary:
✔️ Buy on breakout above the falling wedge.
✔️ Target 163.500 & 165.090 for profits.
✔️ Stop-loss below 158.982 for risk management.
🚀 If executed correctly, this trade has the potential for strong bullish momentum. Would you like a real-time update once the price confirms the breakout? Let’s keep an eye on this trade! 📊🔥

Gold (XAU/USD) – Head & Shoulders Breakdown in Bearish Move🔍 Overview of the Chart & Market Context
This 15-minute Gold Spot (XAU/USD) chart shows the formation of a classic Head & Shoulders (H&S) pattern, signaling a potential trend reversal from bullish to bearish. This pattern often indicates that buying momentum is weakening, and a significant price decline may follow.
Gold has been in a strong uptrend before forming this structure. However, after reaching a resistance zone at an all-time high (ATH), the market has failed to sustain its bullish momentum. The rejection from this level and the break of the neckline (support level) suggest that sellers are gaining control, leading to a potential bearish breakdown toward the downside target.
This setup provides a high-probability shorting opportunity if price action follows through with the bearish structure. Let’s analyze the different elements in detail.
📊 Understanding the Head & Shoulders Pattern in Detail
The Head & Shoulders is a well-known reversal pattern, and in this case, it forms at the top of an uptrend, indicating a shift in market sentiment. The key components of this pattern in the chart are:
1️⃣ Left Shoulder
Price made an initial rally, then faced rejection at a resistance level.
A retracement occurred, forming a swing low, which became part of the neckline support.
2️⃣ Head
Buyers attempted another push, creating a higher high.
However, the rally was unsustainable, as sellers pushed the price back down toward the neckline.
This forms the peak of the structure, marking the highest point before the reversal.
3️⃣ Right Shoulder
Another rally followed, but this time, buyers lacked strength.
The price failed to break the previous high (head level) and reversed downward.
This indicated that selling pressure was increasing, forming the right shoulder.
4️⃣ Neckline (Support Level)
This is the most critical level in this setup.
It connects the swing lows between the left shoulder and right shoulder.
Once the price breaks below this trendline support, the pattern is confirmed, triggering a bearish move.
📌 Key Technical Levels Identified
🔵 Resistance Level (+ ATH – All-Time High)
The blue box represents the strong resistance zone where gold faced rejection multiple times.
This level acted as a supply zone, preventing further bullish continuation.
📉 Neckline & Support Level
This trendline support (dotted black line) connected the lows between the left and right shoulders.
A clean break and retest of this level signal further downside movement.
🚨 Stop Loss Level ($3,048.777)
The ideal stop-loss placement is above the right shoulder to prevent getting stopped out by market noise.
If the price reclaims this level, it could invalidate the bearish thesis.
🎯 Target Level ($2,989.544)
The target is based on the measured move, calculated by taking the height from the head to the neckline and projecting it downward.
If the breakdown plays out successfully, we could see a move toward $2,989.544 or even lower.
📉 Trading Plan: Bearish Trade Setup
🔴 Short Trade Entry
Sell Entry: On the break & retest of the neckline (support turning into resistance).
Confirmation: A strong bearish candlestick (e.g., engulfing pattern) below the neckline.
🚨 Stop Loss (Risk Management)
SL Placement: Above the right shoulder ($3,048.777) to prevent false breakouts.
Reason: If price moves above this level, the pattern gets invalidated.
🎯 Profit Target (Take Profit)
Target Level: $2,989.544, based on the measured move.
Risk-to-Reward (RR) Ratio: Aiming for at least a 1:2 RR ratio, ensuring a profitable setup.
📌 Confirmation Signals for Stronger Conviction
For higher probability, traders should look for additional confirmations before entering the short position:
✔ Neckline Retest: After breaking below the neckline, price retests it as resistance before dropping further.
✔ Bearish Candlestick Pattern: Engulfing candles, shooting stars, or rejection wicks indicate strong selling pressure.
✔ Increased Volume on Breakdown: A spike in volume on the breakdown confirms strong market participation.
✔ RSI Divergence: A bearish divergence between price and RSI may signal trend exhaustion.
📉 Expected Price Action: What’s Next?
Based on this setup, if the bearish structure plays out as expected:
1️⃣ Price will retest the neckline as new resistance.
2️⃣ Sellers will step in, pushing the price lower.
3️⃣ Gold will continue downward toward the $2,989 support level.
4️⃣ If strong selling continues, price may drop even further beyond the target zone.
However, if price closes back above the right shoulder, the bearish setup gets invalidated, and traders should exit the short position immediately.
📌 Final Thoughts & Summary
Pattern Identified: Head & Shoulders (Bearish Reversal)
Market Bias: Bearish
Entry Trigger: Break & retest of the neckline
Stop-Loss Placement: Above the right shoulder ($3,048)
Take-Profit Target: $2,989
Risk Management: Ensure a minimum 1:2 RR ratio
📉 Conclusion:
Gold is showing signs of bearish exhaustion after forming a Head & Shoulders pattern. A confirmed break below the neckline suggests that the price may continue its downward trajectory. Traders should wait for a proper retest before entering, use strict risk management, and monitor key technical indicators for confirmation.
Would you like me to provide an alternative trading plan if the price reverses? 🚀

EUR/JPY Trading Setup – Falling Wedge Breakout Potential1. Overview of the Market Structure
The EUR/JPY daily chart presents a falling wedge pattern, which is a classic bullish reversal setup. This pattern has been forming for several months, indicating that the price has been consolidating within a narrowing range. The falling wedge typically suggests that selling pressure is weakening, and a potential breakout to the upside could follow.
The chart also highlights key support and resistance zones, along with a well-defined trading setup based on technical confluences.
2. Key Technical Levels
Support Level: ~ 155.819 (Marked as Stop Loss)
This level has acted as strong support multiple times.
A break below this level would invalidate the bullish bias.
Resistance Level: ~ 163-164
The price has previously struggled to break above this region.
Currently, it is retesting this level after a breakout attempt.
Target Levels:
175.246 – This aligns with a previous all-time high zone and a strong resistance level.
179.562 – Marked as the ultimate target, indicating a full breakout potential.
3. Falling Wedge Formation & Breakout Analysis
A falling wedge is a bullish pattern that indicates a decrease in selling pressure over time.
The price has tested the lower trendline multiple times, showing strong demand at support.
Recently, the price broke above the upper wedge trendline, suggesting that a breakout is in progress.
However, the breakout needs confirmation in the form of a successful retest at the previous resistance level (~163-164).
4. Retest Confirmation & Trade Setup
Retest Scenario: If the price holds above the previous resistance and confirms it as support, the probability of continuation towards 175-179 increases.
Entry Strategy: A buy entry can be considered after a successful retest with bullish price action confirmation.
Stop-Loss Placement: Below 155.819 (previous strong support).
Risk-Reward Ratio: The target offers a strong risk-reward ratio if the breakout holds.
5. Market Sentiment & Volume Analysis
The previous downward move showed declining bearish momentum, further confirming the validity of the falling wedge.
A volume increase on the breakout would provide additional confirmation.
If the price consolidates near the breakout zone with low volatility, a strong move upward could follow.
Final Conclusion: Bullish Breakout in Progress
The falling wedge breakout suggests that EUR/JPY is poised for further upside.
A successful retest at 163-164 could push the price towards 175.246 and ultimately 179.562.
Risk management is crucial, and a stop-loss below 155.819 is recommended to avoid invalidation of the setup.
This setup presents a high-probability trading opportunity, but confirmation through price action and volume analysis remains key.
Key Trading Plan Summary:
📌 Pattern: Falling Wedge (Bullish)
📌 Breakout Confirmation: Yes, but retesting is ongoing
📌 Entry Point: Above 163-164 after successful retest
📌 Stop Loss: Below 155.819
📌 Target Levels: 175.246, then 179.562
📌 Risk-Reward: Favorable if breakout sustains
Would you like any refinements or a more concise version for your TradingView post? 🚀📈

JPY/USD Trading Setup – Falling Wedge Breakout & Bullish MoveThe JPY/USD 1-hour chart is displaying a well-defined falling wedge pattern, which is typically a bullish reversal setup. This pattern forms as price action moves within converging trendlines, indicating that selling pressure is gradually weakening. The breakout from this pattern signals a potential trend reversal, and the price may be heading toward key resistance zones and an eventual bullish target.
This analysis will break down the chart structure, market psychology, key levels, and a trading setup to help traders make an informed decision.
1. Understanding the Falling Wedge Pattern
The falling wedge is a common price action pattern characterized by:
🔹 Lower highs and lower lows forming within two downward-sloping trendlines.
🔹 Decreasing volume, indicating that sellers are losing momentum.
🔹 A breakout above the upper trendline, confirming a shift in trend and signaling the start of bullish momentum.
Market Psychology Behind the Wedge Pattern:
📉 During the wedge formation, the market is in a downtrend, and sellers are in control. However, with each new lower low, the price finds strong support, and buyers start stepping in.
📊 As the wedge narrows, the downward momentum weakens, and sellers struggle to push the price lower. Eventually, demand exceeds supply, leading to a breakout to the upside, which is exactly what we see on this chart.
2. Key Levels & Market Structure
🔹 Support Zone & Reversal Area:
The support zone between 0.006660 - 0.006680 acted as a strong demand area, preventing further downside.
This is also labeled as a reversal area, meaning buyers were aggressive in this zone.
The final touch at this support led to a strong bounce, initiating the breakout.
🔹 Resistance Level:
The price is now approaching a key resistance area at 0.006780 - 0.006800, which previously acted as a supply zone.
A break and retest of this level would further confirm bullish momentum.
🔹 All-Time High (ATH) & Target Level:
The ATH region is marked on the chart as a historical resistance level where price faced strong selling pressure before.
If the current breakout holds, price action could aim for the 0.006851 target level, completing the measured move from the wedge pattern.
3. Trading Strategy & Execution Plan
📈 Entry Strategy:
There are two main ways to enter this trade:
1️⃣ Aggressive Entry: Enter immediately after the breakout above the falling wedge.
2️⃣ Conservative Entry: Wait for a breakout AND retest of the previous resistance turned support (0.006780 zone) before entering long.
🔻 Stop-Loss Placement:
To manage risk, traders should consider placing stop-loss orders:
Below the previous support zone (0.006660) to minimize downside risk.
Alternatively, below the wedge breakout point if using a tight stop-loss.
🎯 Take-Profit Targets:
1️⃣ First Target: 0.006780 (near-term resistance level).
2️⃣ Final Target: 0.006851 (based on wedge breakout projection).
4. Confirmation & Risk Management
🔎 Key Confirmation Factors for a Strong Breakout:
✅ Price breaks above the falling wedge with strong bullish candles.
✅ Volume increases, showing strong buying interest.
✅ RSI or other momentum indicators confirm bullish divergence.
⚠️ Potential Risks to Consider:
False Breakout: If price falls back inside the wedge, this could invalidate the bullish setup.
Rejection at Resistance: If buyers fail to push price above the 0.006780 resistance, it could lead to another consolidation.
5. Final Thoughts & Trading Outlook
📌 This JPY/USD chart presents a high-probability bullish setup due to the breakout from a falling wedge pattern.
📌 The breakout, strong support zone, and bullish price action indicate further upside potential.
📌 Risk management is key—waiting for confirmation can increase the probability of success.
💡 Final Verdict: Bullish Bias – Watching for Retest & Continuation to Target! 🚀

(BTC/USD) – Rising Wedge Pattern - Critical Breakout Setup🔍 Market Overview & Technical Breakdown
Bitcoin (BTC/USD) is currently forming a rising wedge pattern on the 4-hour timeframe, which is a bearish signal indicating a potential reversal. The price action shows higher highs and higher lows, but the narrowing wedge suggests that buying momentum is weakening.
BTC has been battling a major resistance zone around $85,000 - $87,500, struggling to break higher. If Bitcoin fails to hold above the key support level at $80,000, we could see a strong downside move. However, if BTC breaks the upper resistance, the bearish setup may be invalidated, opening the door for a push toward $95,000+.
📉 Rising Wedge Pattern (Bearish Formation)
A rising wedge occurs when the price moves upward within two converging trendlines, making higher highs and higher lows but with a weakening bullish momentum. This pattern often breaks downward, leading to a sharp sell-off.
Characteristics of This Wedge Formation:
✅ Upward Sloping Support & Resistance Lines: BTC is trending higher, but the slope is narrowing, showing a loss of bullish strength.
✅ Decreasing Volume: Volume is declining as price moves higher, indicating buyers are losing control.
✅ Bearish Breakout Probability: Rising wedges typically break down 75% of the time, suggesting a high likelihood of a drop below support.
🔑 Key Levels to Watch
🔺 Resistance Zones (Potential Breakout Levels)
1️⃣ $85,000 - $87,500 → Strong resistance; BTC has repeatedly failed to break above.
2️⃣ $90,000+ → A confirmed breakout would invalidate the wedge and shift the trend bullish.
3️⃣ $107,000 Target → If BTC breaks above resistance, we could see a move toward the psychological $100,000 - $107,000 level.
🔻 Support Levels (Bearish Breakdown Zones)
1️⃣ $80,000 - $82,000 → Key support within the wedge; a breakdown confirms the bearish move.
2️⃣ $75,000 → Strong historical demand zone; BTC could bounce here if it drops.
3️⃣ $70,000 and Below → Ultimate bearish target if selling pressure accelerates.
📈 Bullish vs. Bearish Scenarios
⚠️ Bearish Scenario (Rising Wedge Breakdown)
🔴 Entry: Below $80,000 (confirmed breakdown).
📉 Stop-Loss: Above $83,500 (to avoid fakeouts).
🎯 Take-Profit Targets:
TP1: $78,000
TP2: $75,000
TP3: $70,000
🔹 Confirmation: Look for increased selling volume and a retest of $80,000 as resistance after breakdown.
🚀 Bullish Scenario (Breakout Above Resistance)
✅ Entry: Above $87,500, confirming bullish momentum.
📉 Stop-Loss: Below $85,000 (to minimize risk).
🎯 Take-Profit Targets:
TP1: $90,000
TP2: $95,000
TP3: $107,000
🔹 Confirmation: BTC must break the wedge’s upper boundary with strong volume for bullish continuation.
📊 Technical Indicators & Market Sentiment
🔵 RSI (Relative Strength Index)
Currently near 60 – Showing bullish momentum but not yet overbought.
A move above 70 could signal an overbought market and potential reversal.
🔴 Volume Profile
Volume is decreasing as BTC rises, suggesting a possible exhaustion of buying power.
A breakout should be accompanied by strong volume to confirm bullish strength.
🟢 Moving Averages (EMA & SMA)
BTC is trading above key EMAs (50 & 200), supporting the bullish case.
A breakdown below the 50 EMA could accelerate selling pressure.
📢 Final Thoughts: High-Risk, High-Reward Setup
🚨 BTC is at a critical decision point! The rising wedge pattern suggests a bearish reversal, but confirmation is needed. If BTC breaks below $80K, expect a strong sell-off. However, if bulls manage to break above resistance, BTC could rally toward $100K+.
🔹 Risk Management Tip:
✅ Always wait for confirmation before entering a trade.
✅ Use stop-losses to protect your capital.
✅ Monitor volume & key levels for stronger trade signals.
🔥 What’s your take on this setup? Will BTC break down or push higher? Let’s discuss in the comments! 👇

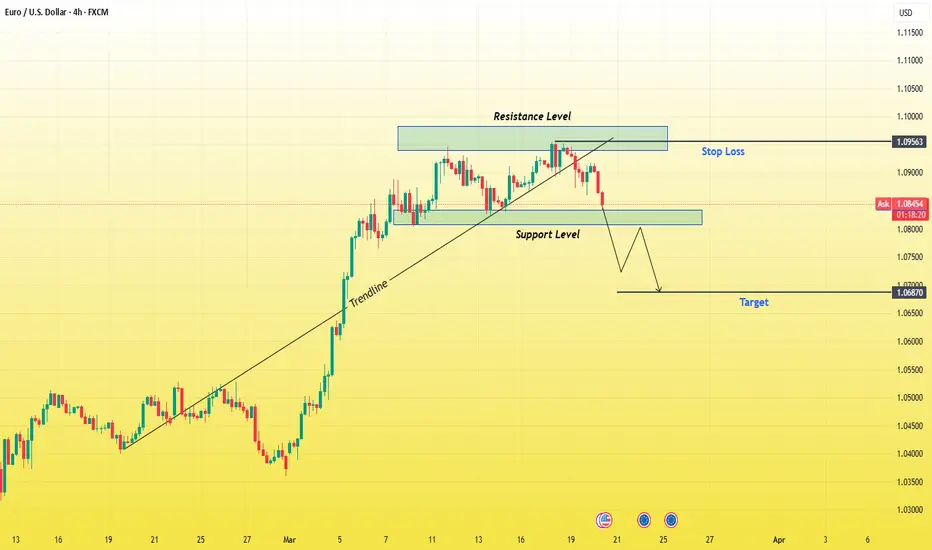
EUR/USD 4H Analysis – Bearish Breakdown Setup1. Market Structure & Trend
The EUR/USD chart shows a previous uptrend, confirmed by the ascending trendline, where the price made higher highs and higher lows. However, the trendline has now been broken, signaling a potential shift in market direction. The price is currently retracing from a key resistance zone, and a possible bearish continuation is expected.
2. Key Levels & Zones
✅ Resistance Zone (1.09563 - 1.1000):
This blue-shaded area represents a strong resistance level, where sellers have stepped in multiple times.
Price previously attempted to break this level but failed, forming a rejection.
This suggests buyers are losing strength, and sellers are likely to dominate.
✅ Support Level (1.0800 - 1.0780):
A critical support zone, which acted as a demand area in the past.
If price breaks below this level with strong bearish momentum, it confirms a trend reversal.
✅ Target Level (1.06870):
The next major downside target aligns with previous market structure and liquidity zones.
This area marks a key demand zone, where buyers might step in again.
3. Trade Setup & Execution Plan
🔹 Entry Strategy
A sell entry is ideal on a confirmed break and retest of the support zone at 1.0800.
If price retests this level and forms bearish rejection candles (such as pin bars or engulfing patterns), it strengthens the bearish bias.
🔹 Stop Loss & Risk Management
A stop loss should be placed above the resistance zone at 1.09563, ensuring a safe exit if the market reverses bullish.
Risk-to-Reward Ratio (RRR):
Entry: Below 1.0800 (after confirmation).
Stop Loss: Above 1.09563 (resistance zone).
Target: 1.06870 (support zone).
RRR: Around 1:3, meaning potential profit is three times the risk.
4. Confirmation Indicators & Confluences
✅ Bearish Trendline Break:
The ascending trendline has been broken, confirming a possible shift in trend.
✅ Support Flip:
If the price breaks support and retests it as resistance, it confirms bearish continuation.
✅ Price Action Candlestick Patterns:
Look for bearish engulfing candles, pin bars, or rejection wicks at key levels.
✅ Volume Analysis:
Increased selling pressure after support break indicates strong bearish momentum.
5. Final Thoughts & Bias
📉 Bias: Bearish (Unless resistance is reclaimed).
💡 Key Watch: Break and retest of 1.0800 support for confirmation.
⚠️ Risk Management: Always use a stop loss to manage risk effectively.
Conclusion
This setup presents a high-probability short trade with a clear entry, stop loss, and target. Traders should wait for confirmation signals before executing the trade. If price breaks above resistance, the bearish outlook is invalidated.
🔔 Stay cautious and trade with discipline! 🚀
Gold (XAU/USD) Trading Setup – Short Opportunity with Key Target📌 Chart Overview
This is a 1-hour (H1) candlestick chart of XAU/USD (Gold to US Dollar), displaying a potential short (sell) trading setup. The price action suggests that gold is testing a strong resistance zone, and if it gets rejected, a bearish move could follow. The chart includes key technical elements like trendlines, support/resistance levels, and take-profit (TP) zones.
🛠️ Technical Breakdown
1️⃣ Uptrend and Resistance Test
Gold has been in a strong uptrend, as seen from the ascending trendline supporting price movements since March 14.
The price is currently testing a major resistance zone around the ATH (All-Time High) + Resistance Level (~$3,057-$3,072).
A rejection from this level would indicate a potential trend reversal or pullback before any further bullish continuation.
2️⃣ Sell Stop Placement – Waiting for Confirmation
Instead of entering a trade immediately, a Sell Stop order is placed below the trendline.
This means the trade will only activate if the price breaks down from the trendline support, confirming bearish momentum.
3️⃣ Target Levels (Take Profit Zones)
Once the sell trade is activated, the price is expected to move toward the following TP (Take Profit) zones:
TP 1 (~$3,045) – First minor support; price might pause or bounce briefly.
TP 2 (~$3,037-$3,040) – A stronger support zone, where profit can be partially secured.
TP 3 (~$3,029-$3,028) – The final target, aligning with a significant support level. This is the most crucial zone where price could reverse or consolidate.
4️⃣ Support Zone and Potential Bounce
The green-shaded area represents a strong support level (~$3,028-$3,030), previously tested in past price action.
If the price reaches this area, buyers might step in, potentially pushing gold back up.
📉 Trade Execution Plan
✔️ Entry: Below the trendline, activated by the Sell Stop order.
✔️ Stop Loss: Above the resistance level (~$3,072) to limit risk.
✔️ Profit Targets: TP1, TP2, and TP3 (scaling out profits).
✔️ Confirmation Factors: Rejection from resistance, trendline breakdown, and bearish momentum indicators.
🔎 Final Thoughts & Market Sentiment
If price fails to break the trendline, gold might continue its bullish run toward new highs.
If the breakdown occurs as anticipated, a strong short trade opportunity is present.
Always monitor fundamental factors (like economic data and news) that could impact gold prices.
Risk Management Tip: Use proper position sizing and a trailing stop to lock in profits if the trade moves in favor. ✅
📊 Conclusion : A well-structured short setup, with a solid risk-reward ratio and defined execution plan. Happy trading! 🚀📉

CHF/USD Trading Idea – Bearish Reversal from Key ResistanceThis CHF/USD chart presents a compelling bearish setup, suggesting that the pair may be headed for a decline after facing strong resistance. The price action has followed a technical breakout and retest pattern, with a clear rejection from a well-defined resistance level.
Traders looking for short-selling opportunities should take note of the key price zones, support levels, and overall market structure before making a move. Let’s break it down in detail.
🔍 Chart Breakdown: What’s Happening?
1️⃣ Falling Wedge Breakout & Bullish Push
The price was consolidating inside a falling wedge, a pattern that typically signals an eventual breakout to the upside.
The breakout led to a strong bullish move, pushing the price toward a well-established resistance zone around 1.1414.
After breaking out, the pair made a significant upward run before stalling at this key resistance.
2️⃣ Key Resistance Level Holding Strong
The price touched the resistance zone but failed to break above it.
This rejection indicates that sellers are stepping in, absorbing the buying pressure.
The market is showing early signs of bearish momentum, hinting at a potential downtrend.
3️⃣ Projected Bearish Move: Lower Targets in Sight
If the current rejection holds, the price is likely to fall toward the nearest support levels:
✅ TP 1 (Take Profit 1): 1.1271 → First major support level, likely to be tested soon.
✅ TP 2 (Take Profit 2): 1.1201 → A deeper retracement if selling pressure increases.
✅ TP 3 (Take Profit 3): 1.1055 → Final downside target if the bearish trend extends further.
4️⃣ Stop Loss Placement – Risk Management
To manage risk, the ideal stop loss should be placed slightly above the resistance level at 1.1414.
This protects against potential false breakouts and unexpected market shifts.
📉 Trade Strategy – How to Approach This Setup?
🔸 Entry Point: Look for a confirmed rejection of the resistance level (e.g., bearish candlestick patterns like engulfing, shooting star, or pin bars).
🔸 Stop Loss: Place above 1.1414 to avoid getting caught in a short squeeze.
🔸 Take Profit Targets:
First TP at 1.1271
Second TP at 1.1201
Final TP at 1.1055 for extended downside moves
⚠️ Important Notes for Traders:
✔ Wait for Confirmation: Don’t rush into a short trade. Look for a strong bearish candle closure or a retest before entering.
✔ Be Aware of News Events: Economic releases, interest rate decisions, and major USD-related news can impact price movement.
✔ Monitor Market Sentiment: If USD strengthens, this setup is even more likely to play out.
🧐 Final Thoughts – High Probability Short Setup?
✅ Why This Trade Looks Strong:
The technical pattern is playing out perfectly, with a clear resistance rejection.
The risk-to-reward ratio is favorable, with well-defined entry, stop loss, and take profit levels.
The overall market structure supports a potential downside move if price continues respecting resistance.
📢 Bottom Line : If price remains below the 1.1414 resistance, this trade setup could provide an excellent opportunity for short-sellers targeting lower support levels. 🚀 Stay patient and wait for confirmation before pulling the trigger!

EURSEK at Key Support Level - Will Price Rebound to 11,364?OANDA:EURSEK is in a significant support zone, which has been a turning point for bullish moves. The recent bearish pressure brings the price into this critical area, creating a potential buying opportunity.
If bullish signals appear, such as strong buying volume or bullish candlestick patterns, I expect the price to move toward 11,364, . However, a break below this support would invalidate the bullish bias and could lead to further downside.
Traders should be patient and wait for confirmation of bullish strength before entering long positions.
Just my take on support and resistance zones—not financial advice. Always confirm your setups and trade with solid risk management,
Best of luck , TrendDiva

Demand Zone Signals Opportunity for WLDUSDT
The market structure for BINANCE:WLDUSDT remains bullish as long as the swing low at $1.58 is not broken. Recent price action suggests a favorable entry point in the demand zone between $1.58 and $1.92 .
The next significant target is at $4.19 , a historically reactive zone where previous price movements have faced strong resistance. This level aligns with the bullish market structure and offers a high-profit potential.
This trade setup presents an impressive risk-to-reward ratio of 1:6 , making it an appealing opportunity for traders. Maintaining the structure above the demand zone is crucial for bullish continuation. However, a break below $1.58 would invalidate this idea and could signal a bearish shift.
👨🏻💻💭 Do you think WLDUSDT can hold the bullish structure and hit $4.19? Share your thoughts or ideas below and let’s discuss this setup!
__________________________________________________________________
The information and publications within the 3Commas TradingView account are not meant to be and do not constitute financial, investment, trading, or other types of advice or recommendations supplied or endorsed by 3Commas and any of the parties acting on behalf of 3Commas, including its employees, contractors, ambassadors, etc.

XAUUSD BUY NOW XAUUSD - GOLD
TRADE SETUP & KEY POINTS :
4Hr time frame forming a Parallel Channel.
Market Coming Channel Bottom.
Support Level - 2710 $
Next Support & Channel Bottom - 2692 $
Entry - Focus on Support Levels
Target - Channel Top
Stoploss - Channel Breakout ..
Happy trading .. we will Update soon ..

How To Do Multi-TimeFrame Analysis With TradingViewHey,
In this video I provide the two key laws that helped me with trading;
1. An imbalance on the higher time-frames is a range on the lower time-frames.
2. A run on the higher time-frames is a trend on the lower time-frames.
From this point of view, I share with you how I analyze the charts from Monthly to Weekly to Daily chart, and how I like to time the next few days of price-action.
The chart I use in this tutorial is GBP/USD.
Kind regards,
Max Nieveld

10 Brutal Truths About Why Retail Support & Resistance Fail !CAPITALCOM:GOLD
10 Reasons Why Retail Support and Resistance Levels Fail: Unlocking Gann’s Secrets to Market Mastery
Here’s a deeply researched, professional explanation for each point, infused with Gann’s quotes, examples, and concepts, to open the eyes of traders to why retail methods often fail and how Gann's wisdom provides clarity.
1. Static Levels in a Dynamic Market -
Explanation: Retail traders often draw support and resistance (S/R) lines as static horizontal levels, expecting the market to repeatedly respect them. However, Gann emphasized the dynamic nature of markets, stating:
"Markets are never still; they are always moving, reflecting time and price interplay."
Markets are influenced by cycles, trends, and time frames, making S/R levels fluid rather than fixed. For instance, Gann’s Square of Nine shows how support and resistance rotate based on angles and time increments, offering precise levels that adapt dynamically. Retail traders fail to adjust their levels as time progresses, missing key changes in price behavior.
2. Failure to Incorporate Time -
Explanation: Retail S/R methods typically ignore the role of time, which is a critical element in Gann's work. Gann wrote:
"Time is the most important factor in determining market movements."
Support may fail not because the level was invalid but because the "time factor" for that level has expired. For example, in Gann’s Time Cycles, support at a certain price might hold only for a specific duration. When that time passes, the level loses its relevance. Retail traders, unaware of such timing principles, are often blindsided when the market breaks their "strong" levels.
3. Lack of Confluence with Angles -
Explanation: Gann’s methodologies prioritize the confluence of price and angle relationships. He believed that price moves in harmony with geometric angles, stating:
"When price meets time at an angle, a change is imminent."
Retail traders fail to consider these angular relationships, focusing only on flat horizontal lines. For example, a 45° angle from a significant low often acts as a true support, but retail traders, relying solely on previous price zones, miss these powerful turning points.
4. Overcrowding and Psychological Herding -
Explanation: S/R levels widely used by retail traders often attract a large number of orders at the same price zone, making them predictable and vulnerable to institutional manipulation. Gann noted:
"The crowd is often wrong, and the minority drives the market."
Institutions exploit this herding by triggering stop-losses just below support or above resistance, creating false breakouts. For instance, Gann’s "Law of Vibration" explains how markets seek equilibrium by disrupting imbalances created by crowd psychology.
5. Ignoring Volume Analysis
Explanation: Retail traders rarely integrate volume into their S/R analysis. Gann emphasized the importance of volume, stating:
"Price movements must be confirmed by volume to validate strength."
Support may appear to hold, but without accompanying volume, the level lacks significance. A practical Gann-based example would involve observing increased volume near a critical angle or price zone, signaling genuine strength or weakness at that level.
6. Using Recent Highs/Lows Without Context -
Explanation: Many retail traders base S/R levels on recent highs and lows, assuming these are universally strong zones. Gann criticized such oversimplified approaches, writing:
"The past governs the future, but only through proper analysis of cycles and patterns."
Without analyzing historical patterns and cycles, these levels are often superficial. For example, Gann's Master Charts reveal that true resistance may lie at a harmonic distance from an earlier historical pivot, not necessarily at the recent high.
7. Misunderstanding False Breakouts -
Explanation: Retail traders often misinterpret false breakouts as failures of support or resistance. Gann explained this phenomenon through his price and time squares, stating:
"A breakout without harmony is often a trap, designed to mislead the majority."
For instance, a false breakout above resistance might align with a Gann angle signaling a reversal, confusing those relying solely on retail S/R levels.
8. Ignoring Market Structure and Trend -
Explanation: Retail traders often focus on S/R levels without understanding the broader market structure or trend. Gann believed:
"The trend is your friend until time signals the end."
Support is more likely to hold in an uptrend, while resistance is stronger in a downtrend. A classic Gann principle involves combining market structure with angular analysis to determine whether S/R levels will hold or break.
9. Failure to Account for Gann's Price Harmonies -
Explanation: Gann’s studies reveal that price moves in harmonic relationships, often tied to Fibonacci ratios and geometric principles. Retail traders using arbitrary S/R levels fail to respect these harmonies. For example, Gann's observation of price doubling or halving (e.g., $50 to $100) often defines true support or resistance.
10. Reliance on One-Timeframe Analysis -
Explanation:
Retail traders frequently analyze S/R on a single timeframe, missing the interplay between multiple timeframes. Gann emphasized multi-timeframe alignment, writing:
"The major trend governs the minor trend, and the minor trend refines the major."
Support on an hourly chart may fail if it conflicts with resistance on a daily chart. Gann’s multi-timeframe methods ensure alignment, reducing the likelihood of failure.
Updated Closing Thought-
By understanding the reasons why retail support and resistance often fail and incorporating Gann’s time-tested principles, traders can elevate their skills to a professional level. Gann's focus on time, price, and geometry provides a roadmap to understanding the market with unparalleled precision.
This content is invaluable for anyone seeking trading mastery, so don't keep it to yourself! Save this and share it with your friends so they can benefit too. Follow for more absolutely valuable and free trading insights!

Gold long.I am in going long. I explained in last nights video what I wanted to happen and it has happened.

CHFJPY strong bearish expectations
CHFJPY in first analysis (attached) we are have bullish continuation (price is make bounce), here now second time making analysis and expectations are now to see bearish take over here.
SUP zone: 176.800
RES zone: 174.500, 174.000, 173.500, 173.000

Box range: 2281.87-2706.15
Hello, traders.
If you "Follow", you can always get new information quickly.
Please click "Boost" as well.
Have a nice day today.
-------------------------------------
(ETHUSDT 1D chart)
Unlike BTC, it looks so weak.
One of the reasons is that it has fallen below the long-term moving average, that is, the M-Signal indicator on the 1M chart.
In other words, I think that the uptrend is likely to start only when the price is maintained above the M-Signal indicator on the 1M chart.
To do that, the price needs to rise above 2629.79-2706.15 and maintain it.
If not,
1st: 2281.87-2359.35
2nd: 2118.67
We need to check whether there is support near the 1st and 2nd above.
It seems that it is forming a box section at first glance, so the point to watch is which direction it deviates from this box section.
-
Have a good time.
Thank you.
--------------------------------------------------
- Big picture
It is expected that a full-scale uptrend will start when it rises above 29K.
The section expected to be touched in the next bull market is 81K-95K.
#BTCUSD 12M
1st: 44234.54
2nd: 61383.23
3rd: 89126.41
101875.70-106275.10 (overshooting)
4th: 134018.28
151166.97-157451.83 (overshooting)
5th: 178910.15
These are points where resistance is likely to occur in the future.
We need to check if these points can be broken upward.
We need to check the movement when this section is touched because I think a new trend can be created in the overshooting section.
#BTCUSD 1M
If the major uptrend continues until 2025, it is expected to start forming a pull back pattern after rising to around 57014.33.
1st: 43833.05
2nd: 32992.55
-----------------

Second section is an attractive buy section (confirm support)
Hello, traders.
If you "Follow", you can always get new information quickly.
Please also click "Boost".
Have a nice day today.
-------------------------------------
(BTCUSDT 1D chart)
It seems to have met resistance in the 68393.48-69031.99 section and fallen below 67414.39.
Accordingly, we need to check for support near 67414.39.
If it meets resistance at 67414.39 and falls, we need to check for support near 65602.01-65920.71.
-
BW (50) is showing signs of being newly created at 66668.65.
Accordingly, the key is whether BW (50) can be supported near the newly created point and rise above 67414.39.
-
Since the StochRSI indicator has currently entered the oversold zone, the decline is strong.
Therefore, if it fails to maintain the price by rising above 67414.39, it is likely that an additional decline will occur and it is recommended to consider a countermeasure.
When the StochRSI indicator rises above the oversold zone and maintains the state of StochRSI > StochRSI EMA, the upward trend is likely to begin.
Therefore, the 2nd zone (65920.71-67414.39) is an important support and resistance zone.
In addition, since the M-Signal indicator on the 1D chart is passing the 65920.71-67414.39 zone, it is even more important.
-
Checking for support is a difficult and tedious task.
Therefore, it is also good to refer to the location of the StochRSI indicator or BW indicator to help confirm the direction when checking whether there is support.
I think that you can create a much better response plan than drawing a trend line and checking whether it goes up or breaks away from it.
Trend lines are used for chart analysis, but they are not very helpful in conducting actual trading.
The reason is that they are made of diagonal lines.
Therefore, I think that it is good to use trend lines in combination with support and resistance points drawn on 1M, 1W, and 1D charts to confirm the period of volatility.
Since a pattern is meaningful when it is completed, you should not try to think in terms of fitting it into a pattern.
-
After all, the purpose of everything displayed on a chart should be to conduct trading.
Therefore, you should check what kind of movement is shown at the support and resistance points drawn on the chart and trade accordingly to make a profit.
Since the StochRSI indicator has currently fallen below 50, we should look at the chart with the purpose of finding a time to buy.
For that purpose, the 2nd section (65920.71-67414.39) is an attractive buying section.
If it falls in the 2nd section, the next buying section is likely to be 61099.25-62791.03.
The reason for this is that the M-Signal indicator on the 1W chart is passing around 62791.03.
-
Therefore, we should know how to wait when we wait, and when it is time to start trading, we should start trading boldly.
I think it is time to wait because it is still confirming support and resistance.
-
Have a good time.
Thank you.
--------------------------------------------------
- Big picture
It is expected that the real uptrend will start after rising above 29K.
The section expected to be touched in the next bull market is 81K-95K.
#BTCUSD 12M
1st: 44234.54
2nd: 61383.23
3rd: 89126.41
101875.70-106275.10 (when overshooting)
4th: 134018.28
151166.97-157451.83 (when overshooting)
5th: 178910.15
These are the points where resistance is likely to be encountered in the future. We need to see if we can break through these points.
We need to see the movement when we touch this section because I think we can create a new trend in the overshooting section.
#BTCUSD 1M
If the major uptrend continues until 2025, it is expected to start by creating a pull back pattern after rising to around 57014.33.
1st: 43833.05
2nd: 32992.55
-----------------

Support Zone: 168.46-171.63
Hello, traders.
If you "Follow", you can always get new information quickly.
Please click "Boost".
Have a nice day today.
-------------------------------------
(SOLUSDT.P 1M chart)
The important zones are three zones.
- 171.63
- 137.04-147.56
- 101.78
Therefore, you can trade depending on whether there is support near 171.63.
-
(1W chart)
The location of the BW (100) indicator is 202.68.
Therefore, the point to watch is whether it can rise from around 171.63 and rise above 202.68.
If not, since the HA-High indicator on the 1W chart is formed at the 168.46 point, we need to check for support around 168.46-171.63.
If it falls below 168.46, we need to check for support around 137.04-147.56.
-
(1D chart)
The HA-High indicator on the 1D chart is formed at the 179.77 point.
Therefore, the key is whether it can support around 179.77.
Currently, the StochRSI and StochRSI EMA indicators are in the overbought zone and the BW indicator is at the highest point (100).
Therefore, although it is showing strong upward strength, it will show a downward trend as the downward pressure increases over time.
At this time, the point to watch is whether it can receive support around 168.46-171.63.
If it receives support, I think it is highly likely that it will lead to an upward trend to rise above the 202.68 point as I mentioned earlier.
If not, and it falls, we should check whether there is support around 158.39, where the M-Signal indicator on the 1D chart is passing.
-
The arrow was created because the BW indicator touched the 100 point.
Since it has been maintaining the 100 point since then, the BW (100) line is not created.
If the price shows a downward trend, it will show a trend of creating the BW (100) line.
Therefore, it is recommended to proceed with trading according to the movement after the BW (100) line is created.
Therefore, it can be seen that the possibility of the BW (100) line being created at the 179.77 point is increasing.
Therefore, it is necessary to check whether it is possible to enter a short-term SHORT position.
-
Have a good time.
Thank you.
--------------------------------------------------
- Big picture
It is expected that a full-scale uptrend will begin after rising above 29K.
The section expected to be touched in the next bull market is 81K-95K.
#BTCUSD 12M
1st: 44234.54
2nd: 61383.23
3rd: 89126.41
101875.70-106275.10 (overshooting)
4th: 134018.28
151166.97-157451.83 (overshooting)
5th: 178910.15
These are points where resistance is likely to occur in the future.
We need to check if these points can be broken upward.
We need to check the movement when this section is touched because I think a new trend can be created in the overshooting section.
#BTCUSD 1M
If the major uptrend continues until 2025, it is expected to start forming a pull back pattern after rising to around 57014.33.
1st: 43833.05
2nd: 32992.55
-----------------
