Importance of the 20212.7-20357.0 section
Hello, traders.
If you "Follow", you can always get new information quickly.
Please also click "Boost".
Have a nice day today.
-------------------------------------
There may be differences in the support and resistance points I mentioned in the previous idea due to changes in the indicator you are using.
Please understand this.
------------------------------------------
Since indicators are expressed according to the movement of price or trading volume, it is not good to blindly trust indicators.
However, if you look at the movement of the indicator, you can have time to decide how to respond in the future.
In that sense, I think the StochRSI indicator is showing signs of creating a double bottom.
In the meantime, if it enters the oversold zone, I think it is highly likely that it will lead to an additional decline.
Therefore, if it falls from 20212.7, it is expected to fall to around 19823.6.
Therefore, whether there is support around 20212.7-20357.0 is an important issue.
The most important support and resistance area is around 19582.6.
-
Have a good time.
Thank you.
--------------------------------------------------
Supportandresistence

The beginning of trading begins with waitingHello, traders.
If you "Follow", you can always get new information quickly.
Please click "Boost".
Have a nice day today.
-------------------------------------
(BTCUSDT 1D chart)
There are indicators that are paired with indicators that show support and resistance points.
The HA-Low and HA-High indicators and the BW (0) and BW (100) indicators are paired.
- HA-Low, BW (0) indicators show the low range,
- HA-HIgh, BW 100) indicators show the high range.
Therefore, if it touches HA-HIgh or BW (100) and starts to decline, it is likely to touch HA-Low or BW (0), and you should think about a countermeasure.
If it encounters resistance at the HA-High indicator (67414.39) on the current 1D chart and starts to decline, it is likely to touch the HA-Low indicator (currently 56204.13) on the 1D chart.
However, you should be aware that the HA-Low indicator may move and be created as the price falls.
Since the BW (50) indicator exists between the BW (100) indicator and the BW (0) indicator, it cannot be said that a decline in the BW (100) indicator will necessarily touch BW (0).
Accordingly, the BW (50) indicator can replace the role of the BW (0) indicator.
The above explanation is the information required when utilizing the indicators on this chart.
-
The 65920.71-67414.39 section is a section composed of HA-HIgh indicators.
Therefore, the key is whether it can receive support and rise in this section.
If not, and it falls below 65602.01, there is a possibility that it will fall to around 61099.25.
However, since the M-Signal indicator on the 1W chart is passing around 62791.03, it is highly likely that it will touch around 62791.03 and rise, and you should consider a response plan.
-
Since the M-Signal indicator on the 1D chart is passing around 65920.71, it can be interpreted that it is currently shaking.
However, if it fails to rise above 67414.39, it is expected to eventually fall below 65602.01, so caution is required when trading.
-
We need to check whether the StochRSI indicator will enter the oversold zone with this decline.
If the STochRSI indicator has entered the oversold zone, there is a high possibility that the downward force will be strong, so it may lead to an additional decline.
Therefore, whether there is support around 65602.01-65920.71 is significant.
-
Based on the above, we can see that it is not the time to conduct a new transaction.
Therefore, in order to conduct a new transaction, we need to check whether the StochRSI indicator turns upward when it shows support around 65602.01-65920.71.
If not, and it falls, it can be seen that it is time to start trading when the HA-Low indicator or BW (0) indicator is newly created or when it is confirmed to be supported around 61099.25-62791.03.
-
If you create a trading strategy and start trading and the movement is in the opposite direction, then you should check the movement of the support and resistance points or indicators.
(SOLUSDT.P 1D chart)
That is, let's assume that you started trading by selling (SHORT) when the arrow indicating the appearance of the BW (100) indicator was created and the BW (100) line was created when it showed a downward trend, as in the SOL chart.
However, as the price rose, the BW (100) line disappeared and rose to around 171.63.
We should also think about countermeasures for this movement and start trading.
Even if you didn't think about it, you can see that the STochRSI indicator has entered the overbought zone, so it will eventually fall over time.
Therefore, you just need to decide whether to proceed with additional selling (SHORT) in the current rise or wait.
Since it is a futures transaction, the forced liquidation point is close, so you should consider this first and think about a response plan.
Since the StochRSI indicator touches the highest point (100), it cannot be said that the decline will begin immediately, so it is better to check the movement a little more.
Fortunately, the BW (100) line of the 1M chart currently exists at the 171.63 point, so it is expected that you can create a response strategy by checking whether there is support near 171.63.
-------------------------------------------------
You should continue trading even if the transaction fails.
Otherwise, you will lose your trading sense and it may not be easy to start trading again.
However, you should not start trading at any time.
You need to be able to wait for the right time to start trading, and when it's time to start trading, you need to start trading boldly.
(BTCUSDT.P 1D chart)
I started trading with the previous indicator chart, so it's a bit low entry price, but I'm maintaining a sell (SHORT) position at 68293.8.
Unlike the BTCUSDT chart, the BTCUSDT.P chart has a volume profile section formed at 66750.0.
Therefore, it is expected that it will be important whether it receives support or resistance around 66750.0-67392.1.
-
Have a good time.
Thank you.
--------------------------------------------------
- Big picture
It is expected that the real uptrend will start when it rises above 29K.
The next expected range to touch is 81K-95K.
#BTCUSD 12M
1st: 44234.54
2nd: 61383.23
3rd: 89126.41
101875.70-106275.10 (overshooting)
4th: 134018.28
151166.97-157451.83 (overshooting)
5th: 178910.15
These are points that are likely to receive resistance in the future.
We need to check if these points can be broken upward.
We need to check the movement when this range is touched because it is thought that a new trend can be created in the overshooting range.
#BTCUSD 1M
If the major uptrend continues until 2025, it is expected to start forming a pull back pattern after rising to around 57014.33.
1st: 43833.05
2nd: 32992.55
-----------------

The role of the StochRSI indicator
Hello, traders.
If you "Follow", you can always get new information quickly.
Please also click "Boost".
Have a nice day today.
-------------------------------------
Since the StochRSI indicator creates waves in any case, I think that using the StochRSI indicator can be of great help in predicting fluctuations.
In that sense, we decided to use the StochRSI indicator again in the evaluation items of the BW indicator.
If possible, we plan to finish modifying the indicator with this version.
The indicators used in this BW indicator are MACD, StochRSI, OBV, and ATR.
-----------------------------------------
(BTCUSDT.P 1D chart)
After the price fell after October 20, the StochRSI indicator eventually fell from the overbought zone.
After that, it is rapidly falling below the midpoint (50).
As such, the closer the StochRSI indicator gets to the highest point (100), the higher the possibility of a large fluctuation when falling.
Accordingly, you should check the position when entering the oversold zone or turning upward.
Currently, there is a support and resistance zone formed in the 65568.1-65922.3 zone, so the point to watch is whether it can receive support and rise near this zone.
If it falls below the 65568.1-65922.3 zone, you should check whether it can touch the BW (50) area or the M-Signal area of the 1W chart and rise.
To do so, you should check whether there is support near 61149.5-62839.8.
-
If it is supported and rises near the volume profile area of 66750.0,
1st: 67392.1
2nd: 68447.9-69020.1
You should check whether it is supported near the 1st and 2nd above.
-
If it touches BW (100) and falls, it is likely to touch BW (0).
However, since it can rebound near BW (50), you can start trading depending on whether there is support near BW (50) for now.
Since the BW (50) point on the 1W chart is formed at the 65568.1 point, when it shows support near 65568.1-65922.3, you should check whether the StochRSI indicator rises above the midpoint (50) and maintains the state of StochRSI > StochRSI EMA.
-
When the StochRSI indicator rises above the midpoint (50), you should start looking for a time to sell, and when it falls below the midpoint (50), you should start looking for a time to buy.
The critical time is when it rises in the oversold zone or falls in the overbought zone.
-
Since the StochRSI indicator is showing a faster decline than the price, it seems likely to create a pullback pattern.
If the BW indicator falls below the midpoint (50), the price may plunge, so be careful.
-
Have a good time.
Thank you.
--------------------------------------------------
- Big picture
The real uptrend is expected to start after rising above 29K.
The next bull market is expected to touch 81K-95K.
#BTCUSD 12M
1st: 44234.54
2nd: 61383.23
3rd: 89126.41
101875.70-106275.10 (overshooting)
4th: 134018.28
151166.97-157451.83 (overshooting)
5th: 178910.15
These are points where resistance is likely to occur in the future.
We need to check if these points can be broken upward.
We need to check the movement when this section is touched because I think a new trend can be created in the overshooting section.
#BTCUSD 1M
If the major uptrend continues until 2025, it is expected to start forming a pull back pattern after rising to around 57014.33.
1st: 43833.05
2nd: 32992.55
-----------------

Need to check support and resistance zones
Hello, traders.
If you "Follow", you can always get new information quickly.
Please click "Boost" as well.
Have a nice day today.
-------------------------------------
(BTCUSDT 1D chart)
The HA-High indicator is being created at the 67414.39 point, showing support.
Therefore, the key is whether it can be supported around 67074.14-67414.39 and rise above 68955.88.
If not,
1st: 65920.71
2nd: 61099.25-62540.0
You need to check whether there is support around the 1st and 2nd above.
Currently, the M-Signal indicator of the 1D chart is passing near 65920.71, and the M-Signal indicator of the 1W chart is passing near 62540.0.
Therefore, whether there is support near the 1st and 2nd is meaningful in terms of the trend.
---------------------------------------------
When drawing a trend line, the point that the arrow points to corresponds to the point selected when drawing the trend line.
The points 1 and 2 indicated on the StochRSI indicator are inflection points that do not enter the overbought or oversold zone, so they are not used when drawing the trend line.
You can display the volatility period according to the currently drawn trend line and the support and resistance points drawn on the 1M, 1W, and 1D charts.
For the reason for selecting the volatility period, please refer to the part indicated by the circle.
Accordingly, the volatility period is around October 25, October 30, and November 12.
The volatility period I mentioned is just for explanation.
In reality, we need trend lines drawn from the past on the 1M, 1W, and 1D charts.
The importance of trend lines is in the order of 1M > 1W > 1D chart trend lines.
-
Have a good time.
Thank you.
--------------------------------------------------
- Big picture
It is expected that a full-scale uptrend will start when it rises above 29K.
The section expected to be touched in the next bull market is 81K-95K.
#BTCUSD 12M
1st: 44234.54
2nd: 61383.23
3rd: 89126.41
101875.70-106275.10 (overshooting)
4th: 134018.28
151166.97-157451.83 (overshooting)
5th: 178910.15
These are points where resistance is likely to occur in the future.
We need to check if these points can be broken upward.
We need to check the movement when this section is touched because I think a new trend can be created in the overshooting section.
#BTCUSD 1M
If the major uptrend continues until 2025, it is expected to start forming a pull back pattern after rising to around 57014.33.
1st: 43833.05
2nd: 32992.55
-----------------

Example of creating a trading strategy chart
Hello, traders.
If you "Follow", you can always get new information quickly.
Please click "Boost" as well.
Have a nice day today.
-------------------------------------
To interpret the chart from a trend perspective, you can use the MS-Signal indicator.
The MS-Signal indicator consists of the M-Signal indicator and the S-Signal indicator.
Therefore, you can analyze the chart by checking the arrangement of the M-Signal indicator and the movement around it.
The most important thing in chart analysis is support and resistance points.
Therefore, if you do not indicate support and resistance points, it can be said that the chart analysis cannot be used for trading.
-
So, Fibonacci retracement and trend-based Fibonacci extension are widely used in chart analysis.
I used the Trend-Based Fib Extension tool.
I selected and displayed the low and high points pointed by the fingers.
The selection of the candles pointed by the fingers corresponds to the inflection points of the StochRSI indicator.
-
If you connect these, you get a trend line.
The important thing when drawing a trend line is to connect the high points of the StochRSI indicator by connecting the opening prices of the falling candles.
When connecting the low points, you can connect the low points regardless of whether it is a falling candle or an rising candle.
This is because I think it best expresses the trend and volatility period based on my experience using it.
When drawing the Fibonacci ratio and when drawing the trend line, the selection points are different, so you should draw it with this in mind.
-
If it is drawn as above, you can see that the chart is ready to be analyzed.
Since the channeling most commonly used in chart analysis has been formed, I think chart analysis will not be difficult.
However, the above method is a drawing for chart analysis, so it is not suitable for trading.
This is an important point.
If you are good at chart analysis, but wonder why you lose money when trading, you should change the drawing of support and resistance points.
Do not trade with Fibonacci ratios, but mark support and resistance points according to the candle arrangement on the 1M, 1W, and 1D charts and create a trading strategy according to their importance.
-
The chart above shows the support and resistance points drawn on the 1M, 1W, and 1D charts.
To display this, we used the HA-High, HA-Low, OBV 0, OBV Up, OBV Down, BW (100), Mid (50), BW (0) indicators.
To display the exact volatility period, we also need to draw a trend line on the 1M, 1W chart.
The indicators that are important for support and resistance points are HA-Low, HA-High, BW (100), BW (0).
Therefore, the point where the trend line intersects this point is likely to correspond to the volatility period.
It is not accurate because it is displayed only with the trend line that was created right away, but I think it explains well how to display the volatility period.
-
If you display the volatility period like this and hide all indicators, you will have a complete chart that can be used for trading.
-
Have a good time.
Thank you.
--------------------------------------------------

The importance of explanation of the basis
(Title) The important thing in chart analysis is the explanation of the basis.
Hello, traders.
If you "Follow", you can always get new information quickly.
Please click "Boost" as well.
Have a nice day today.
-------------------------------------
You need to read the explanation below to understand the points, sections, and volatility periods that I'm talking about.
However, for those who don't need that, I'll briefly explain it first.
Support section
1st: 65920.71-67414.39
2nd: 61099.25-62540.0
Resistance section
68955.88-72078.1
The next volatility period is around November 7th, so the point to watch is which section of the section I mentioned above it is located in after passing this volatility period.
-------------------------------------------------
(BTCUSDT 1D chart)
The StochRSI indicator is showing a downward trend after approaching the highest point (100).
The StochRSI indicator used in this chart is an indicator created by changing the formula of the general StochRSI indicator, so there may be a slight difference from the StochRSI indicator you are actually using.
The setting values of the StochRSI indicator are 14, 7, 3, 3 (RSI, Stoch, K, D).
In any case, since the StochRSI indicator is showing a downward trend, it seems likely to lead to an additional decline.
However, if the StochRSI indicator has not fallen from the overbought zone, there is a possibility of a rebound, so it is necessary to check the support and resistance points formed at the current price position.
The current price seems to be located near the Mid (50) indicator and the HA-HIgh indicator is about to be newly created.
Therefore, if the HA-High indicator is created at the 67414.39 point, the support around that point is an important issue.
Since the HA-High indicator of the 1W chart is formed at the 65920.71 point, we can see that the important section is around 65920.71-67414.39.
-
If the HA-HIgh indicator of the 1D chart is newly created, the HA-High of the 1D chart > HA-High of the 1W chart > HA-High of the 1M chart, so the regular array of the M-Signal indicator, which is a trend perspective, is expected to create a regular array from the post-trading perspective as well.
If this regular array state is created, it is more likely to create a new upward wave, so it is more advantageous to look at the market from a long (LONG) perspective.
Therefore, it is expected that the important point of observation will be where support is received at this initialization of the StochRSI indicator.
The initialization of the StochRSI indicator means moving from the overbought section -> oversold section, oversold section -> overbought section.
When this initialization process is performed,
- When falling from the overbought section,
- When located in the middle point,
- When rising from the oversold section,
Volatility is likely to occur when passing through the three areas above.
-
Considering the importance of support and resistance points, the movement of the StochRSI indicator, and the M-Signal indicator, it is expected that the upward trend will continue if the price is maintained above 62540.0.
If possible, we should check if it can be supported and rise near 65920.71-67414.39.
If the BW (100) indicator on the 1D chart is not regenerated, it is expected that a full-scale uptrend will begin only when it rises above 72078.1.
Therefore, from the current price position, it is expected that how it will break through the 68955.88-72078.1 range will have a major impact on the future trend.
The next volatility period is around November 7.
-
(1W chart)
If you look at the 1W chart, you can see a clearer movement than the 1D chart.
------------------------------------------
I think trading is classifying the support and resistance points drawn on the 1M, 1W, and 1D charts according to importance and creating a trading strategy accordingly.
This is what I said in the previous idea about why support and resistance points are important.
In order to classify the importance, you need to look at how densely the candles are arranged.
In other words, you need to look at how many sideways sections are created.
You can also use the Renko chart for this.
If you share and use this chart, the HA-High, HA-Low, BW (100), and BW (0) indicators form the most important support and resistance points when trading.
And the next important indicators are the Mid (50) and OBV 0 indicators.
To check this, draw the indicators formed on the 1M, 1W, and 1D charts, and they will immediately act as support and resistance points.
-
Although the coin market is a market that follows trends, you cannot know everything from the trend.
In other words, you need support and resistance points and the StochRSI indicator to check volatility.
If you don't check this, I don't think it's easy to check volatility.
I explained how to check trend lines and volatility periods with the previous idea.
I'll take the time to explain it again next time.
-
Have a good time.
Thank you.
--------------------------------------------------
- Big picture
It is expected that a full-scale uptrend will start when it rises above 29K.
The section expected to touch in the next bull market is 81K-95K.
#BTCUSD 12M
1st: 44234.54
2nd: 61383.23
3rd: 89126.41
101875.70-106275.10 (overshooting)
4th: 134018.28
151166.97-157451.83 (overshooting)
5th: 178910.15
These are points where resistance is likely to occur in the future.
We need to check if these points can be broken upward.
We need to check the movement when this section is touched because I think a new trend can be created in the overshooting section.
#BTCUSD 1M
If the major uptrend continues until 2025, it is expected to start forming a pull back pattern after rising to around 57014.33.
1st: 43833.05
2nd: 32992.55
-----------------

Configuring channeling between indicators
Configuring channeling between indicators (StochRSI, BW reference)
Hello, traders.
If you "Follow", you can always get new information quickly.
Please click "Boost" as well.
Have a nice day today.
-------------------------------------
(BTCUSDT 1D chart)
From September 22 to 28, the StochRSI indicator was maintained at the highest point (100).
Since October 16, the StochRSI indicator has risen above 99.
Accordingly, there may be additional increases.
At this time, the point of observation is whether it can rise to the vicinity of 71280.01-72078.1.
It is expected that the StochRSI indicator will have to rise above 68955.88 to touch the highest point (100).
I think that the longer the StochRSI indicator stays in the overbought zone, the stronger the downward pressure becomes.
Therefore, this pressure is likely to appear as a sharp change in the StochRSI indicator.
The StochRSI indicator cannot tell the fluctuation range.
Therefore, we can only make predictions by referring to the important support and resistance points drawn on the 1M, 1W, and 1D charts.
-
In order for BTC to continue its full-scale upward trend, the price must be maintained above the HA-HIgh indicator.
Accordingly, from the current perspective, the price must be maintained above 61099.25-65920.71.
-
(1M chart)
It seems that the change started on the 1M chart.
Accordingly, we need to look at the section where a new candle is created.
From the current perspective, the BW (100) line is created at 68955.88, 71280.01, and 72078.1.
Therefore, these points may correspond to resistance sections.
Breaking through this point upward means renewing the high section, which increases the possibility of creating a new wave.
-
New indicators called OBV Up and OBV Down have been added.
These indicators also display the high and low sections.
It is expected to be useful when creating detailed trading strategies and response strategies.
-
The HA-Low, HA-High, BW (0), and BW (100) indicators display the low and high sections, respectively.
Therefore, the basic trading method is to buy at the HA-Low, BW (0) point and sell at the HA-High, BW (100) point.
Therefore, the HA-Low ~ HA-High, BW (0) ~ BW (100) section can be considered as the box section.
A trend can be considered to be formed only when this section is exceeded.
The box section consisting of the HA-Low ~ HA-High, BW (0) ~ BW (100) section can be considered as channeling in a broad sense.
-
(Renko 1D chart)
If the price is maintained above 68K, it is highly likely to create a new wave.
This makes it more likely to break out of the downward sideways movement.
If it falls below 68K, it is necessary to check whether it is supported around 58K-62K.
----------------------------------------------------
(BTCUSDT.P 1D chart)
The key to futures trading is forced liquidation.
Therefore, I think how to close the transaction before being forced liquidated is an important issue.
In order to make a big profit, you need to set the leverage or investment ratio high.
However, you need to make a careful decision because the forced liquidation point is getting closer.
-
If you traded as a sell (SHORT) at the 69001.8 point, and the price rises, and the forced liquidation point is formed above the 72153.8 point, I think you can maintain the sell (SHORT) position.
The reason is that the StochRSI indicator has entered the overbought zone and is close to the highest point (100).
In this situation, I think the term used is rising short (increasing the proportion of SHORT positions when the price rises).
The opposite is falling long (increasing the proportion of LONG positions when the price falls).
You need to respond according to your forced liquidation point.
If possible, in futures trading, it is good for your mental health to start trading with one buy (LONG) and sell (SHORT) and cut your loss when the opposite movement occurs.
-
Currently, the M-Signal of the 1D chart > M-Signal of the 1W chart > M-Signal of the 1M chart, that is, a regular array.
In this case, it is better to trade with a buy (LONG) position.
However, when the StochRSI indicator is in the overbought zone as it is now, it is not the time to start trading with a buy (LONG) position.
-
Have a good time.
Thank you.
--------------------------------------------------
- Big picture
It is expected that the real uptrend will start after rising above 29K.
The section expected to be touched in the next bull market is 81K-95K.
#BTCUSD 12M
1st: 44234.54
2nd: 61383.23
3rd: 89126.41
101875.70-106275.10 (when overshooting)
4th: 134018.28
151166.97-157451.83 (when overshooting)
5th: 178910.15
These are the points where resistance is likely to be encountered in the future. We need to see if we can break through these points.
We need to see the movement when we touch this section because I think we can create a new trend in the overshooting section.
#BTCUSD 1M
If the major uptrend continues until 2025, it is expected to start by creating a pull back pattern after rising to around 57014.33.
1st: 43833.05
2nd: 32992.55
-----------------

The start of a new wave: 2630.0-2772.42
Hello, traders.
If you "Follow", you can always get new information quickly.
Please also click "Boost".
Have a nice day today.
-------------------------------------
The support and resistance points are likely to have changed due to changes in the indicator formula.
Please note this.
------------------------------------------
Fibonacci-related chart tools are used for chart analysis.
Therefore, you should be aware that the support and resistance points drawn using the arrangement of candles on the 1M, 1W, and 1D charts are different.
-
(ETHUSDT 12M chart)
ETH is one of the coins expected to show a larger increase than BTC.
Therefore, I think it is a coin that is worth investing in long term along with BTC.
The most important volume profile section on the 12M chart is 736.42.
-
(1M chart)
The HA-High indicator on the 1M chart is formed at 3321.30.
Therefore, in order for a full-fledged uptrend to begin, the price must be maintained above the HA-High indicator on the 1M chart.
The current point of interest is whether it can be supported and rise near the MS-Signal indicator.
If the MS-Signal indicator falls,
1st: 2159.0
2nd: 1.585.33
We need to check whether there is support near the 1st and 2nd above.
-
(1W chart)
Since there are many lines, it can be dizzying, so I marked important support and resistance zones with circles.
Therefore, you can create chart analysis or trading strategies centered on the zones marked with circles.
The current 2630.0-2772.42 zone is supported, and the key is whether it can rise above 3014.05.
-
(1D chart)
I think you can see if the current zone, that is, the 2630.0-2772.42 zone, is an important support and resistance zone.
Therefore, the key is whether it can rise above the current zone.
However, since the current StochRSI indicator is located near the highest point (100) of the overbought zone, the pressure for a decline will increase over time.
Therefore, the point to watch is how the StochRSI indicator is initialized.
In other words, when the StochRSI indicator falls from the overbought zone to the oversold zone or rises from the oversold zone to the overbought zone, it is called initialization.
If the price is maintained around 2630.0-2772.42 when initialization is performed like this, it is expected to create a new rising wave.
To do so, it is possible that it will rise to around 3014.04 and then fall, or fall below 2630.0-2772.42 and then rise again.
Of course, it can move sideways like this.
In any case, the price position is an important key point when the StochRSI indicator is initialized.
-
Since the M-Signal indicator of the 1W, 1M chart is passing through the 2630.0-2772.42 section, it is expected that a new rising wave will be created if the M-Signal indicator of the 1D chart rises above the 2630.0-2772.42 section.
Therefore, I think it is highly likely that it will be the last buying section before the new wave starts.
-
Have a good time.
Thank you.
--------------------------------------------------
- Big picture
It is expected that a full-scale uptrend will start when it rises above 29K.
The section expected to be touched in the next bull market is 81K-95K.
#BTCUSD 12M
1st: 44234.54
2nd: 61383.23
3rd: 89126.41
101875.70-106275.10 (overshooting)
4th: 134018.28
151166.97-157451.83 (overshooting)
5th: 178910.15
These are points where resistance is likely to occur in the future.
We need to check if these points can be broken upward.
We need to check the movement when this section is touched because I think a new trend can be created in the overshooting section.
#BTCUSD 1M
If the major uptrend continues until 2025, it is expected to start forming a pull back pattern after rising to around 57014.33.
1st: 43833.05
2nd: 32992.55
-----------------

Why Support and Resistance Points Are Important
Hello, traders.
If you "Follow", you can always get new information quickly.
Please click "Boost".
Have a nice day today.
-------------------------------------
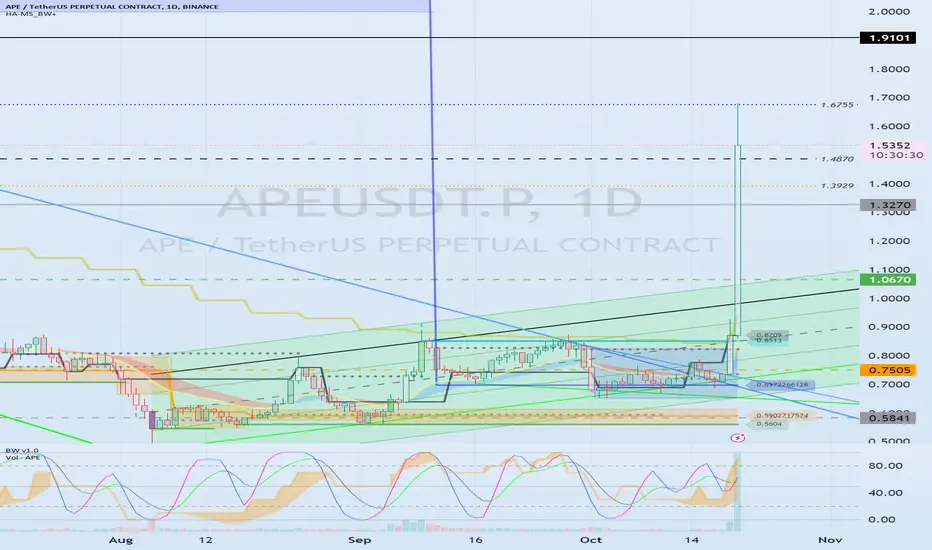
(APEUSDT.P 1M chart)
Usually, the arrangement of candles is used to indicate support and resistance points.
Basically, indicators are used to indicate support and resistance points.
However, I feel like support and resistance points are needed in the 1.9101-6.7780 range.
So, there is a possibility that support and resistance points are drawn near where the fingers are pointing.
The price is currently under 1.9101, so let's check it out on another time frame chart.
In any case, the point to watch is whether it can rise after receiving support in the 1.3270-1.9101 section.
-
(1W chart)
When drawing support and resistance points using indicators, it is best to draw indicators that are currently marked with candles.
This is because it means that the current point is acting as support and resistance.
Other than that, you can mark indicators that are thought to have a longer horizontal line than other horizontal lines.
If you check the chart above, I think you'll understand what I mean.
Since the important support and resistance points are indicators that are currently marked with candles, you can create a trading strategy targeting the corresponding horizontal lines.
The sections marked as Support and Resistance on the chart correspond to those.
You can think of the remaining lines as lines that can be used for detailed strategies that allow you to conduct split transactions when conducting transactions.
In that sense, the 1.4870 point can be used for detailed trading strategies, that is, response strategies.
Accordingly, you can proceed with buying or selling.
-
(1D chart)
The support and resistance points to be used for detailed trading strategies are indicated in the 1.320-1.9101 section.
That is, the points 1.3929 and 1.6755 are applicable.
These two points correspond to the HA-Low and HA-High indicator points.
-------------------------------------------------
If you have indicated support and resistance points on the 1M, 1W, and 1D charts as above, you can mark them according to the importance of the support and resistance points and create chart analysis or trading strategies for them.
Important support and resistance points are
1st: 0.5841-0.7505
2nd: 1.0670
3rd: 1.3270
4th: 1.9101-2.1090
You can use the points or sections above to create chart analysis or trading strategies.
When marking support and resistance points, do not draw them while thinking about chart analysis or trading strategies.
The reason is that if you do so, you will likely mark support and resistance points while reflecting your subjective thoughts and psychology.
Therefore, when marking support and resistance points, it is important to focus only on the arrangement of candles without thinking about anything else.
-
Have a good time.
Thank you.
--------------------------------------------------
- Big picture
It is expected that a full-scale uptrend will begin when it rises above 29K.
The section expected to touch the next bull market is 81K-95K.
#BTCUSD 12M
1st: 44234.54
2nd: 61383.23
3rd: 89126.41
101875.70-106275.10 (overshooting)
4th: 134018.28
151166.97-157451.83 (overshooting)
5th: 178910.15
These are points where resistance is likely to occur in the future.
We need to check if these points can be broken upward.
We need to check the movement when this section is touched because I think a new trend can be created in the overshooting section.
#BTCUSD 1M
If the major uptrend continues until 2025, it is expected to start forming a pull back pattern after rising to around 57014.33.
1st: 43833.05
2nd: 32992.55
-----------------
Example of conditions for Chase the Rally
Hello, traders.
If you "Follow", you can always get new information quickly.
Please also click "Boost".
Have a nice day today.
-------------------------------------
(SUIUSDT.P 1D chart)
It is necessary to check whether it can fall from the 2.2492 point and rise with support near the HA-High indicator (2.0299) on the 1D chart.
Since the StochRSI indicator has entered the oversold zone, it is showing a strong downward trend.
Therefore, it is highly likely that it will continue to fall further, so caution is required when trading.
If it falls below 2.0299,
1st: 1.8735-1.9073
2nd: 1.6124
You need to check whether there is support near the 1st and 2nd above.
Therefore, from a short-term and medium-term perspective, if the price is maintained above 1.6124, it is a time for additional purchase.
In other words, I think it is a time when Chase the Rally is possible.
At this time, if the Mid (50) line or HA-Low indicator is created and shows support, it will give you strength to proceed with additional purchase.
-
The important thing to proceed with Chase the Rally is that the long-term moving average line is in a regular array.
If not, it should be considered as a purchase, not Chase the Rally.
In this chart, the M-Signal line of the 1W and 1M charts corresponds to the medium- to long-term moving average line.
--------------------------------------------
(1h Chart)
If you touch the 5EMA of the 1D chart or the M-Signal of the 1D, 1W, 1D chart, there is a high possibility of volatility.
Therefore, you can start trading depending on whether there is support around here.
However, since the 5EMA of the 1D chart or the M-Signal of the 1D, 1W, 1D chart is for viewing trends, you should draw support and resistance points on the 1M, 1W, 1D charts and check whether there is support around those points and respond.
Since the current chart is a 1h chart, if there are no support and resistance points drawn on the 1M, 1W, 1D charts, you can start trading with the support and resistance points of the 1h chart.
However, a short and quick response is required.
-
The StochRSI indicator is showing signs of forming a double top.
Therefore, if it falls below 2.088-2.0238, it is likely to touch around 1.8735-1.9073.
If the StochRSI indicator is reset while falling to the oversold zone, and the price maintains around the M-Signal line on the 1D chart, I think it is highly likely to turn upward.
-
Reflecting this movement, it is expected that the trend will be formed depending on which direction it deviates from the box range (1.9752-2.0761) of the HA-Low indicator.
-
Have a good time.
Thank you.
--------------------------------------------------
- Big picture
It is expected that a full-scale uptrend will begin when it rises above 29K.
The next expected range to touch is 81K-95K.
#BTCUSD 12M
1st: 44234.54
2nd: 61383.23
3rd: 89126.41
101875.70-106275.10 (overshooting)
4th: 134018.28
151166.97-157451.83 (overshooting)
5th: 178910.15
These are points that are likely to receive resistance in the future.
We need to check if these points can be broken upward.
We need to check the movement when this range is touched because it is thought that a new trend can be created in the overshooting range.
#BTCUSD 1M
If the major uptrend continues until 2025, it is expected to start forming a pull back pattern after rising to around 57014.33.
1st: 43833.05
2nd: 32992.55
-----------------

The Coin Market is Different from the Stock Market
Hello, traders.
If you "Follow", you can always get new information quickly.
Please also click "Boost".
Have a nice day today.
-------------------------------------
The coin market discloses a lot of information compared to the stock market.
Among them, it discloses the flow of funds.
Most of the funds in the coin market are flowing in through USDT, and it can be said that it currently manages the largest amount of funds.
Therefore, unlike the stock market, individual investors can also roughly know the flow of funds.
Therefore, you can see that it is more transparent than other investment markets.
-
USDT continues to update its ATH.
You can see that funds are continuously flowing into the coin market through USDT.
USDC has been falling since July 22 and has not yet recovered.
The important support and resistance level of USDC is 26.525B.
Therefore, if it is maintained above 26.525B, I think there is a high possibility that funds will flow in.
If you look at the fund size of USDT and USDC, you can see that USDT is more than twice as high.
Therefore, it can be said that USDT is the fund that has a big influence on the coin market.
USDC is likely to be composed of US funds.
Therefore, if more funds flow in through USDC, I think the coin market is likely to develop into a clearer investment market.
But it is not all good.
This is because the more the coin market develops into a clearer investment market, the more likely it is to be affected by the existing investment market, that is, the watch market.
This is because large investment companies are working to link the coin market with the coin market in order to make the coin market an investment product that they can operate.
In order for the coin market to be swayed by the coin-related investment product launched in the stock market, more funds must flow into the coin market through USDC.
Otherwise, it is highly likely that it will eventually be swayed by the flow of USDT funds.
Therefore, USDC is likely to have a short-term influence on the coin market at present.
-
As mentioned above, the most important thing in the investment market is the flow of funds.
The flow of funds in the coin market can be seen as maintaining an upward trend.
Therefore, there are more and more people who say that there are signs of a major bear market these days, but their position seems to be judging the situation from a global perspective and political perspective.
As mentioned above, the funds that still dominate the coin market are USDT funds, which are an unspecified number of funds.
Therefore, I think that the coin market should not be predicted based on global perspectives and political situations.
The start of the major bear market in the coin market is when USDT starts to show a gap downtrend.
Until then, I dare say that the coin market is likely to maintain its current uptrend.
------------------------------------
(BTCUSDT 1D chart)
The StochRSI indicator is approaching its highest point (100), and the uptrend is reaching its peak.
Accordingly, the pressure to decline will increase over time.
-
(1W chart)
The StochRSI indicator is also in the overbought zone on the 1W chart.
-
(1M chart)
On the 1M chart, the StochRSI indicator is showing signs of entering the overbought zone, but it is not expected to enter the oversold zone due to the current rise.
The movement of the 1M chart should be checked again when a new candle is created.
-
You can see that the StochRSI indicator on the 1M chart is the most unusual among the three charts above.
In the finger area on the 1M chart, the StochRSI indicator was in the overbought zone, but it is currently showing signs of entering the oversold zone.
Therefore, you can see that the current movement is different from the past movement.
Therefore, I think it is not right to predict the current flow by substituting past dates.
------------------------------------------
I wrote down my thoughts on the recent comments from famous people who say that the coin market will enter a major bear market along with the stock market.
-
Have a good time. Thank you.
--------------------------------------------------
- Big picture
It is expected that the real uptrend will start after rising above 29K.
The section expected to be touched in the next bull market is 81K-95K.
#BTCUSD 12M
1st: 44234.54
2nd: 61383.23
3rd: 89126.41
101875.70-106275.10 (overshooting)
4th: 134018.28
151166.97-157451.83 (overshooting)
5th: 178910.15
These are points where resistance is likely to be encountered in the future. We need to see if we can break through these points.
We need to see the movement when we touch this section because I think we can create a new trend in the overshooting section.
#BTCUSD 1M
If the major uptrend continues until 2025, it is expected to start by creating a pull back pattern after rising to around 57014.33.
1st: 43833.05
2nd: 32992.55
-----------------

No matter what you do, the basic chart is the 1D chart
Hello, traders.
If you "Follow", you can always get new information quickly.
Please click "Boost" as well.
Have a nice day today.
-------------------------------------
In order to analyze the chart, you will use various chart tools.
However, if there are no support and resistance points drawn on the 1M, 1W, and 1D charts, you will find that it is difficult to conduct actual trading.
In order to explain how the trend changes when there is a certain movement at the support and resistance points shown on the chart, I provided a basis by using chart tools.
However, if you trust the support and resistance points drawn on the chart, you do not need to use various chart tools separately to find such basis.
--------------------------------------
The 64748.70-65920.71 section is formed by the HA-High indicator of the 1D, 1W charts.
Therefore, if it is supported and rises in this section, it is highly likely to show a stepwise uptrend.
If it falls in the 64748.70-65920.71 section, it is highly likely to touch the HA-Low indicator.
-
BW (100) point of the 1W chart: 68393.48
BW (100) point of the 1M chart: 71280.01
BW (100) point of the 1D chart: 73072.41
BW (100) lines are formed at the above points.
The formation of the BW (100) line means that the MACD, DMI, and OBV indicators are showing strength.
Therefore, just like the HA-High indicator, the BW (100) point can be said to have shown a high point range.
Therefore, if it rises above the BW (100) point, it can be seen that there is a high possibility of a strong upward trend.
-
In this sense, we can see that the current high point range is the 61099.25-73072.41 range.
Since the HA-High indicator or the BW (100) point moves and is created by volatility over time, we should carefully observe when there is a change in the high point range.
This is because at that time, there is a high possibility of creating a new wave.
-
The lines that make up the MS-Signal indicator are M-Signal and S-Signal.
Of these two lines, the important line is M-Signal.
Therefore, the M-Signal lines on the 1M, 1W, and 1D charts serve to indicate trends.
It was created so that you can see the overall trend on any time frame chart.
Therefore, the current indicator (HA-MS) can be said to be an indicator that expresses everything.
-
You can mark the HA-Low, HA-High, BW (0), BW (100), and Mid (50) points on the 1M, 1W, and 1D charts and use them as support and resistance points on the time frame charts you mainly trade.
As I mentioned earlier, you can check the arrangement of the M-Signal lines on the MS-Signal indicator and create a trading strategy that matches the trend.
It is recommended to start trading when the price is maintained above the M-Signal line on the 1M chart at least.
If possible, it is better to start trading when the price is maintained above the M-Signal of the 1W chart when the M-Signal of the 1W chart > the M-Signal of the 1M chart.
(ETHUSDT 1D chart)
Therefore, ETH is currently not a good state to trade.
-
The StochRSI indicator seems to be showing a downward trend.
However, it has not yet fallen from the overbought zone or has not yet turned into a state where StochRSI < StochRSI EMA, so it should be interpreted that the current upward strength is strong.
Therefore, caution is required when trading because there is a possibility of further increase.
In any case, the 64748.70-65920.71 range is formed at the current price position, so the key is whether it can be supported and rise near this range.
-
Have a good time.
Thank you.
--------------------------------------------------
- Big picture
It is expected that the real uptrend will start after rising above 29K.
The section expected to be touched in the next bull market is 81K-95K.
#BTCUSD 12M
1st: 44234.54
2nd: 61383.23
3rd: 89126.41
101875.70-106275.10 (when overshooting)
4th: 134018.28
151166.97-157451.83 (when overshooting)
5th: 178910.15
These are the points where resistance is likely to be encountered in the future. We need to see if we can break through these points.
We need to see the movement when we touch this section because I think we can create a new trend in the overshooting section.
#BTCUSD 1M
If the major uptrend continues until 2025, it is expected to start by creating a pull back pattern after rising to around 57014.33.
1st: 43833.05
2nd: 32992.55
-----------------

The start of a new wave: 68447.9
Hello, traders.
If you "Follow", you can always get new information quickly.
Please click "Boost" as well.
Have a nice day today.
-------------------------------------
(BTC.D 1M chart)
BTC dominance is rising above 58.
The point to watch is whether it can face resistance in the 55.01-62.47 range and fall.
If it rises above 62.47, a strange market where only BTC rises may be formed.
Most altcoins are expected to gradually move sideways or show a downward trend.
---------------------------------------
(USDT.D 1M chart)
A decline in USDT dominance is likely to lead to a rise in the coin market.
However, as I mentioned in the explanation of BTC dominance, I think that most coins in the coin market will show an upward trend only when BTC dominance also declines along with USDT dominance.
If USDT dominance falls below 4.97, the coin market is expected to enter a bull market.
The point of interest is whether a market where only BTC rises or a bull market where altcoins also rise will be created.
------------------------------------------
(BTCUSDT.P 1D chart)
- The 68447.9 point is the BW (100) point of the 1W chart,
- The 71363.0 point is the BW (100) point of the 1M chart,
- The 73127.6 point is the BW (100) point of the 1D chart.
Therefore, we should consider the above points as forming support and resistance points.
If the price rises above the downtrend line (2) and maintains, it is expected to create a new wave.
Therefore, whether there is support near 68447.9 is an important key point.
-
The StochRSI indicator is approaching the highest point (100) and the slope is becoming gentle.
Accordingly, the pressure for a downtrend will increase over time.
In order to overcome this downward pressure and create a new upward wave, it is expected that it will be possible to show a sideways movement in the 68447.9-71363.0 range.
Therefore, the point of interest is how the StochRSI indicator performs the initialization process.
(The initialization process of the StochRSI indicator refers to moving from the overbought range to the oversold range, and also from the oversold range to the overbought range.)
-
(1h chart)
The BW (100) point is formed at the 67800.5 point and is showing a downward trend.
The Mid (50) point is formed at the 67064.5 point.
Therefore, we need to check whether there is support near 67064.5-67349.7.
If it falls below 67064.5, it is likely to touch 5EMA on the 1D chart or around 65568.1-65922.3.
If it touches 5EMA on the 1D chart and M-Signal indicators on the 1D, 1W, and 1M charts, it is highly likely to cause volatility.
Therefore, caution is required when trading as there is a possibility of creating a new wave.
-
The StochRSI indicator is showing signs of entering the oversold zone.
Accordingly, when it rises after entering the oversold zone, it is necessary to check at what point it is receiving support and resistance.
In that sense, whether there is support around 67064.5-67349.7 is important.
-
If the StochRSI indicator enters the oversold zone while the BW indicator does not fall below the midpoint (50), it is likely to show a decline such as a pullback or price adjustment and rise again, so it is good to note.
The most ambiguous part in interpreting the BW indicator is when it is at the midpoint (50).
Therefore, when the BW indicator is at the midpoint (50), it is better to think about a response plan for the coin you are currently trading rather than conducting a new transaction.
------------------------------------
I placed a reservation order to liquidate a buy (LONG) position at the 68447.9 point, but it was not executed.
I think this is a part where you can see that the downtrend line (2) is an important trend line.
If you do not break through the trend line (2) strongly, it is expected that the breakout will fail.
-
Have a good time.
Thank you.
--------------------------------------------------
- Big picture
It is expected that the real uptrend will start after rising above 29K.
The section expected to be touched in the next bull market is 81K-95K.
#BTCUSD 12M
1st: 44234.54
2nd: 61383.23
3rd: 89126.41
101875.70-106275.10 (when overshooting)
4th: 134018.28
151166.97-157451.83 (when overshooting)
5th: 178910.15
These are the points where resistance is likely to be encountered in the future. We need to see if we can break through these points.
We need to see the movement when we touch this section because I think we can create a new trend in the overshooting section.
#BTCUSD 1M
If the major uptrend continues until 2025, it is expected to start by creating a pull back pattern after rising to around 57014.33.
1st: 43833.05
2nd: 32992.55
-----------------

Support Zone: 64748.70-65920.71
Hello, traders.
If you "Follow", you can always get new information quickly.
Please click "Boost" as well.
Have a nice day today.
-------------------------------------
(BTCUSDT 1D chart)
The M-Signal indicator on the 1D, 1W chart is formed in the 64748.70-65920.71 zone.
Therefore, if the price is maintained above this zone, there is a high possibility that a stepwise uptrend will begin.
Therefore, the point to watch is whether it rises along the trend line (1) and maintains the price above 68393.48 after around November 4th.
If it rises above that, you should check for support near 71280.01.
-
The StochRSI indicator has currently entered the overbought zone.
The rise to the overbought zone means that the upward trend is strong.
Therefore, you should be careful when trading because there is a possibility that the upward trend will continue until it falls from the overbought zone.
However, if the slope of the StochRSI indicator becomes gentle, the possibility of a downward turn increases, so you should think about a response plan for the decline.
When this movement is shown, you should check if there are support and resistance points drawn on the 1M, 1W, and 1D charts, and if so, whether they are supported or resisted at those points.
If you do not have support and resistance points drawn by yourself, there is no need to draw additional support and resistance points and create a response strategy.
The reason is that additional support and resistance points or various chart tools drawn after the start of trading are likely to reflect your own psychological state.
Then, there is a high possibility that it will be drawn according to the price volatility, so there is a high possibility that you will conduct the transaction incorrectly.
It is important to start trading right now and make a profit, but I think it is most important to conduct the transaction according to the trading strategy that you originally planned.
-
If your psychological state has become unstable due to the price volatility, you need to make an effort to make your psychological state as stable as possible by selling in installments.
If you do not, and continue to maintain an unstable state, you may end up suffering a large loss at one time, so you need to be careful.
-
How the StochRSI indicator is initialized, that is, whether it touches the oversold zone, is a point of observation to check the movement of the StochRSI indicator.
Since the BW indicator fell from the highest point (100) on March 13, it has not touched the highest point (100) yet.
This can be considered evidence that the upward strength is not strong.
This time, the BW indicator will touch the highest point (100), so it is a point to watch whether the trend will change.
-
Have a good time.
Thank you.
--------------------------------------------------
- Big picture
It is expected that the real uptrend will start when it rises above 29K.
The section expected to be touched in the next bull market is 81K-95K.
#BTCUSD 12M
1st: 44234.54
2nd: 61383.23
3rd: 89126.41
101875.70-106275.10 (overshooting)
4th: 134018.28
151166.97-157451.83 (overshooting)
5th: 178910.15
These are points where resistance is likely to occur in the future.
We need to check if these points can be broken upward.
We need to check the movement when this section is touched because I think a new trend can be created in the overshooting section.
#BTCUSD 1M
If the major uptrend continues until 2025, it is expected to start forming a pull back pattern after rising to around 57014.33.
1st: 43833.05
2nd: 32992.55
-----------------

Chart with trend(MACD), momentum(DMI), and market strength(OBV)
Hello, traders.
If you "Follow", you can always get new information quickly.
Please click "Boost" as well.
Have a nice day today.
-------------------------------------
BW+ indicator is an indicator that comprehensively evaluates MACD, DMI, and OBV indicators.
Therefore, knowledge of MACD, DMI, and OBV indicators is required.
I added the existing HA-Low and HA-High indicators to express the section to start trading more clearly.
-
The indicators have changed and been supplemented a lot over the past 6 years of using TradingView.
It was not easy to express my trading method as an indicator.
Because of this, I think there are people who unintentionally interpret my writing differently from what I think.
So, to narrow this gap, I am explaining the indicators used in my article.
Since these indicators are automatically generated by a formula, no one can change them.
Therefore, I think anyone can look at the chart and interpret it from the same perspective.
However, there may be differences in interpretation depending on one's investment style or average purchase price.
However, since everyone talks about the same point, there will be no confusion.
-
When talking to each other in the community, if you talk with the chart tool you drew, you may talk differently and there may be room for misunderstanding.
So, I think the conversation often goes in a strange direction because the conversation ends up talking about whether it is LONG or SHORT right now.
I think that charts drawn with chart tools are not very meaningful because they only show a part of the person's thoughts through chart analysis.
This is because they do not tell you the selection point using the chart tool, so interpretation or understanding is lacking.
Therefore, you cannot apply such content to your own chart.
So, since it can't be used as a trading strategy, I can't help but just say, "Oh, that could be possible."
However, if there is a chart that everyone can see and no one can change, I think it would be easier to talk and reflect each other's thoughts on my trading strategy.
I think that because of that, I can find out what I lacked and supplement it.
Not everyone sees the same thing and thinks the same, but if the basic point of the thought is the same, I think it can help me make other people's thoughts my own.
-
Anyway, I hope that this chart change will help you create a clearer analysis or trading strategy.
-
The MACD indicator added to the chart is an indicator with a modified formula from the existing MACD indicator, but the interpretation method is the same.
That is,
- If MACD > Signal, it is interpreted as an upward trend,
- If MACD < Signal, it is interpreted as a downward trend.
-
The DMI indicator added to the chart simplifies the interpretation of the existing D+, D- indicators by expressing them as lines on the ADX line.
That is,
- The section expressed in Aqua color means a downward section,
- The section expressed in Orange means an upward section.
- When ADX is above 25, it means that the strength of the upward or downward movement is strong,
- When it is below 25, it means that there is a high possibility of forming a box section or sideways section.
-
The OBV indicator added to the chart means an upward trend when each line is broken upward, and a downward trend when it is broken downward.
-
The indicator that expresses the contents explained above is the BW v1.0 indicator.
In order to see this more intuitively, the BW (100), BW (0), and Mid (50) indicators were added so that they can be expressed in the price candle section.
In addition, there are also High (80 Down), Low (20 Up) indicators.
-
It is never easy to interpret each indicator and evaluate it comprehensively.
It is especially difficult when trading in real time.
-
When interpreting the BW v1.0 indicator, it is basically divided into rising and falling based on the 50 point.
Therefore, passing the 50 point increases the possibility of a significant change in the trend.
Therefore, it seems that trading can be done based on whether there is support near the Mid (50) line generated when the BW indicator passes the 50 point, but this is not the case.
The reason is that volatility is likely to occur when a change in trend occurs.
When volatility occurs, your trading point will go up and down, so psychological pressure will increase and you may proceed with an inappropriate trade.
Therefore, a good point to start trading is the BW (0), BW (100) or HA-Low, HA-High point.
Since these indicators are generated at the boundary of the low or high point range, if you start trading based on whether there is support, you are more likely to get good results.
-
In any case, you should think in line with your average purchase price.
Otherwise, if you trade incorrectly due to psychological pressure when you get close to the average purchase price, you may end up with little profit or even a loss.
This means that when you start a new trade, it is better to start near the BW (0), BW (100), HA-Low, and HA-High indicators as mentioned above.
-
Have a good time.
Thank you.
--------------------------------------------------

Just before turning into an uptrend
Hello, traders.
If you "Follow", you can always get new information quickly.
Please click "Boost" as well.
Have a nice day today.
-------------------------------------
(AVAXUSDT 1M chart)
The key is whether the price can be maintained above 21.39 and rise.
-
(1W chart)
The key is whether it can be supported above 27.29, in the box area of the HA-High indicator (29.24-54.14), and rise above 45.36.
If the price stays above the M-Signal indicator on the 1M chart, there is a possibility that it will turn into an uptrend.
-
(1D chart)
The key is whether it can rise after receiving support around 27.29-28.64.
However, since the StochRSI indicator has entered the overbought zone, we need to look at where it will receive support when it falls from the overbought zone.
If it falls below 27.29,
1st: 24.8
2nd: 21.39
We need to check whether there is support around the 1st and 2nd above.
-
AVAX is just now showing a movement to turn into an uptrend.
Accordingly, the 28.64-31.75 zone can be considered a buy zone.
If you bought in the 28.64-31.75 range, the BW (100) line is the time for a split sell.
If the price rises a little more, the BW (100) line is likely to be created, so the first split trading point may be close.
If the price stays above the BW (100) line or the HA-HIgh indicator, a stepwise uptrend is likely to begin.
-
Have a good time.
Thank you.
--------------------------------------------------
- Big picture
A full-scale uptrend is expected to begin when it rises above 29K.
The section expected to be touched in the next bull market is 81K-95K.
#BTCUSD 12M
1st: 44234.54
2nd: 61383.23
3rd: 89126.41
101875.70-106275.10 (overshooting)
4th: 134018.28
151166.97-157451.83 (overshooting)
5th: 178910.15
These are points where resistance is likely to occur in the future.
We need to check if these points can be broken upward.
We need to check the movement when this section is touched because I think a new trend can be created in the overshooting section.
#BTCUSD 1M
If the major uptrend continues until 2025, it is expected to start forming a pull back pattern after rising to around 57014.33.
1st: 43833.05
2nd: 32992.55
-----------------

The key is whether there is support near 2621.99
Hello, traders.
If you "Follow", you can always get new information quickly.
Please click "Boost" as well.
Have a nice day today.
-------------------------------------
ETH is in a reverse array.
Therefore, it is not attractive to start trading.
Therefore, the point of observation is whether it can turn into a regular array when the price is maintained above 2621.99.
Based on the current price position, it is expected that a full-scale uptrend will begin only if it rises above the 3265.0-3321.30 range.
Therefore, the 2621.99-3321.30 range can be considered a buy range.
So, rather than rushing to buy, I think it would be better to wait until the chart is at a level where you can trade.
-
The Mid (50) line is showing signs of being newly created.
Accordingly, the support near the Mid (50) line is the key.
Since the Mid (50) line is expected to be created near the M-Signal indicator of the 1W and 1M charts, near 2621.99, this section is becoming more important.
Therefore, if the price is located near 2621.99 when the M-Signal indicator of the 1D chart rises above 2621.99, then I think it would be a good time to buy.
-
If you bought near the BW (0) line or the HA-Low indicator, the area near 2621.99 is the first split trading area.
As I mentioned above, if you bought around 2621.99 when the chart was created, the BW (100) line or the HA-High indicator is the split trading area.
Currently, the BW (100) line is formed at 2627.76, and the HA-High indicator is formed at 3787.59.
-
Have a good time.
Thank you.
--------------------------------------------------
- Big picture
It is expected that a full-scale uptrend will begin when it rises above 29K.
The area expected to be touched in the next bull market is 81K-95K.
#BTCUSD 12M
1st: 44234.54
2nd: 61383.23
3rd: 89126.41
101875.70-106275.10 (overshooting)
4th: 134018.28
151166.97-157451.83 (overshooting)
5th: 178910.15
These are points where resistance is likely to occur in the future.
We need to check if these points can be broken upward.
We need to check the movement when this section is touched because I think a new trend can be created in the overshooting section.
#BTCUSD 1M
If the major uptrend continues until 2025, it is expected to start forming a pull back pattern after rising to around 57014.33.
1st: 43833.05
2nd: 32992.55
-----------------

Start of full-scale uptrend: 64748.70-65920.71
Hello, traders.
If you "Follow", you can always get new information quickly.
Please also click "Boost".
Have a nice day today.
-------------------------------------
In order to use the BW+ indicator in chart analysis, the existing HA-MS_BW+ indicator has been integrated and modified.
--------------------------------------
The key is whether it can rise above the trend line (1).
The StochRSI indicator seems to be entering the overbought zone.
The fact that the StochRSI indicator has entered the overbought zone means that the upward strength is strong.
Accordingly, there is a possibility that it will show an upward trend until it falls from the overbought zone, so you should look at the movement at the support and resistance points drawn on the chart.
---------------------------------------
We need to check if the price can be maintained above 65618.80, which is the upper point of the HA-HIgh indicator box.
The 65920.71 point is the HA-High indicator point on the 1W chart.
Therefore, if the price is maintained above 65920.71, there is a high possibility that a stepwise uptrend will begin.
However, since the StochRSI indicator has entered the overbought zone, it is expected to show a downward trend, so it is expected that support will be important around 65920.71.
-
The BW (100) line is currently formed at 73072.41.
If the price rises a little more and a new BW (100) line is created, that area will be the split trading point.
Otherwise, the current BW (100) line position, 73072.41, will be the split trading point.
-
If it falls below 64748.70-65920.71, the most important support and resistance point is 61099.25.
However, before that, we need to check whether there is support near 62856.30, the lower point of the HA-HIgh indicator box.
-
The point of interest is whether the price can be maintained near the 64748.70-65920.71 range even after the next volatility period, around November 4th.
If not, we need to check whether it is located near 56204.13.
-
Have a good time.
Thank you.
--------------------------------------------------
- Big picture
It is expected that the real uptrend will start after rising above 29K.
The section expected to be touched in the next bull market is 81K-95K.
#BTCUSD 12M
1st: 44234.54
2nd: 61383.23
3rd: 89126.41
101875.70-106275.10 (overshooting)
4th: 134018.28
151166.97-157451.83 (overshooting)
5th: 178910.15
These are points where resistance is likely to be encountered in the future. We need to see if we can break through these points.
We need to see the movement when we touch this section because I think we can create a new trend in the overshooting section.
#BTCUSD 1M
If the major uptrend continues until 2025, it is expected to start by creating a pull back pattern after rising to around 57014.33.
1st: 43833.05
2nd: 32992.55
-----------------

Forget everything after studying the chart
Hello, traders.
If you "Follow", you can always get new information quickly.
Please click "Boost" as well.
Have a nice day today.
-------------------------------------
(BTCUSDT 1D chart)
The key is whether it can rise along the trend line (2).
When a new candle is created, it is necessary to check whether the StochRSI indicator enters the overbought zone.
The zone marked with a circle corresponds to the important support and resistance zone.
-
(BTCUSDT.P 1D chart)
When the Mid (50) line is created, whether there is support near it is the key.
The Mid (50) line is a position conversion line, so the trend is likely to be formed depending on whether the price is maintained above or below the Mid (50) line.
-------------------------------------------
When I learned about patterns while studying charts, I was amazed and thought I could stop studying charts.
However, as I traded, I realized that patterns are just the past appearances of charts.
You should forget all the studies you have done on charts after you finish studying them.
Otherwise, if you try to apply what you have studied to the current chart, you will likely end up analyzing charts or trading incorrectly.
So why should you study charts?
I think it is the same as studying in school as we grow up.
It is not necessary when you are living in real life, but it is the same reason you should study them.
Therefore, if you have studied and understood the arrangement or patterns of candles, forget them all.
If you are stuck in the framework of knowledge gained from studying charts, you may try to fit the pattern rather than respond to real-time movements.
Then, it may become a trade that you regret.
- How well you indicate support and resistance points,
- How much you trust those points,
- How much you can create a response strategy for those points are the things that remain after studying charts.
-
Have a good time.
Thank you.
--------------------------------------------------
- Big picture
It is expected that a full-scale uptrend will start after rising above 29K.
The section expected to touch in the next bull market is 81K-95K.
#BTCUSD 12M
1st: 44234.54
2nd: 61383.23
3rd: 89126.41
101875.70-106275.10 (overshooting)
4th: 134018.28
151166.97-157451.83 (overshooting)
5th: 178910.15
These are points where resistance is likely to occur in the future.
We need to check if these points can be broken upward.
We need to check the movement when this section is touched because I think a new trend can be created in the overshooting section.
#BTCUSD 1M
If the major uptrend continues until 2025, it is expected to start forming a pull back pattern after rising to around 57014.33.
1st: 43833.05
2nd: 32992.55
-----------------

HA-High Box Range: 62856.30-65618.80
Hello, traders.
If you "Follow", you can always get new information quickly.
Please click "Boost" as well.
Have a nice day today.
-------------------------------------
Since this is a chart for trading, there is nothing to analyze.
However, since the chart has been released, I think it is necessary to explain how to actually use it, so I will spend a few more times explaining this chart in the future.
-
(BTCUSDT.P 1D chart)
In this chart, M-Signal indicators for 1M, 1W, and 1D charts have been added to check the trends necessary for chart analysis.
The 5EMA line of the 1D chart has been added for scalping and day trading.
- Basically, the point where you start trading is the BW (0), BW (100) line.
- Mid (50) line is the position conversion line.
- Low (20 UP), HIgh (80 Down) line are split trading points because they indicate the low and high points.
Since the Mid (50) line is showing signs of rising and being created, the key is whether the Mid (50) line can be supported around this area and rise above the High (80 Down) line.
-
(1h chart)
If the price is maintained above the BW (100) line, it is likely to lead to a stepwise uptrend.
If it falls below the BW (0) line, it is likely to lead to a stepwise downtrend.
Since 5EMA on the 1D chart > M-Signal on the 1D chart > M-Signal on the 1W chart, if it is supported near the BW (100) line, it is expected to lead to additional rise.
However, if the StochRSI indicator enters the overbought zone, it is likely to decline over time.
In that case, you should check whether there is support near the High (80 Down) line.
Also, if the Mid (50) line is created near the price, you need to check whether you should switch the position.
------------------------------------------------
(BTCUSDT 1D Renko chart)
You can see that the 63000 point is an important support and resistance point.
-
The point to watch is whether it can rise along the rising trend line (2) and receive support near 63515.05-64538.39.
-
The 62856.30-65618.80 section is the box section of the HA-High indicator on the 1D chart.
Accordingly, if it receives support near 62856.30, it is highly likely that it will attempt to rise to the 64748.70-65618.80 section.
If it falls below 62856.30,
1st: 61099.25
2nd: HA-Low on 1D chart (currently 56204.13)
We need to check for support near the 1st and 2nd above.
The next volatility period is around November 4th.
-
Have a good time.
Thank you.
--------------------------------------------------
- Big picture
It is expected that a full-scale uptrend will begin after it rises above 29K.
The section expected to be touched in the next bull market is 81K-95K.
#BTCUSD 12M
1st: 44234.54
2nd: 61383.23
3rd: 89126.41
101875.70-106275.10 (overshooting)
4th: 134018.28
151166.97-157451.83 (overshooting)
5th: 178910.15
These are points where resistance is likely to occur in the future.
We need to check if these points can be broken upward.
We need to check the movement when this section is touched because I think a new trend can be created in the overshooting section.
#BTCUSD 1M
If the major uptrend continues until 2025, it is expected to start forming a pull back pattern after rising to around 57014.33.
1st: 43833.05
2nd: 32992.55
-----------------

Chart for trading on time frame charts below 1D chart
Hello, traders.
If you "Follow", you can always get new information quickly.
Please also click "Boost".
Have a nice day today.
-------------------------------------
This is an indicator created for trading on time frame charts below 1D charts.
Therefore, there is nothing to explain.
This is because trading should be conducted according to your own trading strategy or response strategy.
However, I hope that it will be a reference material that allows you to create a trading strategy or response strategy that suits you by looking at the points where you can start trading or the points where you can respond.
To use this chart, click the three dots below this idea and click Grab this chart.
---------------------------------------------
The basic trading method is as follows.
1. The BW 0 line or BW 100 line is the standard line for trading.
Therefore, to start trading for the first time, you will trade with a buy (LONG) or sell (SHORT) position depending on whether these two lines are supported.
2. The Mid (50) line is the position conversion line.
Therefore, when trading with a sell (LONG) or sell (SHORT) position, if you touch the Mid (50) line, you should proceed with a split transaction or liquidate depending on the situation.
3. The High (80 Down), Low (20 UP) line plays the same role as the Mid (50) line, but it is a line for the main purpose of a split transaction.
Therefore, in the case of a low time frame chart, it may be more helpful to deactivate the High (80 Down), Low (20 UP) lines.
-
The additional trading method is as follows. 1. If it falls below the BW 0 line, it is likely to lead to a stepwise downtrend.
2. If it rises above the BW 100 line, it is likely to lead to a stepwise uptrend.
Therefore, if 1 and 2 occur, you should conduct split trading near the Mid (50), High (80 Down), and Low (20 UP) lines.
To determine this, it is recommended to conduct trading by referring to the movement of the StochRSI indicator.
If the StochRSI indicator has entered the overbought zone, it is highly likely to lead to an additional rise.
Therefore, if it falls in the overbought zone and changes to a state where StochRSI < StochRSI EMA, the price is likely to continue to decline.
Conversely, if the StochRSI indicator has entered the oversold zone, it is highly likely to lead to an additional decline.
Therefore, if it rises in the oversold zone and changes to a state where StochRSI > StochRSI EMA, the price is likely to continue to rise.
With this interpretation method, I recommend using it as a basis for judging how to proceed with a transaction when the price is located near the BW 0 line and the BW 100 line.
-
When trading, it is recommended to proceed based on the trend of the 1D chart.
In other words, if the 1D chart maintains an upward trend, it is recommended to proceed with a transaction to maintain a long position.
If you need to trade in the opposite direction of the 1D chart trend, remember that a short and quick response is required.
In order to see the overall trend, the M-Signal indicators of the 1M, 1W, and 1D charts have been added.
For scalping or day trading, the 5EMA indicator of the 1D chart has been added.
-
Have a good time.
Thank you.
--------------------------------------------------

Check if it is a regular array before trading
Hello, traders.
If you "Follow", you can always get new information quickly.
Please click "Boost" as well.
Have a nice day today.
-------------------------------------
Since ETH is in a reverse array (M-Signal on the 1D chart < M-Signal on the 1W chart < M-Signal on the 1M chart), I don't think it's time to trade.
However, since it is located near the HA-Low indicator and the M-Signal indicator on the 1D chart, if it receives support, it can be considered an aggressive buying period.
Such aggressive buying requires a short and quick response.
From this perspective, if ETH maintains its price around the 2555.38-2646.97 range and switches to a regular array (M-Signal on the 1D chart > M-Signal on the 1W chart > M-Signal on the 1M chart), it is ready for trading.
If you are familiar with day trading, you can start with aggressive buying and move on to full-scale trading, but if you are not, it is better to pass on aggressive buying.
If you make an aggressive purchase and it fluctuates up and down, you will not be able to hold on and sell when you need to make a full-scale transaction, which will reduce your profits or you will likely suffer losses even if the price rises.
-----------------------------------------
Currently, the only coin recognized for its value after BTC is ETH.
You can argue this, but this is a fact.
Several coins are making efforts to be recognized for their value.
Namely, XRP, SOL, etc.
Therefore, I think that long-term investments are BTC and ETH, and the remaining coins and tokens are trading coins that earn profits through trading in the medium term or less.
----------------------------------------
(ETHUSDT 12M chart)
When drawing a parallel channel, the most important trend is the trend line (1) created by the first and second selection points.
Therefore, if the first and second selection points are selected incorrectly, an incorrect channel may be created.
The next important thing is the third selection point, which determines the width of the channel.
If this is also selected incorrectly, it can be interpreted incorrectly, so caution is required.
Therefore, trend line (2) is the important trend line.
The next important thing is trend line (3) created between (1) and (2).
Therefore, if trend lines (1), (2), and (3) are passed, there is a high possibility that a change in the trend will occur.
The Fibonacci ratio is displayed as a Trend-Based Fib Extension tool with the selected candlestick of the parallel channel.
Accordingly, the drawing for basic chart analysis is completed.
Fibonacci ratio or parallel channel is for chart analysis, not for trading, so do not confuse them.
If you think of Fibonacci ratio as support and resistance points and there are no support and resistance points drawn separately on the 1M, 1W, and 1D charts, I think the transaction is likely to fail.
Therefore, in order to proceed with the transaction, you must mark the support and resistance points on the 1M, 1W, and 1D charts.
-
(ETHUSDT 1W chart)
If you drew an ascending parallel channel on the 12M chart, you drew a descending parallel channel on the 1W chart.
The 1M chart is drawn as an ascending parallel channel like the 12M chart, so it was not drawn.
This allows for a more accurate analysis when looking at just one parallel channel.
The Fibonacci ratios shown on the left were drawn on the 1W chart.
We found that a change in trend can occur by passing through the area indicated by the circle.
-
(1D chart)
The price made an uptrend and then started to make a downtrend.
As you can see in the 1D chart above, there are two downtrends.
The first wave of the downtrend provides important information.
Therefore, if possible, it is better to draw a trend line on the first wave where the change in wave occurred.
The second downtrend is connected to the current wave, so this also provides important information.
If you mark important areas according to the current price position, it is the same as the order of the circles marked on the chart.
-
Have a nice time.
Thank you.
--------------------------------------------------
- Big picture
It is expected that the real uptrend will start after rising above 29K.
The section expected to be touched in the next bull market is 81K-95K.
#BTCUSD 12M
1st: 44234.54
2nd: 61383.23
3rd: 89126.41
101875.70-106275.10 (overshooting)
4th: 134018.28
151166.97-157451.83 (overshooting)
5th: 178910.15
These are points where resistance is likely to be encountered in the future. We need to see if we can break through these points.
We need to see the movement when we touch this section because we think we can create a new trend in the overshooting section.
#BTCUSD 1M
If the major uptrend continues until 2025, it is expected to start by creating a pull back pattern after rising to around 57014.33.
1st: 43833.05
2nd: 32992.55
-----------------

New chart tool released: Parallel Channel
Hello, traders.
If you "Follow", you can always get new information quickly.
Please also click "Boost".
Have a nice day today.
-------------------------------------
You can check the detailed explanation of the newly added chart tool by clicking the link address below.
www.tradingview.com
---------------------------------------
The most important thing when drawing a trend line is where you designate the selection point.
Therefore, it is recommended to draw the trend line before starting a trade.
If you draw a trend line while a trade is in progress, you should be careful because your psychological state may be reflected when designating the selection point.
-
You need to select 3 points to draw a parallel channel.
The first and second are the points corresponding to the trend line, and the third selection point is the point where the channel will be drawn.
Accordingly, I recommend drawing on the largest time frame chart possible.
I think that is the most objective way to draw parallel channels.
-
The chart above is the 12M chart, which is the largest time frame chart.
If the 12M chart does not have the current candle arrangement, you should use the 1M chart.
-
As in the example chart above, create a trend line by specifying the low point of the rising candle after the falling candle. (Specify 1st and 2nd points)
Then, complete the channel by specifying the high point of the candlestick to the left of the previous downtrend candlestick of the 2nd point. (Specify 3rd point)
If you draw it like above and look at it on a 1D chart, it will feel like it is drawn well.
-----------------
If you want to draw a 1D chart on a lower time frame chart, the 3rd point is the hardest to choose.
However, since you can designate it in the same way as you drew it on the largest time frame chart, you have to find out which point corresponds to the 3rd point.
-
If you look at the current trend, you can see that it is forming a downtrend channel.
Therefore, you have to choose a point to create a downtrend channel.
-
You can select and designate as shown in the chart above.
When drawing on the 12M chart above (when in an uptrend)
1st point designation: Select the low point of the rising candle after the falling candle
2nd point designation: Select the point of the rising candle after the falling candle after the 1st point designation
3rd point designation: Select the high point of the candle on the left of the falling candle to the left of the 2nd point designation
(When in a downtrend)
1st point designation: Select the opening price of the falling candle (wave) after the rising candle (wave)
2nd point designation: Select the opening price of the falling candle (wave) after the rising candle (wave) after the 1st point designation
3rd point designation: Select the low point of the rising candle (wave) to the left of the 2nd point designation
If you select in the above way, you can get a feeling that something is well drawn.
If you have your own drawing style, you can draw it that way.
I am just giving you an example of how to draw, so you don't have to follow it.
However, the important point is that you have to draw it according to the method of designating the selection point and creating a pattern.
-
If you look at the 1D chart above, you can see that there is a vertical line drawn.
This vertical line indicates the high point of the StochRSI indicator.
Since the current trend is a downtrend, the high point of the StochRSI indicator is indicated, but when it is an uptrend, the low point of the StochRSI indicator is indicated.
And, based on that point, you can select the point according to the format of designating the selection point mentioned above.
-
The trend line is a tool for chart analysis.
Therefore, in order to trade, the support and resistance points drawn on the 1M, 1W, and 1D charts must be indicated.
So, if you have confirmed the trend using the parallel channel released this time, you must draw the support and resistance points to create a basis for trading.
The reason is that since the trend line is diagonal, it is difficult to determine the timing to start trading.
-----------------------------------
The method I am talking about is a method that anyone can understand.
The trend line you draw should be a point that everyone who sees various support and resistance points can understand.
Then there is no need to explain why you chose that point, and I think everyone can easily understand it.
If you have a good method that you are using, please publish it as an idea and make it public.
-
Have a good time.
Thank you.
--------------------------------------------------
