$CRXTClarus Therapeutics Holdings, Inc., a pharmaceutical company, focuses on the development and commercialization of oral testosterone replacement therapy in the United States. It offers JATENZO, a soft gel oral formulation of testosterone undecanoate for treating hypogonadal men. The company has a licensing agreement with HavaH Therapeutics for product to treat androgen therapies for inflammatory breast disease and certain forms of breast cancer; and license agreement with The Royal Institution for the Advancement of Learning/McGill University to develop and commercialize McGill's proprietary technology designed to treat conditions associated with CoQ10 deficiencies in humans. Clarus Therapeutics Holdings, Inc. was founded in 2003 and is based in Northbrook, Illinois.
Supportandresistence


$IMPP entry PT .50-ish - .95 Target PT 16 and higherImperial Petroleum Inc. provides international seaborne transportation services to oil producers, refineries, and commodities traders. It carries refined petroleum products, such as gasoline, diesel, fuel oil, and jet fuel, as well as edible oils and chemicals; and crude oils. As of March 29, 2022, the company owned four medium range refined petroleum product tankers and one Aframax crude oil tanker with a total capacity of 305,804 deadweight tons. The company was incorporated in 2021 and is based in Athens, Greece.

Bulls and Bears zone for 04-28-2022Yesterday both buyers and sellers were very active, and today might be same.
Any test of ETH session High could provide direction for the day.
Level to watch 4260 --- 4258
Reports to watch:
US:Pending Home Sales Index
10:00 AM ET
US: EIA Petroleum Status Report
10:30 AM ET

BTC outlook for 28 April 2022. Talked about how I would like to see BTC close above the important zone around 39,3k which was a strong support zone in the past. Currently BTC is trading above this zone but I would want to see either a 4h bar or the daily close well above this zone before establishing that a fake out occurred. If BTC manages to close back below the 39,3k level I believe it will drop down further towards my long term trend line and that the bullish push from the last two days was merely a retest before continuing bearish.

Bulls and Bears zone for 04-26-2022Yesterday's turn around could be due to positive earnings season expectation.
Any test of ETH session Low could provide direction for the day.
Level to watch 4268 --- 4270
Reports to watch:
US:Consumer Confidence
10:00 AM ET
US:New Home Sales
10:00 AM ET

HAVELLS - LongAll details are given on chart. If you like the analyses please do share it with your friends, like and follow me for more such interesting breakout charts.
Disc - Am not a SEBI registered. Please do your own analyses before taking position. This post is only educational purposes and not a trading recommendation.

AUDCHF Buy IdeaH4 - Bullish trend pattern.
Currently it looks like a flat correction is happening in the form of a range.
Higher highs.
If we get a valid breakout above the top of the range we may then consider it as a validation for the bullish view and may expect the price to move higher further.


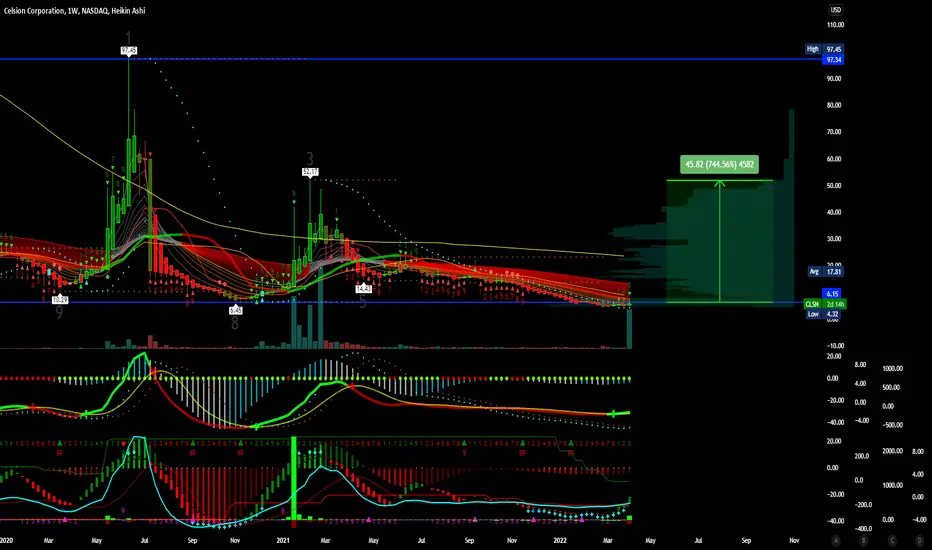
$CLSN Long term PTs 40-50 and higher...Parabolic!Celsion Corporation, a clinical stage biotechnology company, focuses on the development and commercialization of DNA-based immunotherapies, vaccines, and directed chemotherapies. Its product pipeline includes GEN-1, a DNA-based immunotherapy for the localized treatment of ovarian cancer; and ThermoDox, a proprietary heat-activated liposomal encapsulation of doxorubicin, which is in development stage for various cancer indications. The company also has two feasibility stage platform technologies for the development of nucleic acid-based immunotherapies, vaccines, and other anti-cancer DNA or RNA therapies. Celsion Corporation was founded in 1982 and is based in Lawrenceville, New Jersey.
EURCAD DLooking at this symbol more closely and in the long time (Daily) , this path will not be far from expectation.

Bulls and Bears zone for 04-05-2022Overnight session market has been trading sideways.
Any test of yesterday's Close could provide direction for the day.
Level to watch 4567 --- 4565
Report to watch:
US:ISM Services Index
10:00 AM ET

BAND/USDT : Rebound above the broken lineBINANCE:BANDUSDT
Hello everyone 😃
Before we start to discuss, I would be glad if you share your opinion on this post's comment section and hit the like button if you enjoyed it !
$BAND has rebounded above the broken trendline and now it's holding the support below.
There're two setups to trade with :
- Positional Traders can have a bag of it and set their invalidation as three candles close below the trendline; Which will confirm the rejection below the trendline.
- Swing Traders can enter above the trendline or set their entry near to $4.9; Stop-Loss should be located below $4.6, Which is crossing the last wicks on the poor lows.
Hope you enjoyed the content I created, You can support us with your likes and comments !
Attention: this isn't financial advice we are just trying to help people on their own vision.
Have a good day!
@Helical_Trades

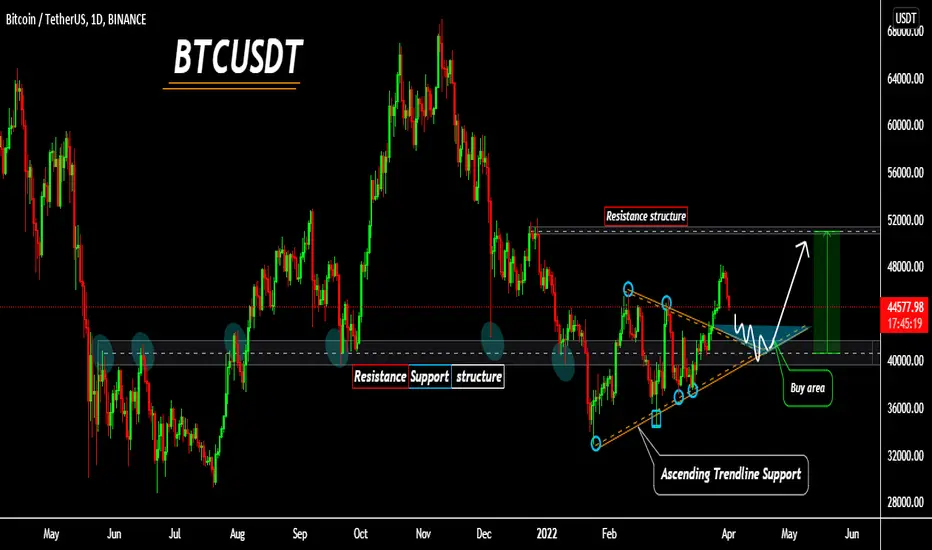
BITCOIN - what to do next..??BTCUSDT
price is currently above support/resistance structure and also price seems to have made a breakout of a triangle like structure, and currently price is in a correction/pullback mode in a daily timeframe, after reaching the support/resistance if price holds above it, I expect the price to move higher towards next resistance..
Trade Wisely
*The content on this analysis is subject to change at any time without notice, and is provided for the sole purpose of assisting traders to make independent investment decisions.
GBPAUD longThe trade will be executed on Monday so we let it run over the weekend and it forms a solid structure so we also have a solid confluence for a LONG

EUR/USD Outlook (08 March 2022)Overall, EUR/USD is trending downwards. Recently, EUR/USD broke the support zone of 1.10000.
EUR/USD’s next support zone is at 1.07000 and the next resistance zone is at 1.10000.
Look for short-term selling opportunities of EUR/USD.

GBP/USD Outlook (23 December 2021)Overall, GBP/USD is ranging across. Recently, GBP/USD bounced broke above the key level of 1.33.
The UK Final GDP q/q data (Actual:1.1%, Forecast: 1.3%, Previous: 1.3%) released yesterday indicated a slowdown in economic growth during the third quarter.
Currently, GBP/USD is trading towards the resistance zone of 1.33800 and the next support zone is at 1.32200.
Look for short-term buying opportunities of GBP/USD only after it breaks above the resistance zone of 1.33800.

EUR/USD Outlook (27 October 2021)Overall, EUR/USD is trending downwards. Recently, EUR/USD bounced off the resistance zone of 1.16300.
Currently, EUR/USD is testing to break above the key level of 1.16. Its next support zone is at 1.15000 and the next resistance zone is at 1.16300.
Look for selling opportunities of EUR/USD if it bounces down from the key level of 1.16.

NZD/USD Outlook (13 October 2021)Overall, NZD/USD is trending downwards. Recently, NZD/USD has been bouncing off the resistance zone of 0.69500.
G20 meetings will be held today.
NZD/USD’s next support zone is at 0.67900 and the next resistance zone is at 0.69500.
Look for short-term selling opportunities of NZD/USD up until the release of the meeting minutes by the FOMC tomorrow at 0200 (GMT+8).

USD/JPY Outlook (04 October 2021)Overall, USD/JPY is trending upwards. Recently, USD/JPY traded into the support zone of 110.800.
The Japanese Consumer Confidence data (Actual: 37.8, Forecast: 37.4, Previous: 36.7) released last Friday indicated a slight increase in the level of confidence of the surveyed households on the economic conditions of Japan.
Currently, USD/JPY is testing the support zone of 110.800 and the next resistance zone is at 112.000.
Look for buying opportunities of USD/JPY if it rejects the support zone of 110.800.

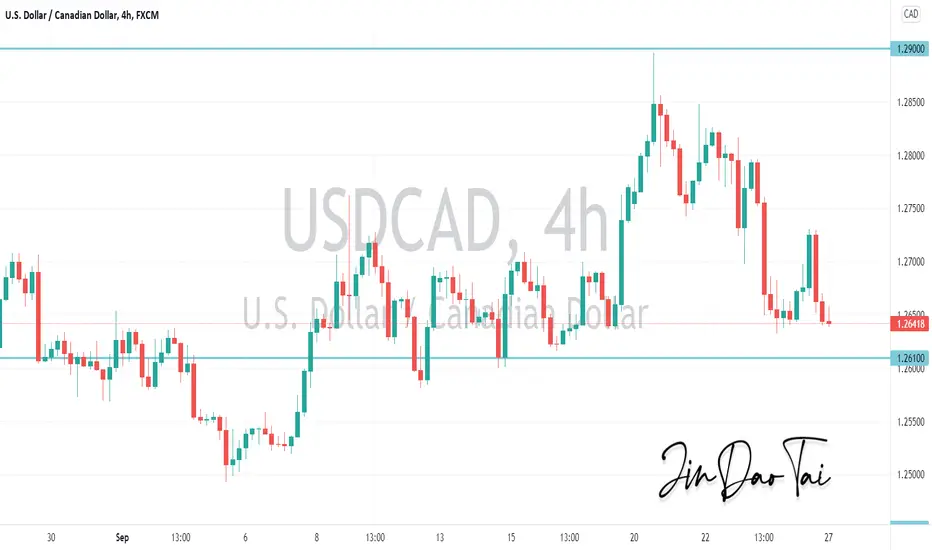
USD/CAD Outlook (27 September 2021)Overall, USD/CAD is trending upwards. Recently, USD/CAD bounced down from the key level of 1.27.
The Canadian retail sales data released yesterday indicated a decline in consumer spending in July as Canada was in the process of lifting restrictions.
Core Retail Sales m/m (Actual: -1.0%, Forecast: -1.5%, Previous: 4.8% revised from 4.7%)
Retail Sales m/m (Actual: -0.6%, Forecast: -1.2%, Previous: 4.2%)
Currently, USD/CAD is moving towards the support zone of 1.26100 and the next resistance zone is at 1.29000.
Look for short-term buying opportunities of USD/CAD if it bounces off the support zone of 1.26100.
EUR/USD Outlook (31 August 2021)Overall, EUR/USD is trending downwards. Recently, EUR/USD broke the resistance zone of 1.17600.
The eurozone CPI flash estimate y/y data will be released later at 1700 (GMT+8).
CPI Flash Estimate y/y (Forecast: 2.7%, Previous: 2.2%)
Core CPI Flash Estimate y/y (Forecast: 1.5%, Previous: 0.7%)
Currently, EUR/USD is testing to break above the key level of 1.18. Its next support zone is at 1.17600 and the next resistance zone of 1.19000.
Look for buying opportunities of EUR/USD if it breaks above the key level of 1.18.

AUD/USD Outlook (31 August 2021)Overall, AUD/USD is ranging across. Recently, AUD/USD bounced off the resistance zone of 0.73300.
The Australian Building Approvals m/m data (Forecast: -5.0%, Previous: -6.7%) will be released later at 0930 (GMT+8).
Also, the Australian GDP q/q data (Forecast: 0.6%, Previous: 1.8%) will be released tomorrow at 0930 (GMT+8).
Currently, AUD/USD is testing to break below the key level of 0.72. Its next support zone is at 0.72200 and the next resistance zone is at 0.73300.
Look for short-term buying opportunities of AUD/USD if it bounces up from the key level of 0.72.
