Support and resistance zones: 115854.56-116868.0
Hello, traders.
Please "Follow" to get the latest information quickly.
Have a nice day today.
-------------------------------------
(BTCUSDT 1D chart)
This decline created a new trend line.
This added a period of volatility around July 31st.
If the HA-High indicator is generated at the 115854.56 point, the key is whether it can be supported and rise around that point.
If it falls below the HA-High indicator, there is a possibility of a downward trend.
Therefore, it is necessary to look at which support and resistance points the price is maintained at as it passes the volatility period around July 18 (July 17-19).
-
Since the StochRSI 80 indicator is formed at the 116868.0 point, it is important to be able to maintain the price above 116868.0 if possible.
Therefore, assuming that the HA-High indicator will be generated at the 115854.56 point, the key is whether there is support around 115854.56-116868.0.
Next, since the M-Signal indicator on the 1D chart is rising above 116696.20, we need to check if it is supported by the M-Signal indicator on the 1D chart or around 116696.21.
-
So far, we have talked about how to maintain an upward trend by breaking through a certain point or section.
That is,
- The K of the StochRSI indicator should be below the overbought section and should show an upward trend with K > D.
- The PVT-MACD oscillator indicator should show an upward trend. (If possible, it should be above the 0 point.)
- The OBV indicator of the Low Line ~ High Line channel should show an upward trend. (If possible, it should be maintained by rising above the High Line.)
I said that when the above conditions are met, there is a high possibility that the upward trend will continue.
On the other hand, in order to change to a downward trend,
- The DOM (60) indicator should be created and show resistance near the DOM (60) indicator.
- When the HA-High indicator is generated, it should show resistance near the HA-High indicator.
- When the K of the StochRSI indicator falls from the overbought zone, it should switch to a state where K < D and show a downward trend. (However, caution is required as volatility may occur when K reaches around the 50 point.)
- The PVT-MACD oscillator indicator should show a downward trend. (If possible, it is better if it is located below the 0 point.)
- The OBV indicator of the Low Line ~ High Line channel should show a downward trend. (However, it should show a downward trend in the state where OBV < OBV EMA is present.)
When the above conditions are satisfied, there is a high possibility of a downward trend.
Among these, the most intuitive thing to know is whether the DOM (60) indicator and the HA-High indicator are generated.
This is because, in order to first switch to a downward trend, a signal that the current price position is a high point must appear.
The DOM(60) indicator is an indicator that indicates the end of the high point.
Therefore, if the DOM(60) indicator is generated, it is likely to be a high point.
However, since it can be supported and rise near the HA-High indicator, you should check whether there is support in the HA-High ~ DOM(60) section and respond accordingly.
The HA-High indicator is an indicator created for trading on the Heikin-Ashi chart, and if it falls below the HA-High indicator, it is likely to be a point where a downtrend will begin.
-
Since the same principle applies to any time frame chart you trade, it is easier to understand the chart and determine the timing of the start and end of the transaction.
However, the basic trading method must be a split trading method.
The reason is that if it rises in the HA-High ~ DOM(60) section, it is likely to show a stepwise upward trend, and if it falls in the DOM(-60) ~ HA-Low section, it is likely to show a stepwise downward trend.
This basic trading method, that is, buying near the HA-Low indicator and selling near the HA-High indicator, will eventually make you familiar with day trading, which will have an effective influence on finding a buying point when making mid- to long-term investments.
It is wrong to say that you are good at mid- to long-term investments when you are not good at day trading.
You were just lucky.
Unfortunately, this kind of luck cannot last.
-
Thank you for reading to the end.
I hope you have a successful transaction.
--------------------------------------------------
- This is an explanation of the big picture.
(3-year bull market, 1-year bear market pattern)
I will explain more details when the bear market starts.
------------------------------------------------------
Supportandresistnace

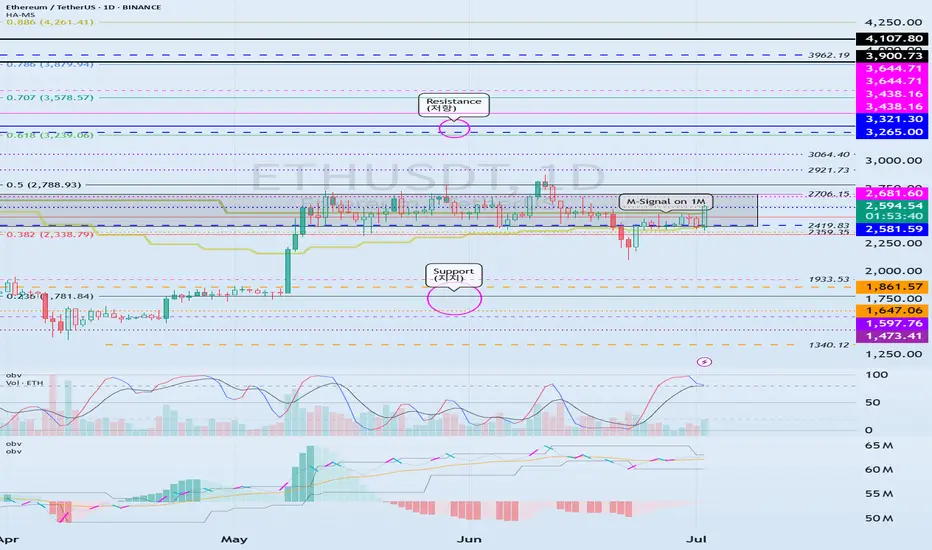
Important Support and Resistance Areas: 2419.83-2706.15
Hello, traders.
Please "Follow" to get the latest information quickly.
Have a nice day today.
-------------------------------------
(ETHUSDT 1D chart)
The key is whether ETH can find support in the 2419.83-2706.15 area and rise.
This is because this section is the section that needs to be supported in order for a full-fledged uptrend to begin.
Therefore, if you are trading ETH, you can proceed with a purchase when support is confirmed in the 2419.83-2706.15 section.
-
Thank you for reading to the end.
I hope you have a successful transaction.
--------------------------------------------------
- Here is an explanation of the big picture.
(3-year bull market, 1-year bear market pattern)
I will explain the details again when the bear market starts.
------------------------------------------------------
StochRSI indicator and support and resistance levels
Hello, traders.
If you "follow" me, you can always get the latest information quickly.
Have a nice day today.
-------------------------------------
The StochRSI indicator on the left chart is slightly different from the StochRSI indicator on the right.
The StochRSI indicator on the left chart is the StochRSI indicator provided by default in TradingView, and the StochRSI indicator on the right chart is an indicator with a modified formula.
The StochRSI indicator is a leading indicator that is reflected almost in real time.
Therefore, it reacts sensitively to price changes.
Although it is advantageous because it reacts sensitively, it also increases the possibility of being caught in a fake, so I thought that a slight delay(?) was necessary, and so I created the StochRSI indicator on the left chart.
If you look at the relationship between the K and D of the StochRSI indicators on the two charts, you can see that there is a big difference.
In the end, you can predict the movement by checking whether the movement of the K line has escaped the overbought or oversold section.
However, I think that you will receive information that can determine the sustainability of the trend depending on the positional relationship between K and D.
Therefore, it is important to distinguish the inflection points that occur in the StochRSI indicator.
This is because these inflection points provide important information for drawing trend lines.
Therefore, the StochRSI indicator on the left chart, which better expresses the inflection point, is being used to draw the trend line.
(Unfortunately, this indicator was not registered on TradingView because I did not explain it well.)
-
As a new candle was created, the StochRSI indicator on the left chart is showing an inflection point on the K line.
The StochRSI indicator on the right chart is showing a transition to a state where K < D.
We will have to check whether the inflection point was created only when today's candle closes, but I think that the fact that it is showing this pattern means that there is a high possibility of a change in the future trend.
Since the next volatility period is expected to start around July 2nd (July 1st-3rd), I think it has started to show meaningful movements.
-
It is true that you want to buy at the lowest price possible and sell at the highest price.
However, because of this greed, one mistake can lead to a loss that can overturn nine victories, so you should always be careful.
Therefore, if possible, it is better to check for support and respond.
In that sense, I think it is worth referring to the relationship between K and D of the StochRSI indicator on the left chart.
This is because the actual downtrend is likely to start when K < D.
-
In order to check for support, you definitely need support and resistance points drawn on the 1M, 1W, and 1D charts.
Ignoring this and checking for support at the drawn support and resistance points can result in not being able to apply the chart you drew to actual trading.
Therefore, you should draw support and resistance points first before starting a trade.
Otherwise, if you draw support and resistance points after starting a trade, you are more likely to set support and resistance points that reflect your subjective thoughts, so as I mentioned earlier, you are more likely to lose faith in the chart you drew.
If this phenomenon continues, it will eventually lead to leaving the investment market.
-
It is important to determine whether there is support by checking the correlation between the StochRSI indicator and other indicators at the support and resistance points drawn on the 1M, 1W, and 1D charts.
Even if the inflection point of the StochRSI indicator or other indicators occurs at a point other than the support and resistance points you drew, you should consider it as something that occurred beyond your ability to handle.
In other words, you should observe the price movement but not actually trade.
As I mentioned earlier, if you start to violate this, you will become less and less able to trust the chart you drew.
-
Accordingly, the basic trading strategy I suggest is to buy near the HA-Low indicator and sell near the HA-High indicator.
However, since the HA-Low and HA-High indicators are expressed as average values, they may move in the opposite direction to the basic trading strategy.
In other words, if the HA-Low indicator is resisted and falls, there is a possibility of a stepwise downward trend, and if the HA-High indicator is supported and rises, there is a possibility of a stepwise upward trend.
Therefore, the basic trading strategy mentioned above can be considered a trading strategy in the box section.
In the case of deviating from this box section, it is highly likely to occur before and after the volatility period indicated by the relationship between the trend line using the StochRSI indicator mentioned above and the support and resistance points drawn on the 1M, 1W, and 1D charts.
Therefore, special care is required when conducting new transactions during the volatility period.
This is because there is a high possibility of being caught in a fake when trading during the volatility period.
-
The DOM(60) and DOM(-60) indicators are good indicators to look at together with the HA-Low and HA-High indicators.
The DOM indicator is an indicator that comprehensively evaluates the DMI, OBV, and MOMENTUM indicators.
Therefore, the DOM(60) indicator is likely to be at the end of the high point range, and the DOM(060) indicator is likely to be at the end of the low point range.
In the explanation of the HA-Low and HA-High indicators,
- I said that if the HA-Low indicator receives resistance and falls, there is a possibility that a stepwise downtrend will begin,
- and if the HA-High indicator receives support and rises, there is a possibility that a stepwise uptrend will begin.
In order for an actual stepwise downtrend to begin, the price must fall below DOM(-60), and in order for a stepwise uptrend to begin, it must rise above DOM(60).
In other words, the DOM(-60) ~ HA-Low section and the HA-High ~ DOM(60) section can be seen as support and resistance sections.
-
If these correlations start to appear, I think you will be able to create a trading strategy that fits your investment style without being swayed by price volatility and proceed with trading.
The reason for analyzing charts is to trade.
Therefore, the shorter the time for chart analysis, the better, and you should increase the start of creating a trading strategy.
-
Thank you for reading to the end.
I hope you have a successful trade.
--------------------------------------------------

Next Volatility Period: Around July 2nd
Hello, traders.
If you "Follow", you can always get the latest information quickly.
Have a nice day today.
-------------------------------------
(BTCUSDT 1D chart)
The key is whether it can rise above 108316.90 and find support.
When OBV rises above the High Line, we need to check if the PVT-MACD oscillator switches to above the 0 point.
However, since the StochRSI indicator is currently showing signs of entering the overbought zone, I think there is a high possibility of resistance.
We need to check for support in the 108316.90-111696.21 zone, which is the high point boundary zone.
- If OBV fails to rise above the High Line,
- If the PVT-MACD oscillator fails to remain above the 0 point,
- If the StochRSI indicator falls from the overbought zone and switches to a state where K<D,
It is highly likely that it will eventually encounter resistance in the high point boundary zone and fall.
Therefore, what we need to do is to check for support near 108361.90-108353.0.
If it rises after that, we need to check for support near 111696.21.
Entering a new purchase in the high point boundary section is a very risky transaction.
Therefore, a short and quick response is required when making a purchase.
The basic trading strategy is to buy near the HA-Low indicator and sell near the HA-High indicator.
Do not forget this.
However, since the HA-Low or HA-High indicators are intermediate values, they may move in the opposite direction.
In other words, there is a possibility that the HA-Low indicator will receive resistance and fall, showing a stepwise downtrend, and the HA-High indicator will receive support and rise, showing a stepwise uptrend.
Therefore, you must check whether there is support in the low point boundary section of the DOM(-60) ~ HA-Low section or the high point boundary section of the HA-High ~ DOM(60) section.
To do this, you must trade in a split transaction method.
-
The next volatility period is expected to start around July 2 (July 1-3).
The reason why we calculate the volatility period is because it can be a turning point of the trend.
Therefore, making a new trade during the volatility period means that there is a high possibility of being caught in a fake.
-
Thank you for reading to the end.
I hope you have a successful trade.
--------------------------------------------------
- Here is an explanation of the big picture.
(3-year bull market, 1-year bear market pattern)
I will explain the details again when the bear market starts.
------------------------------------------------------

Checking the trend change after the volatility period
Hello, traders.
If you "Follow", you can always get the latest information quickly.
Have a nice day today.
-------------------------------------
(BTCUSDT 1D chart)
This volatility period is expected to last from June 21st to 23rd.
Therefore, it is necessary to check the trend formed after the volatility period.
The 99705.62 point is the HA-High indicator point of the 1W chart, so it is important to see if there is support near this point.
If it falls without support, it may fall to around 89294.25.
The 89294.25 point is the HA-Low indicator point of the 1D chart.
Since the M-Signal indicator of the 1W chart is rising to around 99705.62, the area around 99705.62 is likely to play an important role as support and resistance.
Even if it turns upward, it must rise above the HA-High indicator point of 108316.90 of the 1D chart to maintain the price.
If not, it is likely to fall again.
-
The fact that the HA-High indicator was created means that it fell from the high point range.
In other words, if it falls below the HA-HIgh indicator point, it is likely to start a downtrend.
However, since the HA-High indicator is an intermediate value, if it is supported near the HA-High indicator, it is possible to show a stepwise upward trend.
The end point of the high point is the DOM (60) indicator.
Therefore, it should be interpreted that it has risen above the high point section only if it rises above the 111696.21 point.
Therefore, depending on how the 108316.90-111696.21 section is broken upward, an upward trend can be predicted.
----------------------------------------------------------------------
There are auxiliary indicators OBV indicators made of Low Line ~ High Line channels and PVT-MACD oscillator indicators.
The OBV indicator made of Low Line ~ High Line channels is an indicator that can see how the channel is structured, and whether OBV falls below the Low Line of the channel or rises above the High Line.
Therefore, you can predict the future trend based on the channel pattern.
-
The PVT-MACD oscillator indicator is an indicator created by adding the Close value dash PVT value to the MACD formula.
Therefore, it shows a similar appearance to the MACD oscillator indicator.
The reason for looking at the PVT-MACD oscillator indicator is to find out how the trading volume flows.
There are many trading volume indicators, but I think this PVT-MACD oscillator indicator reflects the trading volume flow well.
-
However, you should look at the support and resistance points where the changes in the movement of the PVT-MACD oscillator indicator, the OBV indicator created by the Low Line ~ High Line channel, and the StochRSI indicator occur.
If the changes in these indicators occur near the DOM(-60), HA-Low, HA-High, and DOM(60) indicator points, it can be of great help in creating a trading strategy.
The DOM(-60) indicator indicates the end point of the low point.
That is, falling below the DOM(-60) indicator means that it has entered the low point range, and there is a high possibility that it will show a full-scale downtrend.
The fact that the HA-Low indicator was created means that it has left the low point range.
That is, if it rises above the HA-Low indicator, it means that there is a high possibility that an uptrend will begin.
However, since the HA-Low indicator is an intermediate value, if it encounters resistance and falls, it is possible that it will show a stepwise downtrend.
Therefore, whether there is support in the DOM(-60) ~ HA-Low range is important.
-
Currently, the OBV indicator created as the Low Line ~ High Line channel has fallen below the Low Line.
Therefore, we need to look at whether the Low Line ~ High Line channel will change to a downtrend channel in the future.
We need to look at whether an 'M'-shaped pattern indicating a trend change occurs.
Since the PVT-MACD oscillator indicator is still below the 0 point, it can be seen that the selling force is dominant.
However, since the oscillator is maintaining an upward trend, you can see that the overall selling pressure is decreasing.
Even so, since it is located near the HA-High indicator, the resistance in the HA-High ~ DOM(60) section is expected to be considerable.
-
Support and resistance points should be drawn on the 1M, 1W, and 1D charts.
This will increase accuracy.
However, since the standard time frame chart for all indicators is a 1D chart, it is most important to check the flow of the 1D chart.
-
You may think it is difficult because you have to look at multiple indicators at once.
The most important thing is to look at the movement when approaching the HA-Low or HA-High indicator.
The reason is that the basic trading strategy is to buy near the HA-Low indicator and sell near the HA-High indicator.
-
Thank you for reading to the end.
I hope you have a successful transaction.
--------------------------------------------------
- Here is a description of the big picture.
(3-year bull market, 1-year bear market pattern)
I will explain more details when the bear market starts.
------------------------------------------------------

Support and resistance zone: 104463.74-106133.74
Hello traders.
If you "Follow", you can always get new information quickly.
Have a nice day today.
-------------------------------------
(BTCUSDT 1W chart)
When a new candle is created, you should check if the HA-High indicator is created at the 99705.62 point.
The reason is that the HA-High indicator was created, which means that it has fallen from the high point range.
In other words, it also means that it can fall to around or below the 97705.62 point.
Since the current candle fell to around 99705.62 and then rose, it can rise like this when a new candle is created.
We have several indicators that can determine the high point.
Representative indicators include DOM (60), StochRSI 80, and HA-High.
Therefore, the high point range is 104463.99-104984.57 and 97705.62.
Therefore, in order to turn downward, it is likely to start when it falls below 104463.99-104984.57 and shows resistance, and it can be interpreted that the downtrend is confirmed when it falls below 97705.62.
If we think about it the other way around, if the price stays above 104463.99-104984.57, it will eventually create a new high.
-
When we first study charts, we start to become curious about charts as we learn about price moving averages.
As such, when we look at charts, our understanding of charts changes depending on how well we understand the average value.
However, when we first learn about price moving averages in chart analysis, we start to study all sorts of different analysis techniques as we realize that there are ambiguous parts in conducting transactions.
As a result, chart analysis becomes more and more difficult, and we end up giving up on chart analysis.
If you have studied chart analysis in your own way without giving up on it, you will realize that it will eventually converge to the average.
No matter what indicator or analysis technique you use, you will eventually converge to the average and then diverge.
Therefore, we should try to analyze the chart using the easiest and most convenient method.
The reason is that chart analysis is ultimately just a means to create a trading strategy and has no other meaning.
-
The basic trading strategy on my chart is to buy near the HA-Low indicator and sell near the HA-High indicator.
The HA-Low and HA-High indicators are indicators created for trading on the Heikin-Ashi chart and ultimately represent the average.
The HA-High indicator is the average value that represents the high point range, and the HA-Low indicator is the average value that represents the low point range.
Therefore, if it is supported and rises near the HA-Low indicator, it is a buying period, and if it is resisted and falls near the HA-High indicator, it is a selling period.
However, since it is an average, if it is supported and rises near the HA-High indicator, it is likely to show a stepwise upward trend, and if it is resisted and falls near the HA-Low indicator, it is likely to show a stepwise downward trend.
Because of this, we need to adopt a split trading method.
-
The auxiliary indicator, StochRSI, is an indicator that moves based on the 50 point.
Therefore, when the StochRSI indicator value is below 50, we need to focus on finding a buying point, and when it is above 50, we need to focus on finding a selling point.
A decisive hint for this is when it enters the overbought or oversold zone.
The auxiliary indicator, OBV, is an indicator that adds up the difference in trading volume according to price.
If you divide the OBV indicator into High Line and Low Line and understand the movement of OBV, you can understand the movement of the price to some extent.
However, since not all indicators follow the price trend exactly, you should not try to judge everything with just one indicator.
If you express the OBV indicator in the form of an oscillator, it will look similar to the MACD oscillator.
As I mentioned earlier, this is because the chart eventually converges to the average value.
Using this characteristic, we combined the OBV indicator with a MACD-type oscillator.
If it is located below 0 based on the 0 point, it means that the selling pressure is high, and if it is located above 0, it means that the buying pressure is high.
No matter what indicator or analysis technique you study, you must have a solid basic understanding of the average value.
If not, no matter how good the indicator or analysis technique you learn, you will not be able to analyze it as you studied and create a trading strategy when you actually trade.
-
(1D chart)
It is highly likely that the uptrend will resume if it rises above the HA-High indicator point of 108316.90.
To do so, it is important to see if it can receive support and rise around 104463.99-106133.74.
If it fails to rise, it will eventually show a downward trend again.
If it meets the HA-High indicator and falls, it is likely to fall until it meets the HA-Low indicator.
Currently, the HA-Low indicator is formed at the 89294.25 point, but as the price falls, the HA-Low indicator is likely to be newly created.
Therefore, we need to check if the HA-Low indicator is newly created when the price falls.
Since the OBV of the auxiliary indicator is located near the Low Line and the OBV oscillator is also located below the 0 point, we can see that the selling pressure is strong.
Therefore, we need to check whether the OBV rises above the High Line when it is supported near 104463.99-106133.74 or whether the OBV oscillator rises above the 0 point.
-
I think that all indicators or analysis techniques are ultimately tools that confirm whether there is support at the support and resistance points or sections drawn on the 1M, 1W, and 1D charts.
Therefore, in order to use indicators or analysis techniques, it depends on how well you understand and draw the support and resistance points or sections according to the arrangement of the candles.
Therefore, you need to first check how reliable the support and resistance points you drew are and practice creating a trading strategy accordingly.
Ultimately, it can be seen that how well the support and resistance points are drawn depends on how well the chart analysis or trading strategy is made.
-
If you look at the 1W chart and the 1D chart, you can see that the important volatility period is around June 22.
The volatility period of the 1W chart is from June 16 to 29.
The volatility period of the 1D chart is from June 10 to 14 and from June 21 to 23.
Therefore, when the HA-High indicator of the 1W chart is generated at the 99705.62 point, it is important to maintain the price above 99705.62 after passing the volatility period of the 1W chart.
Since the HA-High indicator on the 1D chart is formed at 108316.90, we need to see if it can be supported and rise near 108316.90.
In summary, we can see that the important support and resistance range in the volatility period is 99705.62-108316.90.
Among these ranges, it is expected that the wave will start depending on whether the current price is supported in the 104463.99-106133.74 range.
In other words, the 104463.99-106133.74 range corresponds to the middle range of the 99705.62-108316.90 range, the average value.
-
Thank you for reading to the end.
I hope you have a successful transaction.
--------------------------------------------------
- This is an explanation of the big picture.
(3-year bull market, 1-year bear market pattern)
I will explain more details when the bear market starts.
------------------------------------------------------

Support and Resistance Areas: 5879.75-5972.75
Hello, traders.
Please "Follow" to get the latest information quickly.
Have a nice day today.
-------------------------------------
(ES1! 1D chart)
There are two important support and resistance areas.
5879.75-5972.75 and 5664.75-5720.50 sections.
If it rises after receiving support near the 5879.75-5972.75 section, it is expected that the 6031.75-6051.50 section will act as resistance.
If it falls in the 5879.75-5972.75 section,
1st: 5664.75-5720.50
2nd: M-Signal indicator on the 1M chart
You should check whether there is support near the 1st and 2nd sections above.
-
Thank you for reading to the end.
I hope you have a successful trade.
--------------------------------------------------

The key is whether it can find support near 0.846 and rise
Hello, traders.
If you "Follow", you can always get new information quickly.
Have a nice day today.
-------------------------------------
(FETUSDT 1D chart)
The M-Signal indicator on the 1M chart is abnormal, so the key is whether it can hold the price.
If the price is maintained above the M-Signal indicator on the 1M chart, it is highly likely that the upward trend will continue in the medium to long term.
Accordingly, we should check whether it can be supported and rise around 0.846.
If it fails to rise, the support range is expected to be around 0.424-0.534.
-
When the rise begins,
1st: 1.194
2nd: 1.556
Responses are required depending on whether there is support around the 1st and 2nd above.
The 1.194 point corresponds to the support and resistance range in the candle arrangement.
-
Thank you for reading to the end.
I hope you have a successful transaction.
--------------------------------------------------
- This is an explanation of the big picture.
(3-year bull market, 1-year bear market pattern)
I will explain more details when the bear market starts.
------------------------------------------------------

The key is whether it can rise above 3.211
Hello, traders.
If you "Follow", you can always get new information quickly.
Have a nice day today.
-------------------------------------
(TIAUSDT 1D chart)
The basic trading strategy is to buy near the HA-Low indicator and sell near the HA-High indicator.
However, if the HA-Low indicator falls, there is a possibility of a stepwise downtrend, and if the HA-High indicator rises, there is a possibility of a stepwise uptrend.
Therefore, when the HA-Low indicator is first created, the probability of rising is higher than the probability of falling, and when the HA-High indicator is first created, the probability of falling is higher than the probability of rising.
If the HA-Low indicator rises and then meets the previously formed HA-Low indicator again, the probability of falling is higher.
On the contrary, the HA-High indicator has a higher probability of rising.
You should check the movement of the chart with these characteristics in mind.
However, you should comprehensively judge the correlation between the OBV indicator and the StochRSI indicator.
-
From a trend perspective, since the M-Signal of the current 1D chart is < M-Signal of the 1W chart, you can see that it is in a reverse arrangement.
Therefore, when trading in a reverse arrangement, it is recommended to trade for a short period of time using day trading.
Therefore, if it shows a price that rises above the M-Signal indicator of the 1W chart and maintains the price, it is highly likely that a trend will be formed that can be traded.
In other words, when looking at the current price position, it can be seen that it can be traded for a short period of time or longer only when it rises above 3.211 and shows support.
-
Since the HA-Low indicator is formed at the 2.490 point, the price must be maintained above this point.
If not, there is a possibility of an additional stepwise downtrend, so you should think about a countermeasure for this.
-
If the average purchase price is significantly higher than the current price, you should not buy too much and increase your investment ratio.
In this case, it is better to trade with a relaxed mind and faithfully follow the basic trading strategy.
However, it is better to trade by increasing the number of coins (tokens) corresponding to the profit realization method and increasing the number of coins (tokens).
In other words, trade by purchase price.
If you bought 100 USDT at the current price of 2.840, you should sell 100 USDT when the price rises and shows resistance at 3.211.
In this case, only the number of coins (tokens) corresponding to the profit will remain.
At this time, you should be careful about the transaction fee.
Since you have to sell the purchase amount including the transaction fee, the actual selling amount when you place an order is not 100 USDT.
The transaction fee rate varies depending on the exchange.
For example, if the trading fee is 0.1%, you can trade 100USDT - (100USDT x 0.2%) = 99.8USDT.
-
Thank you for reading to the end.
I hope you have a successful trade.
--------------------------------------------------
- Here is an explanation of the big picture.
(3-year bull market, 1-year bear market pattern)
(3-year bull market, 1-year bear market pattern)
I will explain the details again when the bear market starts.
------------------------------------------------------

The key is whether it can find support at 24.59 and rise
Hello, traders.
If you "Follow", you can always get new information quickly.
Have a nice day today.
-------------------------------------
(AVAXUSDT 1M chart)
The key is whether the price can be maintained by rising above the M-Signal indicator on the 1M chart.
Accordingly, we need to see whether the price can be maintained by rising above 27.47.
-
(1W chart)
The important support and resistance range is the 38.93-51.54 range.
Therefore, even if the price is maintained by rising above the M-Signal indicator on the 1M chart, the uptrend can begin only if it rises above the 38.93-51.54 range.
If it falls, we need to see whether it can be supported near the volume profile range of 6.54-13.47.
-
(1D chart)
When it breaks upward around 28.67, it is expected that a breakout trade will be possible.
However, since an important support and resistance section is formed over the 38.93-51.54 section, a response is needed depending on whether there is support in this section.
Therefore, the key is whether it can be supported and rise around 24.59.
If not, it is necessary to check whether it is supported around 17.54-19.79.
-
The basic trading strategy is to buy when supported by the HA-Low indicator and sell when it meets the HA-High indicator.
However, if it is supported and rises near the HA-High indicator, it is likely to show a stepwise upward trend.
On the other hand, if it is resisted and falls near the HA-Low indicator, it is likely to show a stepwise downward trend.
Therefore, since it is currently located near the HA-High indicator, it can be seen that trading is possible depending on whether there is support.
However, since the probability of falling is higher than the probability of rising in the HA-High indicator, you should be careful about the investment ratio.
Otherwise, you may end up buying at the high point.
-
Thank you for reading to the end.
I hope you have a successful trade.
--------------------------------------------------
- Here is an explanation of the big picture.
(3-year bull market, 1-year bear market pattern)
(3-year bull market, 1-year bear market pattern)
I will explain the details again when the bear market starts.
------------------------------------------------------

Support and Resistance Zone: 2273.58-2359.35
Hello, traders.
If you "Follow", you can always get new information quickly.
Please click "Boost" as well.
Have a nice day today.
-------------------------------------
(ETHUSDT 1M chart)
In order to turn upward on the 1M chart, the price must rise to the Fibonacci ratio range of 0.382 (2674.80) ~ 0.382 (2723.46) and maintain it.
Before that, the key is whether it can rise above the M-Signal indicator on the 1M chart.
-
(1W chart)
The key is whether the price can be maintained and rise above the M-Signal indicator of the 1W chart.
To do so, we need to check whether the price is maintained by rising near the right Fibonacci ratio 0.5 (2295.84).
In order to continue the uptrend in the medium to long term, the price must be maintained above the M-Signal indicator of the 1M chart.
Accordingly, the key is whether the price can rise above the M-Signal indicator of the 1M chart when the price is maintained by rising near the right Fibonacci ratio 0.5 (2295.84).
Therefore, it is expected that a breakout trade will be possible when the right Fibonacci ratio 0.5 (2295.84) is broken upward.
However, since the StochRSI indicator is showing signs of entering the overbought zone, the increase may be limited.
-
(1D chart)
It showed a big rise as it broke through the A section, that is, the 1861.57 point.
In any case, since it is currently below the M-Signal indicator of the 1M chart, we can see that there is still time to buy.
Therefore, as I mentioned earlier, we should focus on finding a buying point when the price rises above the M-Signal indicator of the 1M chart and maintains the price, or when it rises to the Fibonacci ratio range of 0.382 (2674.80) ~ 0.382 (2723.46) and maintains the price.
ETH is in a typical reverse arrangement (M-Signal of the 1M chart > M-Signal of the 1W chart > M-Signal of the 1D chart).
Therefore, we should focus on finding a buying point while watching the situation with a relaxed mind.
If it continues to rise like this,
1st: 2273.58-2359.35
2nd: 2627.18
3rd: 2921.73
We need to check if it can rise with support near the 1st-3rd above.
If not, if it falls, we need to check if it can support near 1861.57.
-
Thank you for reading to the end.
I hope you have a successful trade.
--------------------------------------------------
- This is an explanation of the big picture.
I used TradingView's INDEX chart to check the entire range of BTC.
I rewrote it to update the previous chart while touching the Fibonacci ratio range of 1.902(101875.70) ~ 2(106275.10).
(Previous BTCUSD 12M chart)
Looking at the big picture, it seems to have been following a pattern since 2015.
In other words, it is a pattern that maintains a 3-year bull market and faces a 1-year bear market.
Accordingly, the bull market is expected to continue until 2025.
-
(Current BTCUSD 12M chart)
Based on the currently written Fibonacci ratio, it is displayed up to 3.618 (178910.15).
It is expected that it will not fall again below the Fibonacci ratio of 0.618 (44234.54).
(BTCUSDT 12M chart)
I think it is around 42283.58 when looking at the BTCUSDT chart.
-
I will explain it again with the BTCUSD chart.
The Fibonacci ratio ranges marked in the light green boxes, 1.902 (101875.70) ~ 2 (106275.10) and 3 (151166.97) ~ 3.14 (157451.83), are expected to be important support and resistance ranges.
In other words, it seems likely to act as a volume profile range.
Therefore, in order to break through this section upward, I think the point to watch is whether it can rise with support near the Fibonacci ratios of 1.618 (89126.41) and 2.618 (134018.28).
Therefore, the maximum rising section in 2025 is expected to be the 3 (151166.97) ~ 3.14 (157451.83) section.
To do that, we need to look at whether it can rise with support near 2.618 (134018.28).
If it falls after the bull market in 2025, we don't know how far it will fall, but considering the previous decline, we expect it to fall by about -60% to -70%.
So, if the decline starts near the Fibonacci ratio 3.14 (157451.83), it seems likely that it will fall to around Fibonacci 0.618 (44234.54).
I will explain more details when the downtrend starts.
------------------------------------------------------

The key is whether there is support near the previous ATH
Hello, traders.
If you "Follow", you can always get new information quickly.
Please click "Boost" as well.
Have a nice day today.
-------------------------------------
(BNBUSDT 1D chart)
The HA-Low indicator is generated at 588.27 and is rising above the previous ATH.
Accordingly, the key is whether there is support near the previous ATH point of 692.90 and whether it can rise above 719.53.
If it falls below 677.22,
1st: 656.63
2nd: 582.63-616.76 (Fibonacci ratio 0.618(620.33))
You need to check whether there is support near the 1st and 2nd above.
-
The fact that the HA-Low indicator was created means that it has broken out of the low range.
Therefore, if it falls below the 588.27 point, you need to be careful because there is a possibility that it will renew the low again.
If it falls from the HA-High indicator and meets the HA-Low indicator, you should consider that the previous wave has closed.
Also, if it rises from the HA-Low indicator and meets the HA-High indicator, it is the same.
The point to watch is whether it will move sideways in the HA-Low indicator ~ HA-High indicator range or break out and create a new wave.
In that sense, the key is whether it can rise and receive support near 719.53.
-
Thank you for reading to the end.
I hope you have a successful trade.
--------------------------------------------------
- Big picture
I used TradingView's INDEX chart to check the entire range of BTC.
(BTCUSD 12M chart)
Looking at the big picture, it seems to have been maintaining an upward trend following a pattern since 2015.
In other words, it is a pattern that maintains a 3-year upward trend and faces a 1-year downward trend.
Accordingly, the upward trend is expected to continue until 2025.
-
(LOG chart)
Looking at the LOG chart, you can see that the upward trend is decreasing.
Accordingly, the 46K-48K range is expected to be a very important support and resistance range from a long-term perspective.
Therefore, it is expected that prices below 44K-48K will not be seen in the future.
-
The Fibonacci ratio on the left is the Fibonacci ratio of the uptrend that started in 2015.
In other words, it is the Fibonacci ratio of the first wave of the uptrend.
The Fibonacci ratio on the right is the Fibonacci ratio of the uptrend that started in 2019.
Therefore, it is expected that this Fibonacci ratio will be used until 2026.
-
No matter what anyone says, the chart has already been created and is already moving.
It is up to you how to view and respond to this.
If the ATH is renewed, there are no support and resistance points, so the Fibonacci ratio can be appropriately utilized.
However, although the Fibonacci ratio is useful for chart analysis, it is ambiguous to use it as support and resistance.
The reason is that the user must directly select the important selection points required to generate Fibonacci.
Therefore, since it is expressed differently depending on how the user specifies the selection points, it can be useful for chart analysis, but it can be seen as ambiguous to use it for trading strategies.
1st: 44234.54
2nd: 61383.23
3rd: 89126.41
101875.70-106275.10 (when overshooting)
4th: 134018.28
151166.97-157451.83 (when overshooting)
5th: 178910.15
-----------------

Even if it falls, you should prepare for an uptrend
Hello, traders.
If you "Follow", you can always get new information quickly.
Please click "Boost" as well.
Have a nice day today.
-------------------------------------
The High Boundary Zone has been changed to the 101947.24-103706.66 range.
Therefore, anything above 103706.00 is considered a high range.
However, the basic 106133.74 point is likely to act as resistance.
-
The StochRSI indicator is showing a decline to the 50 point range.
Therefore, since volatility is likely to occur, a quick response is required when trading.
Therefore, the point of observation is whether there is resistance near 106133.74.
When a new candle is created, if the StochRSI indicator falls below the 50 point, the key point is whether there is support near 101947.24-103706.66.
If there is support, I think there is a high possibility that the uptrend will continue.
If the StochRSI indicator enters the oversold zone and falls below 101947.24 and shows resistance, you should check whether it touches the BW(0) indicator or the HA-Low indicator.
The 93576.0-34742.35 zone is expected to be an important support and resistance zone.
------------------------------
It seems that a lot of funds have flowed into the coin market through USDC.
Accordingly, the coin market is likely to show an upward trend soon.
As I said before, for the altcoin bull market to start, BTC dominance must fall below 55.01 and remain there or show a downward trend.
The maximum decline point of USDT dominance is expected to be around 2.84.
After that, since USDT dominance is expected to show an upward trend, the coin market is expected to show a downward wave.
If it goes up by 4.97 or more, I think you can definitely tell that a downtrend is in progress.
-
Based on the above coin market cap chart, this uptrend is expected to be the last uptrend.
Therefore, even if the price falls, a trading strategy that prepares for an uptrend is needed.
The point to watch is whether this uptrend can rise to the Fibonacci ratio point of 2.24 (116940.43).
This volatility period is expected to continue until January 31.
The next volatility period is expected to be around February 9-16.
-
Thank you for reading to the end.
I hope you have a successful trade.
--------------------------------------------------
- Big picture
I used TradingView's INDEX chart to check the entire range of BTC.
(BTCUSD 12M chart)
Looking at the big picture, it seems to have been following a pattern since 2015.
In other words, it is a pattern that maintains a 3-year bull market and faces a 1-year bear market.
Accordingly, the bull market is expected to continue until 2025.
-
(LOG chart)
Looking at the LOG chart, we can see that the increase is decreasing.
Accordingly, the 46K-48K range is expected to be a very important support and resistance range from a long-term perspective.
Therefore, we do not expect to see prices below 44K-48K in the future.
-
The Fibonacci ratio on the left is the Fibonacci ratio of the uptrend that started in 2015.
That is, the Fibonacci ratio of the first wave of the uptrend.
The Fibonacci ratio on the right is the Fibonacci ratio of the uptrend that started in 2019.
Therefore, this Fibonacci ratio is expected to be used until 2026.
-
No matter what anyone says, the chart has already been created and is already moving.
It is up to you how to view and respond to it.
Since there is no support or resistance point when the ATH is updated, the Fibonacci ratio can be appropriately utilized.
However, although the Fibonacci ratio is useful for chart analysis, it is ambiguous to use it as a support and resistance role.
The reason is that the user must directly select the important selection points required to create the Fibonacci.
Therefore, it can be useful for chart analysis because it is expressed differently depending on how the user specifies the selection point, but it can be seen as ambiguous for use in trading strategies.
1st: 44234.54
2nd: 61383.23
3rd: 89126.41
101875.70-106275.10 (when overshooting)
4th: 134018.28
151166.97-157451.83 (when overshooting)
5th: 178910.15
-----------------

Example for conducting a split transactionHello traders!
If you "Follow" us, you can always get new information quickly.
Please also click “Boost”.
Have a good day.
-------------------------------------
To create a trading strategy
- Investment period
- Investment size
- Trading method and profit realization method
The above conditions must be taken into consideration.
As you proceed with trading, you will respond to price changes depending on the trading method and profit realization method among your trading strategies.
This usually results in a split transaction.
We must not forget that long-term holding means that we are seeing period losses due to long-term holding.
This is because profits from long-term holding are ultimately difficult to view as actual profits.
Additionally, while holding it for a long time, you miss out on the opportunity to earn greater profits by trading other coins (tokens), which reduces expected profits.
Therefore, when rapid price volatility occurs, a response is necessary.
This can reduce the psychological burden that comes with long-term possession.
If you purchased BTC below 29K, the current price movement is at a level that does not cause much pressure.
However, looking at the price volatility of altcoins due to BTC price fluctuations, you may feel psychological pressure.
This is because they feel psychological pressure to protect their current profits, so they worry about whether to proceed with a split transaction.
If you look at the movements of altcoins due to BTC price volatility from around November 2nd, when this volatility period began, to the present, you may think that there will be a big drop once.
If the average purchase price is below BTC 29K, but you are not yet familiar with creating a trading strategy based on chart analysis, it is recommended to proceed with split trading when volatility exceeds -10% to +10%.
When volatility exceeds -10% to +10%, it basically means the volatility of one candle on a 1D chart.
Accordingly, there was an opportunity to conduct a split transaction as recently as October 23rd.
To be sure that a volatility of -10% to +10% has occurred, the candle of the day must be closed.
Therefore, it is recommended to proceed with trading just before the day's candle closes.
However, since it has been continuously rising since October 23rd, I think there is a high possibility that if you sold it in installments, you are currently regretting it.
However, you can seize new opportunities and feel psychological stability with the cash you get from selling in installments.
Additionally, if the price falls by more than -10% in the future, additional purchases can be made.
Since the price is rising, it is thought that even if the price rises higher and falls by more than -10%, if you buy it at a higher price than the split sale price, you will ultimately incur a loss.
But, that's not the case.
The most important thing in trading is to make a big profit, but it is more important to have your own psychological stability.
So what is needed is a profit realization method.
What is not possible with traditional stock market trading methods is possible in the coin market.
The reason is that coins (tokens) can be traded in decimal units.
Therefore, if you trade by purchase price, split trading is possible even if the price rises.
For split transactions based on long-term holding, it is recommended to increase the number of coins (tokens) corresponding to the proceeds.
Therefore, when selling in installments, the number of coins (tokens) corresponding to the profit is reserved by selling the purchase principal amount corresponding to the purchase price (+ transaction fee x 2 included).
If trading is carried out in this way, the average unit price provided by the exchange becomes meaningless.
Therefore, if you continue trading in this way, all of the purchase principal will be recovered, and only the number of coins (tokens) corresponding to the profit will remain.
Therefore, once the entire purchase principal has been recovered, the average purchase price of the remaining coins (tokens) becomes 0.
In this situation, even if you proceed with the transaction again, the average purchase price will be lower than the purchase price, thereby reducing the psychological burden of purchasing.
The impact of these transactions has greater significance when investing with a long-term perspective.
If so, let's give an example of how to proceed with additional purchases.
The method mentioned above, i.e. split trading when volatility is more than -10% to +10%, is a good method to use for those who are not familiar with chart analysis or creating trading strategies.
(Basically, you need the know-how to determine whether you are supported or resisted at a support or resistance point or section.
It is a tedious and difficult task as it requires checking movement for at least 1 to 3 days to check whether support or resistance is received at the support and resistance points.)
1. You can proceed with split trading based on the 5EMA on the 1D chart.
The 5EMA on the 1D chart has long been called a rising line.
Therefore, in order to proceed with a breakout trade, it is recommended to proceed when the price rises above 5EMA.
When the price rises sharply and falls away from the 5EMA, it touches the 5EMA line again and appears to be supported, so a split purchase is possible.
Therefore, split purchases are possible in section 1.
Accordingly, you will have to worry about how much of a purchase proportion you should make when purchasing.
When buying around 5EMA, it is recommended to buy about one-third to one-fourth of your current holdings.
(If you purchase in proportion to the number of coins (tokens) held, the average purchase price will increase significantly, so it must be calculated based on the current amount held.)
If you purchase more than that, you may feel psychologically anxious if the average purchase price shown increases significantly, so you need to be careful.
2. When support is confirmed near the MS-Signal indicator on the 1D chart (26EMA, which shows similar movements), you can proceed with split trading.
The next section for additional purchases is possible when support appears near the MS-Signal indicator.
At this time, you can purchase with 50% to 100% of the amount held.
The reason is that there is a high possibility of creating a pull back pattern.
3. Split trading is possible depending on whether support or resistance is received around the HA-Low and HA-High indicators.
If it is supported by the HA-Low indicator, it is basically a good time to buy additional money because it is highly likely to touch the HA-High indicator.
However, if supported by the HA-High indicator, there is a possibility of renewing the previous high point, so this also corresponds to the time for additional purchases.
Don't do it. If the HA-High indicator falls, it is highly likely that it will touch the HA-Low indicator, so a countermeasure is essential.
If the HA-Low indicator falls, there is a possibility that the previous low point will be renewed, so a response plan is also needed.
However, if it falls below the HA-Low indicator, there is a possibility of forming a bottom, so depending on the overall position of the price, you may have a better opportunity.
-------------------------------------------------- -------
Rather than analyzing charts, it is more important to think about these trivial(?) trading strategies and create a method that suits you.
This trading strategy does not necessarily require good chart analysis.
Therefore, in order to proceed with a transaction, you must have an idea of these minor(?) details.
Therefore, you should spend more time creating your trading strategy than you spend analyzing charts.
A trading strategy requires you to create a big picture trading strategy before you start trading.
In addition, by creating a detailed trading strategy within the scope of the trading strategy in the big picture and proceeding with the transaction while feeling psychologically stable, even if the transaction fails, the impact on proceeding with the next transaction can be reduced.
The most important thing in chart analysis is to have the know-how to check whether you are supported or resisted at support and resistance points or sections.
I do not recommend analyzing charts beyond that because it means becoming an analyst rather than trading.
Therefore, rather than studying difficult chart analysis techniques, more time should be invested in checking whether support or resistance is received at support and resistance points or sections.
--------------------------------------------------
- The big picture
The full-fledged upward trend is expected to begin when the price rises above 29K.
This is the section expected to be touched in the next bull market, 81K-95K.
-------------------------------------------------- -------------------------------------------
** All explanations are for reference only and do not guarantee profit or loss in investment.
** Trading volume is displayed as a candle body based on 10EMA.
How to display (in order from darkest to darkest)
More than 3 times the trading volume of 10EMA > 2.5 times > 2.0 times > 1.25 times > Trading volume below 10EMA
** Even if you know other people’s know-how, it takes a considerable amount of time to make it your own.
** This chart was created using my know-how.
---------------------------------

FILUSDTAccording to the price chart, it is located in the overlapping area of the Fibonacci price levels. And also the price is near a static resistance and a support trend line.
According to the price pattern on the chart, the price is "probably" at the end of its corrective pattern. In my opinion, this correction pattern should end between the 11th and 13th of March.
And the least I expect after the correction pattern ends is for the price to rise to the top of wave A or 1.
But the main targets of this price increase are respectively $20 (100% Fibonacci extension of wave A or 1 from the bottom of the corrective pattern) and $46 (162% Fibonacci extension).
And finally I see $183 (Fibonacci extension 262%).


Bitcoin: New Buy Signal And One Simple Rule.Bitcoin: Noise in the markets comes in many forms: price noise, inflexible opinions, hype, etc. It is one thing to consume it for intellectual entertainment, but taking action or making decisions on such information is NOT helpful at all for your trading account. There are many moving parts when it comes to evaluating a market, no matter what mix of fundamental and technical information you choose. The key is to have a set of rules to filter out the adverse effects and bias of human nature. In this video I explain why we believe price structure FAVORS longs, and where to anticipate bullish order flow IF selling activity increases from here. I will also touch on one simple rule that we employ in our long only swing trade strategy.
Key Point:
Low 7K resistance area has asserted itself, BUT price is more likely to push higher in its next bullish retrace. Why? The 6425 level was a key resistance that once taken out, offered some kind of PROOF that the balance of order flow leans more toward the bullish side. The recent indecisive price action is consistent with this idea so far. Sell offs are not "stop and go", fear is a powerful motivator and buyers do not appear to be getting absorbed around the current price level.
This will NOT be obvious on any oscillator, or any other random art on a chart. It is a concept that is based on price structure, proportions and forecasting methods that project forward, NOT focus on looking back. Does this mean price can't pull back to 6K? No, but until Bitcoin provides evidence for that scenario to be likely, it is an event that we assign a low probability.
We can do all the analysis in the world and it will not change the fact that markets are highly random. That means things look one way one minute, and then they change. Rules are what allow us to qualify opportunities and filter NOISE. One of our simplest rules: using predetermined prices to enter or exit a trade. This helps to minimize the effects of emotional decision making and filters out many would be fake outs that often lead to a stop out. Having preserved that capital allows us to continue to participate in the next quality setup. Evaluating and managing risk should not be confused with evaluating a market.

BTCUSD: Momentum Reversal In Play.BTCUSD update: Within the triple bottom formation that is now established in this market, there is a particular sequence of price action that often leads to a momentum reversal. The confirmation of this infrequent pattern is a retest and higher low of the 12350 support area.
Price has broken the 13500 resistance level and if it continues at this rate, will most likely close above. My limit order that I placed yesterday at 13150 (Coinbase) was filled quickly and is now in my favor (this is a long term trade as explained in my previous report. No stops, no targets, no margin). Even though price action is slightly bullish at the moment, it is still not out of the clear.
Is this the beginning of the next leg up? The 13520 level is the .382 of the recent bearish structure. Often, when this level is taken out, it signals a change in momentum which in this case is bullish. The confirmation comes in the form of a higher low formation which would be most attractive around the 12483 to 12139 minor support zone which is the .618 area relevant to this current bullish swing.
If price chooses to retest the minor support, this would be an attractive area to add to long term positions, or initiate new ones. Since this level would also confirm a short term pattern reversal, it will serve as an attractive area for a swing trade long as well. Risk can be defined by 11600 low, or the low of the current structure at the time of the retest.
What about lower prices? Like I always write: anything is possible because things change fast in these markets. IF for whatever reason, price falls through 12139 and retests 11600, it would then be much more likely to revisit the 10700 or lower. IF the market decides to retest these levels, 9683 would not be unreasonable since it is the lower boundary of the reversal zone (projection measured from 10700 low).
What makes that bearish scenario less likely is the price action that is occurring now. The next retrace, whether it is shallow (way above 12483) or into the minor support will provide a much clearer view of what the market's intentions are. What is unfolding now is certainly bullish, but that does not mean the market will return to the vertical exaggeration that we saw 2 weeks ago. A change in momentum along with supportive structure can take this market back up to the 16350 to 17876 resistance area which is the short term target for any swing trades established near or below current levels.
In summary, there are NOW signs in place that short term price momentum is shifting back to bullish. As you can see, it took a couple of days, not hours or minutes. This is what carries weight on a short term trading basis and why so much patience is required. The next retrace will more than likely offer entry opportunities that will have clearly defined risk. IF the price action makes sense I will not only add to my position trade, but also put on a swing trade with a short term target. The key is to watch for reversal patterns near or within the minor support zone. Taking a position sooner is up to your trading plan and risk tolerance, because it is still possible for price to attempt a retest of the lows, just a lower probability at this point. Either way stay flexible and listen to the market, not your own feelings or opinions.
Comments and questions welcome.
Also I would like to wish the Tradingview community a Happy, Healthy and Prosperous New Year! Thank you all for your support and encouragement. Let's learn from our mistakes and hit the ground running, and start the new year strong.

SandP 500 E-Mini Futures D CME Updated 11/27/2017 Price broke above 2561 and retested as support. We have to get above this yellow line to continue rising as we have. We are currently losing efficiency in force and trajection, as this yellow trendline is acting as resistance.
