Potential EUR/USD LongSetup is based on a forecasted channel I think price would trade within. Entry at touch of trend line, SL below the low formed to the left, tp at peak just before retracement. On m5 there's an Elliot Wave pattern building up within the retracement to entry on m15, enabling us to predict the end of the m15 retracement. Also, there's an SnR flip right at entry which could potentially cause price to bounce off.
Supportandresitance

GOLD FORECASTThe current analysis indicates a Bullish trend for OANDA:XAUUSD , should continue on the secondary channel till 2369, and after that stabilizing above 2369 will continue the bullish trend till 2397. otherwise stabilizing below 2369 will try to reach 2334 and 2306.
Key Levels:
Bullish Lines: 2369, 2397, 2412
Bearish Lines: 2334, 2306, 2281

AUDNZD | Short H4 | Market Exe | Trade-Related TradeTechnical Confluences for Trade:
- Stochastics are in Overbought Conditions on H1 & H4 time-frame
- Price action is close to a Supply Zone (Blue Area) & has Resistance Trendlines around
- Aiming for the 38.2% Fibo retracement to TP
Fundamental Confluences for Trade:
- Nothing much can dictate the movement of this FX pair as they are heavily trade-related. Any major movement will come from supply-demand areas, monetary policies or economic data gyrations.
Suggested Trade:
Entry @ Area of Interest 1.0970 - 1.1010
SL @ 1.1060
TP 1 @ 1.0920 (Close Half-Position & move SL to Entry level once TP1 is achieved)
TP 2 @ 1.0838
Risk-to-Reward @ Approx. 2.04 (Depending on Entry Level)
________________________________
Boosts 🚀, Follows ✌️, Shares 🙌 & Comments ✍️ are much appreciated!
If you have any ideas or charts, do share them in the 'Comments' section below and we can discuss our perspectives to improve or strengthen our strategies.
If you want something analyzed, do drop me a DM. :D
________________________________
Disclaimer: The above suggestion is an personal opinion in general and does not constitute as investment advice. Any decisions taken based on the above suggestion is purely your own risks.
Any websites / brokers / applications suggested here are also provided as informational purpose only.
________________________________

⚡GMEEUSDT⚡see and watch :)
After a sharp upward move, the price has been correcting for a few months and it seems that everything is ready for the second leg of the move...

⚡ATLASUSDT⚡see and watch :)
After a good correction, the price is in a very good support range and considering that this range is intact and fresh and also the price is gathering like a spring, it seems that news is coming!!!

Ripple can make correct move and then start to move upHello traders, I want share with you my opinion about Ripple. Looking at the chart, we can see how the price rebounded from the support level, which coincided with the buyer zone and support line to the resistance line. After this, the price made a little correction and then in a short time rose to the seller zone, breaking the resistance level, where it some time traded and later rebounded higher. Soon, XRP broke the resistance line, but at once turned around and started to decline inside the downward channel, where it later broke the support line and soon 0.5310 level too. After this, the price in a short time declined to the support line of the channel, after which rebounded and rose to the resistance line, but at once turned around and fell to the support level. A not long time ago, the price rebounded from the 0.4890 support level and in a short time rose higher resistance line, thereby exiting from the channel. So, at the moment, I think Ripple can make a correction move, after which turn around and start to grow. Therefore I set my target at 0.5225 points. Please share this idea with your friends and click Boost 🚀

XAUUSD LONG AND SHORTHi Guys, its been a long time since i published an analysis. and I'm back again
Gold sore the other day and reached the 2379 level which was the resistance, and has managed to cool off those buyers.
As always there are some demand and supply levels to take trade from. Our immediate demand level would be around 53-49 which upon reaching, with confirmation we will take trades. If the level is breached other levels below would become possible long points.
Those who want to go short ,currently level around 73-75 is a suitable point and above that levels 85,93,403,412,....
My view is that Before continuing higher market needs to see lower prices and demand levels to test.
* As always add your own intuition and logic into this analysis and proceed with safety measures in place.
Be honorable


GBPUSD: Bearish Momentum Ahead! Weekly Trading OutlookHello traders,
In today's video, I'll delve deep into the GBPUSD analysis, offering a thorough outlook for the upcoming trading week. With significant developments unfolding on both the DXY and GBPUSD charts, it's imperative to dissect the possibilities that lie ahead.
Stay tuned for invaluable insights that can help guide your trading decisions. Don't hesitate to drop any questions or comments in the section below.
For a comprehensive analysis on the DXY, be sure to watch the May 06 video linked below.
Happy trading!
The_Architect

BTC 1 Hour AnalysisFollowing the 1 hour chart, the consolidation is coming to a point where it might break past the support line its been hanging on or keep going. Watched this before publishing and its been sticking right with the trend lines.

BTC Support ChannelJust watching the theory I have in place that BTC has a line of support and is consistently consolidating in this small channel. From others I have been hearing BTC will go down.

EURUSD | MT Long H4 |Overly OversoldPair: FX:EURUSD
Timeframe: H4 - Medium Term (MT)
Direction: Long
Technical Confluences for Trade:
- Stochastics are in Oversold Conditions on D1, H4 and H1 time-frames
- Price action has some support trend-line holding it
- Horizontal trendline looks like a demand zone across the years
- Horizontal trendline (Red) is at the 1% Fib Extension Level
- Aiming for the 32.8% Fibo Retracement with 23.6% as the TP 1 level
Fundamental Confluences for Trade:
- EUR weakness has been mostly been pricing in the expectation that ECB will cut in June and diverge from the FED. Currently, priced in.
- Risk is further war escalation from the Israel-Iran tension
Suggested Trade:
Entry @ Area of Interest 1.0620 - 1.0650
SL @ 1.0589
TP 1 @ 1.0698 (Close Half-Position & move SL to Entry level once TP1 is achieved)
TP 2 @ 1.0758
Risk-to-Reward @ Approx. 2.44 (Depending on Entry Level)
May the pips move in our favor! Good luck! :D
*This trade suggestion is provided on an advisory basis. Any trade decisions made based on this suggestion is a personal decision and am not responsible for any losses derived from it.

$SPY daily trend breakoutAMEX:SPY has broken above the April trendline as it sits below monthly support/resistance levels.
Note : there is a new gap to fill below from fridays significant gap up at open.
Question : Can someone tell me if that is a bullish doji star?

EURGBP Buy IdeaOANDA:EURGBP has given a strong upside breakout from previous 4 weeks range. It has been retracing towards fib 50-75% levels where we can look for buy side setups.

NMDC :: Iron Ore Rebounds?NSE:NMDC
- Script sees a breach of Monthly Bearish GPZ alongside Quarterly Bearish GPZ making it a "HOT PIVOT LEVEL" to keep on radar!
- Money Zones are marked alongside in 3 different shades as per the analysis from FUNDFLUX .
- This "Pivot & Price" action is been seen as iron ore prices have rebounded after 2weeks of down-fall and are further expected to rise on the hope of rate cuts from the West and fresh stimulus from China.
- If the trajectory remains strong supported by the anticipated news that this script can see a potential upside of 15-30% on upper levels of 255/280/310.
News Article is provided below -
www.moneycontrol.com

FUBO Elliow WXY Double CorrectionFUBO started its rally from $0.96 in March 2023 and reached $3.87 in August 2023. Since August 2023, it has been declining with the Elliot WXY correction wave.
I think this correction will continue until the gap at $ 1.18 is filled. My guess is that this correction will continue until around $ 1.12-1.2. Unless it goes above $1.9, I am short FUBO.

AUDCAD - BEARISH CONTINUATIONPrice could possibly break back above to fill the range.
Looking for a break and close above the resistance level at 0.88495, then waiting for a minor pullback to retest the level before placing a buy order to fill the range.
Ideally I would prefer to see price continue to the downside with a break and close below the 0.88220 level, as current trend is bearish.
Again for sells I am looking for a break and retest before entering a position.
Targeting 0.87825 level where I will look to close 50% and move my stops to BE, with a full TP target at 0.87555.

BTC S&R for the current rangeThis chart represents the support and resistance points for the current range we are in. The thicker the line the heavier the support or resistance. The two bright green lines below are support areas from the last bull run and are very important to hold or we will see a 50K BTC.

XJO on major supportASX 200 Index (XJO) closed yesterday sitting on major support line @ 7603.
Long-term higher highs have previously been established since 2021 indicating overall positive market growth.

ETH 1D | IdeaThere is a possibility that it may fall after giving an upward correction. If the price defends the invalidation area, it can go to higher levels. If it doesn't, it can target lower levels.

NIO about to become SINGLE DIGIT StockGap between $9-10 range and local resistance is rejecting the price really well.
Next major support is also untested and price could reach there since there is no EXHAUSTION VOLUME.
and rest...
Idea well explained in the chart.
This is not a financial advice.

Powering the Future: Novonix (NVX) Charges Ahead ASX:NVX Novonix Limited, a company specializing in advanced battery materials and technology, has recently received a significant boost with its strategic partnership & off-take agreement with Panasonic Energy.
The supply deal with Panasonic signals a strong vote of confidence in Novonix's synthetic graphite technology, which boasts superior performance characteristics compared to traditional graphite materials. With Panasonic being a prominent supplier to major EV manufacturers like Tesla & Mazda, this partnership opens up significant growth opportunities for Novonix within the rapidly expanding EV market and solidifies Novonix's position as a crucial player in the supply chain for synthetic graphite batteries, particularly for electric vehicles (EVs).
Adding to the excitement, Jeff Dahn, a celebrity in the battery field, serves as the Chief Scientific Advisor at Novonix. Dahn's decision to transition from his leadership role at Tesla’s Advanced Battery Research group to advise for Novonix speaks volumes about the company's innovative vision. Notably, Professor Dahn and his research team maintain collaborations with Tesla, further bolstering Novonix's industry credibility and strategic vision.
Novonix's proprietary battery testing equipment and services have garnered widespread acclaim within the industry. Their cutting-edge technology enables more accurate and efficient testing of lithium-ion batteries, addressing a critical need for battery manufacturers striving to enhance performance and reliability.
In addition to its technological prowess, Novonix boasts a robust intellectual property portfolio, including patents and proprietary processes, providing a solid foundation for long-term growth and competitive advantage in the burgeoning battery market.
The global push towards decarbonization and electrification further amplifies Novonix's bullish outlook. As governments worldwide enact stricter regulations on emissions and incentivize the adoption of electric vehicles, the demand for advanced battery materials is poised to skyrocket. Novonix stands at the forefront of this revolution, positioned to capitalize on the surging demand for high-performance batteries.
Novonix's alignment with industry stalwarts like Panasonic, coupled with Jeff Dahn's Tesla connection and its pioneering technology, positions the company for sustained growth and leadership in the dynamic battery market. As the demand for high-performance batteries continues to soar, Novonix stands poised to capitalize on this trend, delivering value to investors and stakeholders alike.
The Technicals: In analyzing the technical aspects, it's noteworthy that ASX:NVX (ASX) recently rebounded from a significant resistance level at $0.530, indicating strong buying interest. I believe ASX:NVX is at a discounted price and has great upside potential. #Bullish

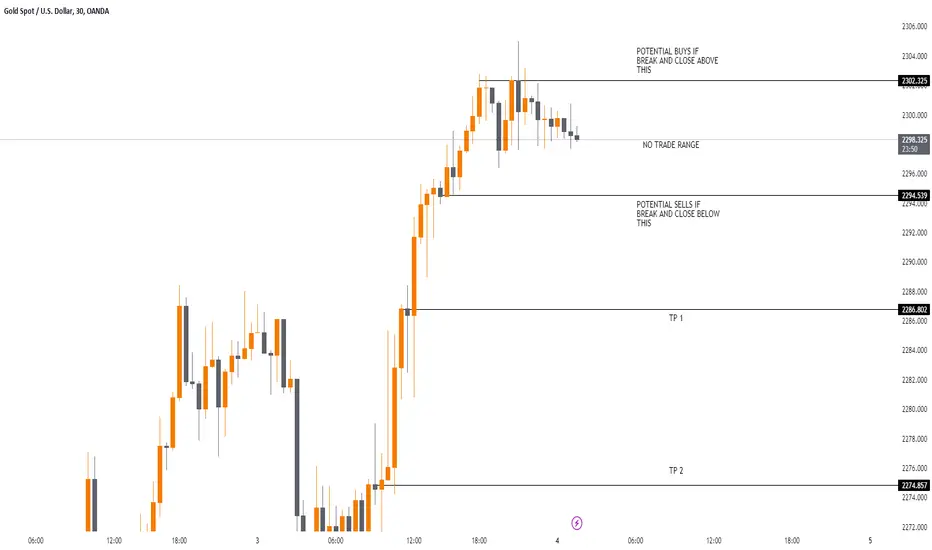
WILL XAUUSD REBOUND FROM 2300 ? 💼✨Embark on a Golden Odyssey! 💫💎✨
🔥 Attention, savvy traders! Prepare to plunge into the radiant realm of GOLD! 💫 With XAUUSD taking center stage, let's navigate the twists and turns of this captivating market. 💰📈
🌐 As the golden bull charges ahead, shattering records like never before, it's crucial to remain alert amidst the whirlwind of opportunities. 📊💥 But fret not! Within the narrow confines of 2302.50 to 2294.50 lies both caution and potential. 🚀🔒
🔮 Peer into the crystal ball, and you'll catch a glimpse of the potential for an exhilarating downward correction. Yet, in this dance of fortunes, lies the essence of trading wizardry! 🌈✨
📈 Envision this: A daring breach above the range could ignite a frenzy of buying, propelling us to the lofty peaks of 2310.50 . Conversely, if we descend below, seize the opportunity to sell and gracefully ride the waves down to 2287 and 2275. 📉🚀
🤓 Your journey through this analysis isn't just informative; it's actionable! 🚀 Let your support amplify these vibes, and remember, trade smart, trade safe. 💡✅
✌️ Until we meet again, may your trades be bountiful and your path adorned with triumph! 🌍💫💰