LINK/USDT 4HInterval ChartI invite you to review the LINK chart on a four-hour interval. As we can see, the price has overcome the downward trend lines, but currently the blue lines mark the upward trend channel that the price has created with upward movements.
Let's start by laying out the Fib Retracement grid, which will help determine price support points, and we can see that first we have support at $14.80, and then we can see a strong support zone from $13.10 to $12.20.
Looking the other way, we can similarly determine the resistance areas that the price must face. And here you can see the price approaching a strong resistance zone from $16.48 to $17.64. If the price breaks out of this zone and tests it positively, we may see increases towards the resistance level of $31.
Please look at the RSI indicator because you can see that we are approaching the upper limit, but there is still room for further increases. However, the STOCH indicator shows an increase to the upper limit, which limits the upward movement and may result in a price recovery.
Supportandresitance

BTC 1H Bearish Pennant?Hello everyone, I invite you to check the current situation on BTC in the USDT pair, taking into account the short interval of one hour.
We will start by defining the downward trend line in yellow, and here we can see how the price left this line sideways and formed the so-called Bearish Pennant, which we used blue lines to mark.
It's worth taking a moment to discuss Bearish Pennant here, as it is characterized by a downward price breakout. We can determine the stoploss level and then go lower and determine the entry level if we want to play a short position. And in this situation, you can often see a breakout at the height level between the stoploss position and the entry into the position.
Now we can move closer to the chart taking into account recent price movements in order to check for resistance points in the event of a trend reversal. And here, after unfolding the trend based fib extension grid, you can see resistance at the level of $43,124, and then, near the designated stoploss, you can see the resistance zone from $43,882 to $44,281.
Looking the other way, we can similarly identify support areas when the price starts to fall lower. And here you can see how the price is based on the support zone from $42,518 to $42,225, but if the zone is broken, we will see support around $41,393.
At this point, it is worth turning on the EMA Cross 10 and 30 indicator, because we can see how the red line crossed the green line from above, which confirms the return to the local downtrend.
The RSI indicator shows that it has started to reverse after crossing the middle of the range and still has room to decline. However, the STOCH indicator shows that energy is starting to run out, which may cause the price to slow down again.

SOL Short-Term 1HLet's look at the SOL to USDT chart on a one-hour time frame. As you can see, the price is moving above the local uptrend line.
After unfolding the trend based fib extension grid, you can see support at $99, and then a zone from $95 to $93.
Looking the other way, we see a resistance zone from $103 to $105, and then resistance at $110.
The RSI shows room for the price to go higher, but the STOCH indicator indicates a needed price recovery.

XAUUSD OAK Meltdown Trend Forecast for JAN 17 2024I think gold might be about to melt. This support and resistance just turned evident to me looking at the price on 4H. Although I'm bullish on gold, and I believe the price is set to break last ATH sometime soon, it might be stretching the slingshot a bit more for that to happen.
We will find out soon I believe.
OAK

XAUUSD BUY & SELLHi Friends,
Another analysis on gold. As always I keep everything simple. So we have multiple levels of buy and sell. Our immediate sell level is 2047-2049 which price has reacted to.
Below it we have level 27-29 as our demand level and also below it another one. in case market continues rallying up we have couple supply levels like area 61 and 73.
So we have to wait for the NEW YORK session in order to see the direction of the market.
*make sure to pay attention to the PPI news being published later today
Be honorable

New Trade: XAUUSD - Long Position New Trade: XAUUSD Long Position
Entry: 2028
Stop Loss: 2025.50
Take Profit: 2042
Trade Strategy:
Initiating a long position with an entry at 2028, a stop loss at 2025.50, and a take profit at 2042. This strategy is designed to capture potential upward momentum while keeping risk exposure controlled.
Low Risk, High Reward Trade:
This XAUUSD trade positions itself as a low-risk, high-reward opportunity. With an entry at 2028 and a tight stop loss set at 2025.5, the risk exposure is minimized. This strategic approach aims to capitalize on potential upward movement.
Risk-Reward Ratio (RRR): 5.6:1:
The trade boasts an impressive Risk-Reward Ratio of 5.6:1, indicating the potential for a substantial reward compared to the risk undertaken. This ratio underscores the calculated nature of the trade, aligning with prudent risk management principles.
Technical Analysis:
The decision to go long is supported by technical analysis, with the entry point coinciding with favorable market conditions. The trade leverages a precise entry and stop loss to enhance the risk-reward profile.
Disclaimer:
Trading involves risk, and past performance is not indicative of future results. Conduct thorough analysis and exercise due diligence before making trading decisions. Happy trading! 🌐📈

BNB/USDT Short-Term 1HHello everyone, let's take a look at the BNB to USDT chart on a one hour time frame. As you can see, the price is moving above the local uptrend line.
After unfolding the trend based fib extension grid, you can see support at $311, and then a support zone from $299 to $293.
Looking the other way, strong resistance appears at $324, followed by a resistance zone from $338 to $345.
The RSI indicator is recovering with room for further decline, while the STOCH indicator has a temporary rebound, which keeps the price falling.

Maverick Protocol MAV Coin Price Prediction🔥 Price on the 4H chart might come at these support area and we might get a potential bounce🔥
Potential bounce areas for Buying 0.5661 and 0.5209
👉 Follow me for More Real Time Opportunities.
Share your Thoughts if you have any?

New Trade: EURNZD - Short Position (SELL LIMIT)New Trade: EURNZD - Short Position (SELL LIMIT)
Sell Limit: 1.7740
Stop Loss: 1.7780
Take Profit: 1.7550
Technical Analysis:
Initiated a short position on EURNZD with a Sell Limit set at 1.7740. The decision is anchored in technical analysis, specifically targeting the Fibonacci "golden zone" and incorporating the Anchored VWAP for additional confirmation.
Rationale:
The Fibonacci retracement levels indicate a potential reversal within the "golden zone," supported by the Anchored VWAP for enhanced technical conviction.
Risk Management:
A defined Stop Loss at 1.7780 is in place to manage risks effectively, ensuring a disciplined approach to protect capital against unexpected market movements.
Trade Strategy:
Take Profit set at 1.7550 aligns with the anticipated downward movement. The combination of Fibonacci levels and Anchored VWAP serves as a robust strategy for this short position.
Disclaimer:
Trading involves risk, and past performance is not indicative of future results. Exercise caution and conduct thorough analysis before making trading decisions.
Happy trading!

WHATS NEXT FOR BITCOIN? 📉📈New Trade: BTCUSD - Short Position (SELL LIMIT)
Sell Limit: 44300
Stop Loss: 46500
Take Profit: 35250
Market Overview:
Bitcoin (BTC) has witnessed substantial volatility over recent years, hitting a high of $67,000 before experiencing a significant pullback during the "crypto winter." Presently, BTC is engaged in a period of oscillation as it seeks recovery.
Trade Strategy:
Initiating a short position with a Sell Limit at 44300, a Stop Loss at 46500, and a Take Profit at 35250.
Fibonacci Golden Zone:
Notably, the current market conditions position BTC in the Fibonacci golden zone, a key level with historical significance.
Short-Term Expectation:
Despite the overall bullish sentiment for Bitcoin, the Relative Strength Index (RSI) signals an overbought condition, introducing a bearish signal. This trade aims to capitalize on the potential downside movement.
Long-Term Outlook:
A longer-term outlook targeting $60,000 is plausible, given recent attempts to establish a bottom and signs of strength observed over the past monthly candlesticks. However, patience is key as a decisive upward move may take time, but with the halving coming up in April 2024 - anything is possible!
Technical Indicators:
Headwinds, such as rising interest rates, have impacted Bitcoin's recent performance. The RSI, signalling overbought conditions, suggests a potential corrective move. Additionally, the 21 EMA is crucial; a resistance above this level could generate bullish signals.
Risk Advisory/Disclaimer:
Trading involves risk, and the cryptocurrency market is known for its volatility. Prudent risk management is advised to navigate market dynamics.
Past performance is not indicative of future results. Conduct thorough analysis and exercise due diligence before making trading decisions. Happy trading! 🌐📉

BITCOIN GAPS IN PERFECT LOCATION!!?! Still Bullish!There are 2 gaps on the #CME that will most likely get filled.
A short move up to fill the most recent gap , then a move down to fill the gap around $39500.
This will still keep #Bitcoin in an HTF uptrend.
Calculate Your Risk/Reward so you don't lose more than 1% of your account per trade.
Every day the charts provide new information. You have to adjust or get REKT.
Love it or hate it, hit that thumbs up and share your thoughts below!
This is not financial advice. This is for educational purposes only.

ETH/USDT 4H ChartI invite you to review the chart of ETH in pair with USDT, also on a four-hour time frame. You can see here a similar movement behavior as in the BTC chart, it can also be defined with blue lines, a local channel of an upward trend, in which the price remains for now.
Going further, it is worth spreading the fib retracement grid to determine price supports. And as you can see, the first support at $2,472 maintains the current declines, we will further define the support zone from $2,319 to $2,209, and when the price breaks out of this zone it may go down to $2,071
Looking the other way, you can see that the resistance level at $2,553 stops the price from making larger moves, but if we come out on top, it is still worth marking the resistance zone from $2,664 to $2,720, which stops the price from moving towards $2,900.
In this situation, it is worth looking at the EMA Cross 10 and 30 indicator, because you can see how the red EMA Cross 10 line is approaching the intersection of the green EMA Cross 30 from above, which could give a local downward impulse.
On the RSI indicator, we reached the middle of the range, with room for further movements, while the STOCH indicator rebounded dynamically, but this may indicate a temporary local movement of the side trend.

BTC/USDT 4H Interval Chart ReviewHello everyone, I invite you to check the current situation on BTC in the USDT pair, taking into account the four-hour interval. First, we will use blue lines to mark the local channel of the upward trend, from which we could observe how the price dynamically breaks out from the bottom. After determining the height of the channel, we can see that the price drop after leaving it at the bottom resulted in a similar level of declines.
Now we can move on to marking support areas in case the correction begins to deepen. And here, after unfolding the Fib Retracement grid, it is first worth marking the support zone from $42,521 to $40,791, but when we fall below this zone, we may experience another quick price drop to around $35,689. Even to confirm, after unfolding the trend based fib extension grid, it can be seen that the level of the lower border of the support zone coincides with the level of 1.618fib, while the support below coincides with the level of 2.618fib.
Looking the other way, in a similar way using a fib retracement mesh, we can determine the places of resistance. Here we will start by identifying the resistance at $44,356, then it is worth considering the resistance zone from $47,377 to $48,999, which includes the currently established peak, and then we see resistance around $53,512.
After turning on the EMA Cross 50 and 200 indicator, you can see that despite the strong rebound that was triggered by events related to spot etf on BTC. resulted in a decline of approximately 15%, but the indicator still indicates a strong upward trend.
The RSI indicator shows a slight increase despite a slight price change on the chart, while the STOCH indicator shows a strong upward movement, which creates room for a new downward impulse that we should keep an eye on.

Radworks RAD Coin Price Prediction🔥 Price on the 4H chart might come at these support area and we might get a potential bounce🔥
Potential bounce areas for Buying 2.107 and 1.780
👉 Follow me for More Real Time Opportunities.
Share your Thoughts if you have any?

BTC/USDT 1HInterval ChartHello everyone, let's take a look at the BTC to USDT chart on a one hour time frame. As you can see, the price is getting closer to leaving the triangle and taking a direction.
When we unfold the fib retracement grid, we can see a fight against strong resistance at the level of $43,033, and then we can see the zone from $43,454 to $43,989.
Looking the other way, there is support at $42,579, followed by a support zone from $41,882 to $41,504.
On the RSI indicator we are returning to the middle of the range, while on the STOCH indicator we are again approaching the upper limit, which may result in a new price recovery.

XAI Coin Price Prediction🔥 Price on the 4H chart might come at these support area and we might get a potential bounce🔥
Potential bounce areas for Buying 0.5646 and 0.4692
👉 Follow me for More Real Time Opportunities.
Share your Thoughts if you have any?

Celestia TIA Coin Price Prediction🔥 Price on the 4H chart might come at these support area and we might get a potential bounce🔥
Potential bounce areas for Buying 16.7888 and 15.4400
👉 Follow me for More Real Time Opportunities.
Share your Thoughts if you have any?

BTC/USDT 1DInterval Chart Hello everyone, I invite you to review the BTC to USDT chart, taking into account the one-day time frame. And here we will start by defining the upward trend channel with the blue lines, in which the price has rebounded from the upper limit and we are now observing a local rebound.
Let's now move on to laying out the Fib Retracement grid from the price high of the last bull market to the bottom. And here we see that the price has touched our golden fib point of 0.618, at which we could observe a market recovery in previous cycles,
however, here it is worth spreading the fib grid again, thanks to which we can see that these levels coincide and we can still determine a zone of strong resistance from $57,714 to $69,240, only when the price goes above this zone can we see potentially further increases, where a barrier in around $100,000.
In order to determine supports, if the correction turns out to be larger, we will again spread the fib retracement grid, this time from the bottom to the current peak, and here we can see support at the level of $36,555, and another very strong one around $28,353.
However, here, after redistributing the grid taking into account the recent upward movement, we can expand the support areas to support zones and the first zone is from $36,500 to $33,890, while the second one is from $29,780 to $28,250.
Finally, please look at the RSI indicator, which shows a rebound in which we are fighting to break the local upward trend, while the STOCH indicator shows a rebound with room for deepening the current correction.

BTC Spot ETF, mixes the marketBTC is experiencing large price fluctuations related to the BTC spot etf, which has been accepted this time. However, it can be seen that the price has returned to the local downtrend line.
After unfolding the trend based fib extension grid, we can see the resistance zone from $45,297 to $44,288, and further we can see a decline to around $41,375.
Looking the other way, you can see resistance at $46,906, and then a resistance zone was formed from $48,301 to $49,022, which keeps the price from increasing further.
The RSI indicator shows a strong recovery, but there is still room for a larger decline, while the STOCH indicator approached the lower limit, which resulted in the correction slowing down.

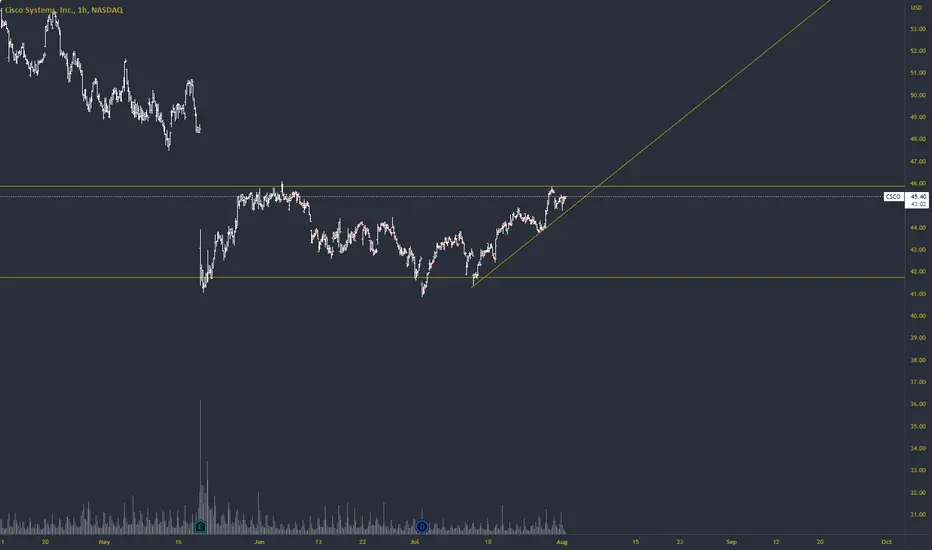
Trend Line or Resistance, Which one will it be?Solid trend line formed at resistance on CSCO. Long if there's a breakout here.
Ethereum Name Service ENS Coin Price Prediction🔥 Price on the 4H chart might come at these support area and we might get a potential bounce🔥
Potential bounce areas for Buying 18.40 and 15.61
👉 Follow me for More Real Time Opportunities.
Share your Thoughts if you have any?

Ethereum Classic ETC Coin Price Prediction🔥 Price on the DAILY chart might come at these support area and we might get a potential bounce🔥
Potential bounce areas for Buying 27.30 and 25.22
👉 Follow me for More Real Time Opportunities.
Share your Thoughts if you have any?

LINK/USDT 4H ChartI invite you to review the LINK chart taking into account the four-hour interval. Here we will start by defining, using the blue lines, the upward trend channel from which the price broke out at the bottom, but we can see a quick return and a fight to return to the channel. At this point, it is also worth marking the local downward trend line in yellow, which the price has broken with an upward movement.
Looking at the current situation, we will spread the Fib Retracement grid, thanks to which we can confirm the place of return to the channel, as the first significant resistance at the level of $14.28, then we have a visible second resistance at the level of $15.57, and then located at the upper border of the upward trend channel , a strong resistance zone from $16.50 to $17.67.
Please look at the EMA Cross 10 and 30 indicator as we can see the red ema cross 10 line attempting to cross the green ema cross 30, potentially indicating a return to the local uptrend. However, it is worth being careful whether this is just a false breakout and the price will start to reverse.
In such a situation, we will unfold the fib retracement sheet again to determine the supports. And here you can see support at the level of $13.79, and then it is worth marking the support zone from $12.74 to $12.19, if this zone is broken, we can see the price return to around $10.59.
Now it is worth switching to the RSI indicator, which shows an upward trend line that gives rise on the chart, with room for new movements, but after switching to the STOCh indicator, we see that a downward trend has begun, which may, however, result in a price correction.
