ETH/USDT 4HInterval ChartHello everyone, I invite you to review the chart of ETH in pair with USDT, on a four-hour interval. First of all, we can use the blue lines to mark the upward trend channel from which we could observe a breakout at the bottom, after which the price struggles to maintain the level.
Now let's move on to marking the support places. We will use the Fib Retracement tool to mark the supports, and as you can see, the price has dynamically returned and remains in the support zone from $2,243 to $2,191, then there is support which stopped the price drop around $2,120, but if the price breaks out of it, we can see a return in around strong support at $1918.
Looking the other way, we can similarly mark places where the price should encounter resistance on the way up. And here again the resistance level is $2,302, then there is a strong resistance zone from $2,365 to $2,445, which stops the move to around $2,674.
When we turn on EMA Cross 10 and 30, we can see confirmation of a potential downward trend.
The RSI indicator shows a strong recovery, a return to the place where the price rebounded previously, but with room for the price to go lower, while the STOCH indicator also shows a strong recovery with visible room for another decline.
Supportandresitance

BTC Long-Term Hello everyone, I invite you to check the long-term view of the situation of BTC in pair with USDT. For this purpose, we will start by defining the main downward trend line using the yellow line, from which the price, after going up, began to create the current upward trend channel marked in blue.
Going further, using the Fib Retracement grid, which should be spread from the last price peak to the bottom, we will determine a very strong resistance at $48,634 at 0.618 Fib, the so-called golden Fibon point, at which the price had a pre-halving correction in previous cycles.
Further, taking into account the latest local movement, we will spread the trend based fib extension grid, thanks to which we can expand the resistance to the resistance zone from $46,729 to $48,634. This is a zone with very strong resistance on the way to the new ATH.
Looking the other way, you should determine the support points when the price starts to recover, similarly here, from the price bottom, we will spread the Fib Retracement grid and determine the support at the level of $34,566, and the second one at the level of $27,297. At this point, taking into account the recent increase, we will again unfold the fib retracement grid, thanks to which we can see additional support at the level of $37,990, and the support lower can be extended to the support zone from $34,566 to $33,092.
Please look at the RSI indicator, which shows that there is a lot of room for further price recovery, and if we look at the STOCH indicator, it also shows room for recovery.

Relief for Bears.... Bears having a Good startFirst of all, Happy New Year to you guys
1) Rejection from 0.5FIB
2) Old support turning into resistance
This is not a financial advice. This is just a speculative idea and please DYOR before trading.
Please do upvote if you like this idea.
INDEX:BTCUSD

XAUUSD BUY & SELL Scenario Hello Friends,
Another Gold analysis , So market is currently at 2065, our immediate supply level is 2068 which market has already reacted to. Should price go up then area around 78-81 would be good for a sell and also area around 84-88.
In case dollar strengthen we should expect a drop to around 55 and 45
So as always make sure you have these levels around for a trade but add your own logic and intuition into it.
Be honorable.

SEI Coin Price Prediction🔥 Price on the 4H chart might come at these support area and we might get a potential bounce🔥
Potential bounce areas for Buying 0.5969 and 0.4410
👉 Follow me for More Real Time Opportunities.
Share your Thoughts if you have any?

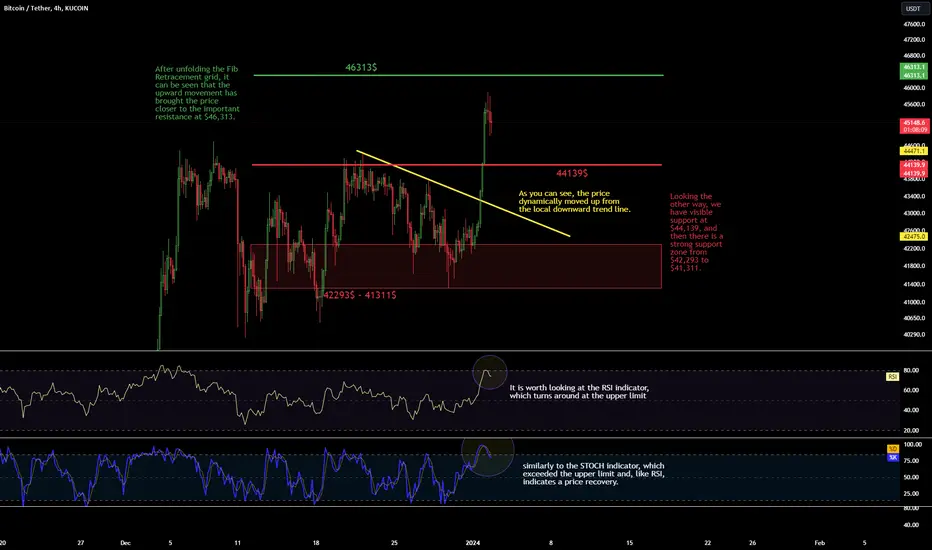
BTC/USDT 4HInterval Support and ResistanceHello everyone, let's take a look at the BTC to USDT chart on a four-hour time frame. As you can see, the price dynamically moved up from the local downward trend line.
After unfolding the Fib Retracement grid, it can be seen that the upward movement has brought the price closer to the important resistance at $46,313.
Looking the other way, we have visible support at $44,139, and then there is a strong support zone from $42,293 to $41,311.
It is worth looking at the RSI indicator, which turns around at the upper limit, similarly to the STOCH indicator, which exceeded the upper limit and, like RSI, indicates a price recovery.
Filecoin FIL Coin Price Prediction🔥 Price on the 4H chart might come at these support area and we might get a potential bounce🔥
Potential bounce areas for Buying 7.108 and 6.251
👉 Follow me for More Real Time Opportunities.
Share your Thoughts if you have any?

Keep3rV1 KP3R Coin Price Prediction🔥 Price on the 4H chart might come at these support area and we might get a potential bounce🔥
Potential bounce areas for Buying 93.58 and 78.64
👉 Follow me for More Real Time Opportunities.
Share your Thoughts if you have any?

Bitcoin AnalysisSo many ways you can look at Bitcoin and all say the same thing. My goal is to highlight the different perspectives in the market Crypto.
1. Eaglizer Strat Daily: Price needs to reclaim 8 EMA (white moving average) for upside.
2. Range: Price needs to reclaim the Median level (white dotted line) for more upside.
3. Trendline: Price needs to reclaim the Trendline (yellow) on for upside.
In summary we're at an area that will determine if we are going to reclaim and continue higher or go down for a correction.

Tellor TRB Coin Price Prediction🔥 Price on the 4H chart might come at these support area and we might get a potential bounce🔥
Potential bounce areas for Buying 277.587 and 261.029 and 212.172
👉 Follow me for More Real Time Opportunities.
Share your Thoughts if you have any?

Ontology ONT Coin Price Prediction🔥 Price on the 4H chart might come at these support area and we might get a potential bounce🔥
Potential bounce areas for Buying 0.2956 and 0.2621
👉 Follow me for More Real Time Opportunities.
Share your Thoughts if you have any?

Nearby supports and resistances for BTCNearby supports and resistances for BTC. As you can see, the price remains above the local upward trend line.
After unfolding the trend based fib extension grid, you can see the support zone from $42,370 to $42,228, and then we have support at the level of 41,821.
Looking the other way, we see resistance at $42,706, while further we have a strong resistance zone from $43,080 to $43,281.
We have exceeded the upper limit on the RSI, but looking at the STOCH indicator we can see a greater price recovery.

Internet Computer ICP Coin Price Prediction🔥 Price on the 4H chart has broken out from the Triangle Pattern 🔥
Potential Target areas for take profits 12.021 and 15.787
👉 Follow me for More Real Time Opportunities.
Share your Thoughts if you have any?

ETH/USDT 1HInterval Short-Term ChartNearby Supports and Resistances for ETH will support USDT. As you can see, the price remains below the local downtrend line.
After unfolding the Fib Retracement grid, you can see the support zone from $2,281 to $2,234, while there is support at $2,178.
Looking the other way, there is resistance at $2,326, and then there is a strong resistance zone from $2,406 to $2,445.
On the RSi indicator, we returned to the middle of the range, but looking at the STOCH indicator, we can expect a deeper correction.

The "What" vs "Why" Series - (1) TRILTransformers & Rectifiers Ltd: TRIL
When any Stock faces a Sudden Crash or a Sudden Rise - many Retail Investors go Ga-Ga over the question "Why why why did it happen ??" - especially on a crash. Their worry is on whether to Hold or Exit their holdings
Such violent moves typically are caused due to some NEWS. Obviously we all have a portfolio of atleast 20+ diversified stocks and it's not humanly possible to keep Real-time track of every News around the counter. So Why do we really worry about the "Why" ???
The Real Question to ask is "What do we do now" - and the answer is
1. Refer the Support and Resistance levels on the chart
2. Check for any potential Breakdown of Structures like Parallel Channel, Flag Breakdown etc...
3. Most importantly check the Higher Timeframes Weekly / Monthly
Manytimes a Pattern Breakdown on Daily just forms a Wick (SL Hunting) on Weekly or Monthly - Fooling us
Let's see with an example
TRIL - Weekly Chart:
1. Multi year Parallel Channel - Upward
2. Repeating "Cup" patterns
During Late July - there was a News from one of the Clients of TRIL accusing the company of defrauding them of marking an order as complete but consignment was not received. The stock crashed 20% same day - even before the TRIL management could respond. The crash continued from 110 to 80 for 2-3 sessions.
Think again - it's just an accusation - yet to be responded, yet to be proved. But due to Media Hype retail investors sold in Panic - many in loss. Does it really make sense ???
From a Pattern wise - "Repeating Cups".
1. Whether the Cup forms slowly or it hits the Bottom of the Cup is hit in 2-3 days - does it really matter ?
2. 6 months down the line - when someone is analysing the chart - would you see a Repeating Cup or do you remember why it fell to bottom of Cup everytime ???
3. THINK AGAIN - we only see a Cup irrespective of the reason. And when bottom of Cup is reached it rises almost 2x higher. Thats what chart shows.
I had position at 100, when it reaxhed 78 and started rising I averaged at 82 and had conviction to hold and made amazing gains in just couple of months to 170 levels - all 3 targets given earlier were hit 🎯💯
The reason for my conviction is "accusation is not proven" and "pattern repetitions are not broken" + "support levels intact"
This is why our motto is "Learn to Ride the Tide - Irrespective of its Side"
Forget "Why things happened"...Focus on "What to do"
- Team Stocks-n-Trends

WazirX WRX Coin Price Prediction🔥 Price on the 4H chart might come at these support area and we might get a potential bounce🔥
Potential bounce areas for Buying 0.2190 and 0.1853
👉 Follow me for More Real Time Opportunities.
Share your Thoughts if you have any?

FTX Token FTT Coin Price Prediction🔥 Price on the 4H chart might come at these support area and we might get a potential bounce🔥
Potential bounce areas for Buying 3.1903 and 2.8977
👉 Follow me for More Real Time Opportunities.

Bitcoin short to $3800 area
Shorted 1.5 coins BTC/USD on FTMO at $42,081.05. Looking to pass the $200,000 swing trade account and this is my first trade. Looking for a break down of that level highlighted in blue with a move down to around $38,000 where the next large level of support seems to be. BITSTAMP:BTCUSD
On a seasonal basis, BTC tends to see poor returns in January, starting particularly on January 8th to January 28th. So I may be a little early and get stopped out -- but the price action seemed like a good bet right now for a breakdown. If I do get stopped out I may wait a few more days and try to get short again at a higher level.

Vulcan Forged PYR Coin Price Prediction🔥 Price on the 4H chart might come at these support area and we might get a potential bounce🔥
Potential bounce areas for Buying 7.613 and 5.850
👉 Follow me for More Real Time Opportunities.
Share your Thoughts if you have any?

Bonk Coin Price Prediction🔥 Price on the 4H chart might come at these support area and we might get a potential bounce🔥
Potential bounce areas for Buying 0.000020266 and 0.000013512 and 0.000008696
👉 Follow me for More Real Time Opportunities.

Optimism OP Coin Price Prediction🔥 Price on the 4H chart might come at these support area and we might get a potential bounce🔥
Potential bounce areas for Buying 3.345 and 3.074
👉 Follow me for More Real Time Opportunities.
Share your Thoughts if you have any?

eCash XEC Coin Price Prediction🔥 Price on the 4H chart might come at these support area and we might get a potential bounce🔥
Potential bounce areas for Buying 0.00003729 and 0.00003216
👉 Follow me for More Real Time Opportunities.
Share your Thoughts if you have any?

MKR/USDT 4HInterval ChartI invite you to review the chart of MKR in pair with USDT, on a four-hour interval. First, we will use the yellow line to mark the upward trend lines above which the price remains.
Going further, we can move on to marking support areas when we start a larger correction. And here, after unfolding the trend based fib extension grid, the first support is at the price of $1,537, and then it is worth defining the support zone from $1,410 to $1,343.
Looking the other way, we see that the price has been rejected by the resistance at $1,680, only when we manage to break out of it can we see an attempt to grow towards the resistance zone from $1,849 to $1,936.
Please look at the CHOP index, because you can see that the current price recovery gives an increase in energy for a new move, the RSI indicator shows a rebound with room for a further decline, and the STOCH indicator behaves similarly, which also has room for the price to go a little lower.
