Supportandresitance

Total account value: $374.50. Goal: $5,000. Follow this post. 🔥I have been practicing for exactly 1 month.
Took two accounts from 200 to 600/800.
But the gains did not hold up well. So I refined my strategy again and again.
Time to share the journey with you as it's happening. Going to post daily updates and trade reviews in the updates of this idea.
The goal is $5,000.
There will be bumps in the road, but I will try to prevent major setbacks.
You WILL need:
Cash account. Not margin.
Patience.
Discipline.
Take gains quickly. Stop waiting for moonshots.
Will be using trend analysis, chart patterns, etc. Get hyped.
Let's get this money - get ready and follow me/ this post.

BNB growth after launchpool announcementI invite you to discuss the BNB chart on a four-hour interval. As we can see, the price has broken our yellow downtrend line with dynamic upward movements that are associated with the newly announced Lanchpool on the Binance exchange.
Due to the sudden increases after unfolding the trend based fib extension grid, we see that the price is fighting a strong resistance at $261, only when the price overcomes it will the path towards the next resistance at $279 open.
Looking the other way, we have visible support at the level of $252, then there is a visible support zone from $242 to $236, while a break from the bottom may result in a drop to the support level at $220.
When we turn on the EMA Cross 50 and 200 indicator, we will see confirmation of the return to the upward trend.
On the RSI indicator, we have approached the upper limit, which reduces the room for growth, while on the STOCH indicator, we are moving above the upper limit, which may result in a rebound in the coming hours.

ETH/USDT 4HInterval ChartHello everyone, I invite you to review the ETH pair to USDT chart, also on a four-hour time frame. First, we can use the blue lines to mark the downward trend channel in which the price moves at the upper limit.
Now let's move on to marking the support places. We will use the Fib Retracement tools to mark the supports, and as you can see, the first support is at $2,185, the second support is at $2,134, and then there is a support zone from $2,098 to $2,052.
Looking the other way, we can similarly mark places where the price should encounter resistance on the way up. And here we have visible resistance at the level of $2272, at the upper border of the channel, then we can mark the zone from $2335 to $2367, and then resistance at the level of $2460.
On the RSI indicator we are moving around the middle of the range, but when we look at the STOCH indicator, we will see that once again approaching the upper limit resulted in a price recovery.

Will BTC overcome the strong resistance zone?Hello everyone, I invite you to review the current situation on BTC in the USDT pair, taking into account the four-hour interval. First, we will use blue lines to mark the local channel of the downward trend, from which the price was higher and the increase itself was close to the height of the specific channel. Here we will also mark the local upward trend line in yellow, along which the price is rising.
Now, using the trend based fib extension grid, we can move on to marking support areas if the price changes direction. And here, first, we have visible support at the level of $42,810, then the second one at the level of $42,102, and then there is a visible strong support zone from $41,624 to $40,975
Looking the other way, we can similarly identify a strong resistance zone to which the price is approaching from $44,104 to $44,738. Only when we manage to come out on top and positively test the zone, we can see a move towards the next resistance at $46,563.
Please pay attention to the CHOP index, which indicates that we have less and less energy, the RSI indicator is approaching the upper limit, but there is still room for an upward movement, while the STOCH indicator again exceeds the upper limit, so we should be careful as it may result in a reduction upward movement.

gold intraday inverted head and shoulder pattern there big confusion between fed and market
because of that gold is not breaking above 2050 nor it is going below $2000
neckline is big horizontal resistance
breakout of neckline is necessary for new bullish trend on h1 time frame from 1973

EUR/JPY reaching 0.618 fib and a good supportLets wait and see what New York session provides us with opportunitets. We should not stress to much and take unnecessary positions. Wait for a bullish candlestick confirmation.
Good luck!

CHINA50 interesting LONG set upI don't usually trade CHINA50, when it comes to China I prefer HK50, but this is an interesting set up/amazing buying opportunity:
- RSI is very low - 29 on daily chart, RSI was 24 few days ago.
- 11000-11100 is a strong support level. Even in March 2020 the index found support at 11500
- I'm aware of economic situation, but I still believe that recession will hit US and European market really bad in 2024/2025, but this will be opportunity for China to grow in strength
- bearish move might be not over yet but once the trend reverses, I believe it can easily start movement towards 15000-16000 (in next 12 months or so)
*This is not a trading advice. Trading is risky. Always do your own analysis before entering the market.*

LINK/USDT 4HInterval ChartHello everyone, I invite you to review the LINK chart on a four-hour interval. In this case, we have a visible movement in the upward trend channel, where locally the price remains below a strong downward trend line.
Now let's move on to marking support points for the price and we can see that first of all we have a strong support zone from $14.38 to $13.58, which is located just at the lower border of the current channel, but if the price drops lower and breaks out of the channel , we can see a strong decline close to the height of the channel towards the support level of $11.26
Looking the other way, we can see that the price has currently bounced off the resistance level at $15.32, when we manage to break it higher, the price will move towards the strong zone and the upper border of the channel from the level of $17.14 to the level of 18.09 $.
Please look at the RSI indicator because you can see movements around the middle of the range, while the STOCH indicator, despite the increase, does not show a significant price increase on the chart, which may translate into further declines and an attempt to leave the channel at the bottom.

Plan fr 19th December 2023Nifty future and banknifty future analysis and intraday plan in kannada.
This video is for information/education purpose only. you are 100% responsible for any actions you take by reading/viewing this post.
please consult your financial advisor before taking any action.
----Vinaykumar hiremath, CMT

BTC/USDT 1HInterval Chart ReviewHello everyone, I invite you to check the current situation on BTC in the USDT pair, taking into account the one-hour interval. First, we will use blue lines to mark the downward trend channel where the price remains. However, inside the channel, the yellow line will indicate the local upward trend line from which the price broke down, moving in the local downward trend channel. Let us notice that in the channel we have three reflections from the upper boundary and two from the lower one, which may potentially translate into a further downward movement and a breakout from the channel at the bottom.
Now we can move on to marking support areas in the event of a correction. And here, first of all, it is worth marking support at the golden FIB point, at $40,734, and then we will define the support zone from $39,974 to $39,015.
Looking the other way, we can determine resistance locations in a similar way using the trend based fib extension tool. First, we will mark the resistance level at $41,816, from which the price has currently bounced, then we have visible resistance at the price of $42,553, and then the resistance zone which is decreasing more and more from $43,125 to $43,826.
Please pay attention to the RSI indicator because you can see a rebound and return to the middle of the range to the place where it previously caused a new decline, while if we look lower at the STOCH indicator, we will see a dynamic movement of energy, which again created room for the price to be pulled down.

ETH Short-Term 1H ChartHello everyone, let's take a look at the ETH to USDT chart, on a one-hour time frame. As you can see, the price is moving below the local downtrend line.
Let's start by determining the support line and, as you can see, the first support is at the level of $2,092, and then it is worth defining a strong support zone from $2,005 to $1,959.
Looking the other way, there is resistance at $2,187, and then there is a resistance zone from $2,262 to $2,301.
On the RSI indicator we can see that we still have not touched the lower limit, and when we look at the STOCH indicator we will see a strong rebound which creates room for another price drop.

BTC Short-Term ChartHello everyone, let's take a look at the BTC to USDT chart, on a one-hour time frame. As you can see, the price is moving below the local downtrend line.
When we unfold the Fib Retracement grid, we will see support at the level of $41,471, and then it is worth defining a strong support zone from $40,916 to $40,226.
Looking the other way, there is resistance at $42,991, and then we have a very strong resistance zone from $43,755 to $44,718.
It is worth paying attention to the RSI indicator, which shows a rebound, as well as room for the price to go lower.

FRONTLINE PLC Long - Dollar Cost AverageThis is an analysis of Frontline PLC - a Norwegian oil transportation company, the following is strictly my own personal opinion and does not constitute financial advice.
Key numbers:
Dividend yield expected 2024 - 17%
P/B - 2.03
P/E - 5.41
Market cap 47 178 MNOK (4.5 BUSD)
Analyst estimates:
Analyst estimate average for FRO is 267.5 NOK which is equivalent to a 32.3% increase from todays price.
Key information:
FRO has had a significant increase in price the past 6 months, and analysts estimate an increase in both dividends and growth for the company in the coming years.
Technical analysis:
FRO made a bullish divergence on the 195-200 support level recently, after a significant sell off the past few weeks the stock did not even drop as a result of dividends being paid out to stock holders, and I see this as a sign of the stock being about to reverse the downwards trend and begin to move back towards my price target of 260-280.
Strategy:
I am currently in possession of FRO shares with a GAV of 150 NOK/Share as well as increasing my position on friday for 200 NOK/Share. I am looking to hold these shares until price reaches 260-300 NOK/Share depending on coming events. If the price keeps moving down, I will look to hold my position until the stock reaches my price target regardless, as the dividend payout is significant. This might change if significantly bearish news arise, but I do not see that as a high probability at this moment.
If price reaches my profit target, I will again look at analyst estimates and given there is no change I will exit my position for a significant gain. If analyst estimates increase I will either close part of my position or hold it until bearish divergence on the 4H timeframes.

💥🔥 gold triple top Bearish) Pattern) 1D tame frame)⏰⏰Hello traders what do you think about gold?
traders gold now see a triple
Top (Bearish pattern channels
In trading.a triple top pattern is
a bearish chart pattern that indicates a potential trend 📉 reversel from an uptrend to a downtrend lt is characterized by Three conservative peaks (or highs) that are approximately equal; following by a price breakdown below a support levels.
Key levels 2000)
Key levels 1965)
Key levels 1933)

"Did you miss FTM?"⚠️👀
If you missed the Fantom train, I would say that the 0.4447 level could be a good place to get on, with a stop-loss of 0.3615 for the continuation of the journey.
🔴What is your outlook on this currency's growth potential if it is held? Is it expected to exceed our expectations during the upcoming halving?🔆

LINK/USDT 4HInterval ChartI invite you to review the LINK chart in pair with USDT. First, we will use blue lines to mark the upward trend channel in which the price is approaching its lower boundary.
In this situation, we will unfold the trend based fib extension and check the support areas. And here we can see that the price is above the strong support zone from $14.42 to $13.60, but if it goes lower, we can see a break from the channel and return to the support area at $11.31.
Looking the other way, we see that first the price must overcome the important resistance zone from $16.57 to $17.31, which would also result in an exit from the channel and after breaking the resistance at $18.26, a path towards $21.
Please look at the CHOP index, which indicates that we have more and more energy, on the RSI indicator we are moving around the middle of the range, but the STOCH indicator shows a clear recovery, which may result in a greater price drop.

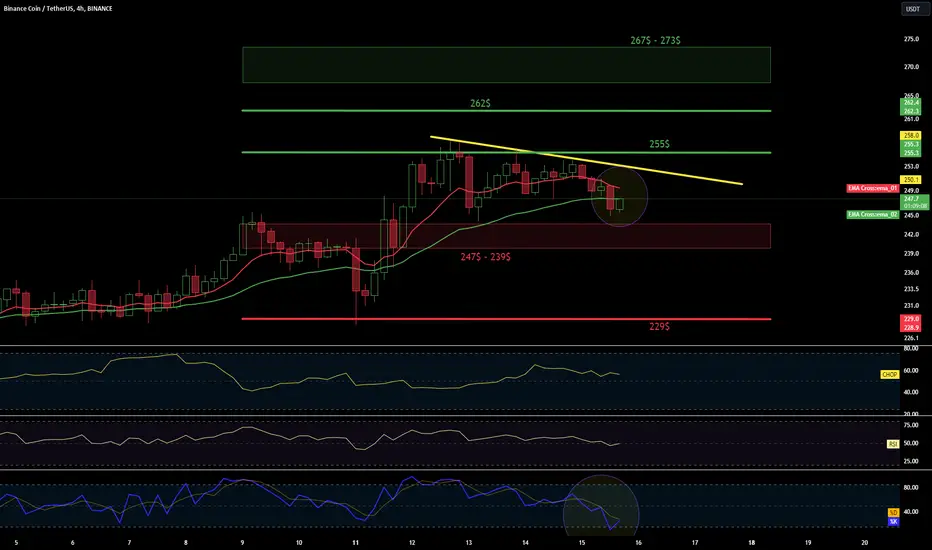
BNB/USDT 4HInterval ChartI invite you to review the chart of BNB in pair with USDT, also on a four-hour time frame. First, we will use the yellow line to determine the local downward trend under which the price is moving.
In order to determine the current supports for the BNB price, we will unfold the trend based fib extension grid, and we can see that the price is approaching a strong support zone from $247 to $239, however, if we break down from this zone, we can see the price return to the support area at $229.
Looking the other way, we can similarly mark places where the price should encounter resistance on the way up. And here, first, there is strong resistance at the price of $255, then there is resistance at the level of $262 at the golden Fib point, and then the price has to face a strong resistance zone from $267 to $273.
Please look at the STOCH indicator, where we have a strong rebound and there is room for us to go a little lower, but moving near the lower border we can observe an attempt at a rebound and small increases.
And when we look at Ema cross 10 and 30, we can see that they do not yet indicate confirmation of a return to the downward trend.
Will BTC overcome the resistance?Hello everyone, I invite you to check the current situation on BTC in the USDT pair, taking into account the four-hour interval. First, we will use the yellow line to determine the local downward trend, to which the price quickly returned.
Now we can move on to marking support areas in the event of a correction. And here, first of all, it is worth marking the support at the price level of $41,795, then we have visible support at the price of $40,711, and then we will define a strong support zone from $39,957 to $38,938.
Looking the other way, we can determine resistance locations in a similar way using the trend based fib extension tool. First, we will mark a strong resistance zone from $43,199 to $44,472, when it is overcome and positively tested, the path towards the resistance at $46,500 will open.
At this point, it is worth looking at EMA Cross 10 and 30, which indicate that the price tried to return to the upward trend, but everything indicates that this attempt was unsuccessful. And again the red line is approaching the intersection of the green ema cross 30 line.
Please pay attention to the CHOP index, which indicates that the sideways price movement has regained energy, the RSI indicator shows room for further declines, while the STOCH indicator, in line with recent predictions, has recovered and there is still room to pull the price lower.

BTC 4H Chart Hello everyone, let's take a look at the BTC to USDT chart on a four-hour time frame. As you can see, the price has returned and remains on the local downtrend line.
When we unfold the Trend-Based Fib Extension grid, we can determine the support zone from $41,250 to $40,716, then support at $39,954, and further support at $38,988.
Looking the other way, there is a strong resistance zone from $43,182 to $43,737, followed by strong resistance around $44,441.
On the RSI indicator, we remain in the middle of the range, but on the STOCH indicator, we are moving at the upper limit, which may result in a price recovery.

#AUDCAD potential bullish continuationAs you can see in the 4-hour timeframe chart, there are several different bullish confluences that we are currently observing.
Firstly, the price is retesting a bullish trendline that has supported this recent bullish move since October 16th. Secondly, the price is also finding support from the 200EMA , and the price formed a nice rejection off this overlay indicator. Thirdly, we have bullish divergence between price and the stochastic oscillator, suggesting that momentum has shifted to the upside. Also, from a market structural point, the price is forming higher highs and higher lows and is currently testing the previous resistance, which has now turned into support.
After observing all these bullish confluences, the price then formed a bullish engulfing candle, suggesting that bulls are active in the market.
To participate in this market, there are two things that we can do. Either we can engage in this market by executing a buy order at the current price or place a buy limit order at 50% of the bullish engulfing candle, of which I prefer to use the second method.

LTC/USDT 4hInterval ChartI invite you to review the LTC chart on a four-hour interval. As we can see, the price, with a dynamic movement, broke the local upward trend line at the bottom.
When we unfold the trend based fib extension grid, we can see that the price has retreated to a strong support zone from $70 to $67, however, if this zone is broken, we may see further declines towards the support level of $60.
Looking the other way, we can similarly determine the resistance areas that the price must face. And here we see that the first resistance should appear at $75.65, and then we will move towards the resistance zone from $79 to $81, and then to the resistance at $84.58.
The CHOP index indicates that there is energy to make a larger move, the RSI indicator shows consolidation and a small rebound, while the STOCH index, despite a strong move, did not give a large price increase, which may limit larger increases.

BTC Check 1HInterval ChartHello everyone, I invite you to check the current situation on BTC in the USDT pair, taking into account the one-hour interval. First, we will use white lines to mark the local channel of the upward trend from which the BTC price broke down, while it is worth defining the local downward trend with the yellow line.
Now we can move on to marking support areas in case the correction deepens. For this purpose, we will unfold the Trend based fib extension grid, and we can see support at the level of $40,510, while it is worth defining the support zone from $38,697 to $37,732.
Looking the other way, we can determine resistance areas in a similar way. First, we will mark the resistance zone at which the price stopped from $42,018 to $42,423, when it is overcome, we again have active resistance at the level of $43,591, and then there is resistance above the upper border of the previously mentioned channel at the level of $45,488.
At this point, it is worth looking at the moving averages 50 and 200, which show the place where the yellow ema cross 50 line crossed the blue ema cross 200 line, confirming the return to the downward trend.
Please pay attention to the CHOP index, which indicates that most of the energy has been used in the upward movement, on the RSI indicator we have returned to the upper limit, with room for growth, while the STOCH indicator is moving at the upper limit, which may limit the growth and provide a rebound in the coming time .
