#SPX is testing a key price level after 2 years#SPX is retesting the key price level , break of which started the #bear market. A fail here could lead to test of meaningful support levels below.
Supportandresitance

AUDUSD FORECASTmarket may pull back from here due to a resistance and may price reach to the target 0.68921.
as we can see we can open a buy trade from when market reach to resistance as u can see in the chart

GBPJPYNOTE: Selling opportunities are much more riskier.
We're keeping the pair under watch to buy around 179.800 and the much more riskier setup is watching to sell around 183.500
We take less risk for shorting scenario.

USDCHF FORECASTThe price may increase from here as we can see the market trying pull back from lower support and from few days there is bearish market here we can expect that market may change the movement and try for a bullish market. right now we can expect that market may reach till 1st resistance and if price breaks the resistance then we can expect that price may reach to 2nd resistance.

GBPNZD FORECASTAs we can see the price is nearest to resistance and and market is rejeting from here and price is trying to move downward from here. we can expect market will move in downward direction

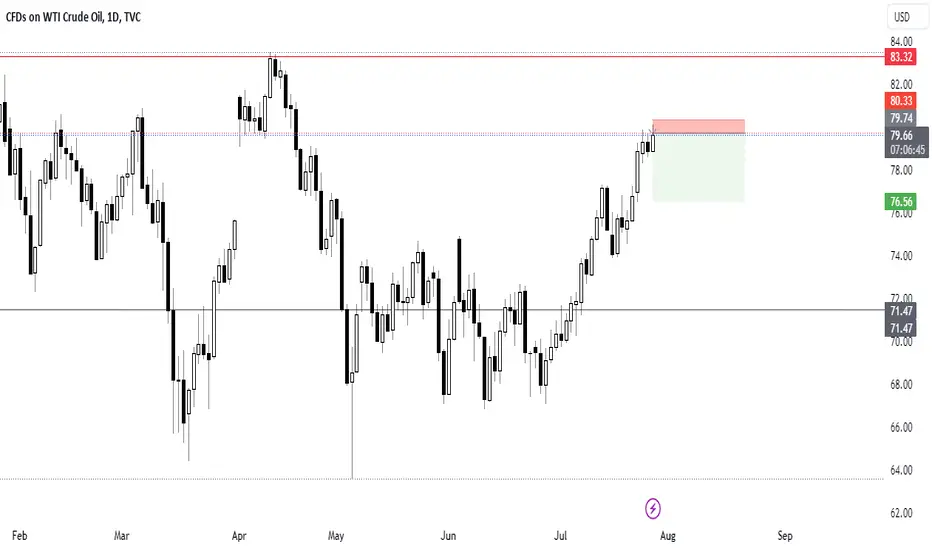
USOIL TRADE IDEAAfter a strong bull run, I waited for a correction before continuing higher.
Let me know what you think In the comments!
My trading strategy is not intended to be a signal. It's a process of learning about market structure and sharpening my trading skills.
GBPUSD Buy SetupOANDA:GBPUSD
Hello traders,
This is my Gbpusd trade idea. Just as i predicted last week that GU will likely buy this week in lower time frames, now it seems GU is ready to start this week bullish run, hence this setup.
Reasons Behind The Setup:
Daily structure is bullish
Price retrace to discount price levels on daily
Retest old high on daily.
Price retest 4Hour discount price Order block.
Price created a shift in market structure on 1hour time frame.
What do you see on your chart?
Kindly share your thoughts in the comment section, will be reading them.
If you love my idea, give me a like and follow me for more future updates like this.

AUDCHF FORECASTSELL SCENARIO
Market is moving in a downward direction along with the trend line and price already breaked the support and that support become a resistance and here are chances that market may move in a downward direction following the trendline. if the price moves downward and break the lower support then we can expect a free fall.

GBPCHF FORECASTRight now the price may increase from current price due to a support and market trying for a pullback following the support from previous days.There is a good opportunity to go with the long position given in chart till nearest to resistance .

Xiaomi Corporation 1810 buy opportunityDue to repeating head and shoulder pattern and finishing correction, I expect it to go up.
Buy at market with stop loss 10 dollars and target for exiting as resistance level.

EPL- Darvas Box Pattern - 24% ROIAll details are given on chart. If you like the analyses please do share it with your friends, like and follow me for more such interesting charts.
Disc - Am not a SEBI registered. Please do your own analyses before taking position. This post is only for educational purposes and not a trading recommendation

MKR 1D Review Long-TermI invite you to review the chart of MKR in pair to USDT. Here the price stays above the uptrend line
After unfolding the trend based fib extension grid, we see that we first have a support zone from $ 1067 to $ 1008, then we can mark the second support zone from $ 950 to $ 867, but when the zone does not hold the price, we can see a drop to the area of strong support at $ 763.
Looking the other way, we can similarly determine the places of resistance that the price has to face. And here we see that the price has rebounded from the beginning of the $1265 to $1349 resistance zone, then it needs to break through the second very strong zone from $1442 to $1569 and then it can move towards the resistance at $1729.
When we turn on the EMA Cross 10 and 30, we see that the MKR is moving in a local uptrend.
The CHOP index indicates that the energy has been used, the RSI is moving in the upper part of the range, which may result in a larger price correction, and the STOCH indicator shows that there is a lot of energy, which, combined with the RSI, may result in a price correction.

ETH/USDT 1DInterval Hello everyone, I invite you to review the chart of ETH in pair to USDT, also on a one-day interval. First, we will use the yellow line to mark the uptrend line above which the ETH price is staying.
Now let's move on to marking the places of support. We will use the trend based fib extension tool to mark the supports, and as you can see, we can first mark the support zone from $1784 to $1670, then we have support at $1559, and then another very strong support at $1399.
Looking the other way, we can also mark the places where the price should encounter resistance on the way to increases. And here we will similarly mark the resistance zone from $ 2034 to $ 2160, the price of which has no strength to break through, but when it does, it must overcome a very strong resistance at the price of $ 2291.
The CHOP index indicates that there is still energy to continue the movement. On the RSI we see a rebound and a place for the price to go lower, while on the STOCH indicator we see that the energy has been consumed, although we can still see the price fall.

BTC/USDT 1DInterval ReviewHello everyone, I invite you to check the current situation on BTC in pair to USDT, taking into account the one-day interval. First, we will use the yellow line to mark the downtrend line over which BTC is moving.
Now we can move on to marking the places of support in the event of a correction. And here, in the first place, it is worth marking the support zone from $ 29,484 to $ 28,738, but when we fall below this zone, we can see a drop to around $ 28,993 and even $ 26,941.
Looking the other way, in a similar way, using the trend based fib extension tool, we can determine the places of resistance. First, we will mark the resistance zone from $31,641 to $32,479. Once we manage to break through this zone we will move towards resistance at $33331 and then $34503.
It is worth turning on the EMA Cross 200, as we can see, the BTC price is still in a long-term uptrend.
Please pay attention to the CHOP index which indicates that there is still some energy left for the continuation of the downward movement, on the RSI we have a visible rebound, but with room for the price to go down, while the STOCH index indicates that most of the energy has been used

BITCOIN Short Supply And Demand Break-Out BTCUSDSee the Picture for analysis:
Higher timeframe:
-Trend = uptrend
-Price inside the weekly supply
-Price reacting off of resistance
-Shorts valid with confirmation on a lower timeframe
Lower timeframe:
-Originally there was a nice confirmation a couple of weeks ago but
not price has taken the first step up of being in control by breaking
the lows/range and showing HTF supply/resistance to holding.
-Valdi area for shorts on 1TF setup (right chart)

TOMMY XAU | BASIC MARKET STRUCTURE Good afternoon gold gang!
Thought id jump on here to talk to you about basic market structure, as its the basis for any strategy and super important to learn.
We can identify that the market moves 3 ways ..
up trend
down trend
sideways (consolidation)
I prefer to trade when the market is trending in either direction. I determine this by looking at the monthly and weekly candles.
In a trending market, i am looking to identify areas that the market can reverse from. If we are making a higher high for example .. I can identify that price is likely to pull back down to the key level it started its ascent from. From there i can wait for confirmations on the lower time frame to take a trade in the direction of the trend.
obviously this doesnt work everytime .. news etc .. but its always good to have it in the back of your mind the phase of the market you are currently in.
you will find with my strategy .. that price will make new structure points around my key levels ( the ones i place on my chart)
Hope this helps some of you out .. back to basics is sometimes the way to go if you are getting overwhelmed with information
Have a great sunday and see you tonight for the outlook
tommy

ES/MES week planAfter ES/MES broke out in June from it's resistance at 4327.50 that area became a high demand target. It rallied up to 4493.50, almost reaching 4500, but not before flushing back down and retesting 4369.50. Creating a new resistance that needed to clear for a move higher.
This week I'm looking for similar action to happen, but with FOMC on Wednesday anything is possible. With the break out from 4493.50 we rallied up to 4609.50 were we are now either going to base, or repeat a similar pattern and flush down to 4523.50 and reatest this zone before moving higher. If this level gets taken out then 4493.50 is the line in the sand before we go lower. This was the break out level that started the recent big move up.
Majore levels looking for upside are 4580.75, 4594.75, and 4609.50. levels for downside looking at 4560.50, 4551.50 and then 4523.50

EURJPY Bouncing Of ResistanceEURJPY is bouncing of resistance, I am into short positions looking for a nice profit!
Trade safely!
Let me know what you think!

$TSLA Down on Over-SpeculationNASDAQ:TSLA reported earnings after market close yesterday. Pro traders took profits before the close as the run became technically overextended. It gapped down today, but not on the extreme volume we'd expect from the usual HFT activity around earnings.
Profit and Operating margins are decreasing quarter over quarter, but revenues and net income are increasing.
This is not so much an onslaught of sellers but profit-taking along with a lack of buyers at this price range. As occurs often for this high-profile yet important EV company, the stock is over-speculated and needs to pattern out the excess. It could test the next support levels, but ultimately it's likely to head sideways as it challenges the resistance from Aug-Oct of last year...barring any surprises from Musk ;)
Dark Pool Buy Zones are in the bottom formation. The question is: will those buy zones be moved up or not?

Dow and jones at resistance levelDow and jones hit resistance level today and is looking to close under the zone today! I will be looking for short if it doesn't break this level!
Le me know what you think!

XAUUSD at resistance level!Gold at resistance level. Looking for clear break or a move to the down side!
Let me know what you think!

Market Direction - Trend StrengthThe strength of a trend can be a key factor in predicting future price movements. This post will specifically cover how to identify trends, how to determine trend strength, and how to use it to your advantage when trading the markets.
Characteristics of a Trending Market
To begin, let us understand how to identify a trending market.
A trending market is a market that is either making higher highs followed by higher lows (UPTREND) or lower lows followed by lower highs (DOWNTREND).
What does this typically look like? Let's see:
Uptrend
Downtrend
Now that we understand how to identify uptrends and downtrends, let's delve further and discuss how to use trend strength to your advantage when trading the markets.
Fibonacci Retracement Tool
The Fibonacci retracement tool is used in trending markets to determine how strong the trend is. It uses natural numbers to determine the high-probability price levels that the market will hit and continue in its initial direction. This method will use four Fibonacci levels: 38.2%, 50%, 61.8%, and 78.6%.
One thing to mention is that in a trending market, the chart is made up of two waves: impulsive and retracement. After an impulsive wave, a retracement wave will usually form; after a retracement wave, the impulsive wave will usually form.
The impulsive wave represents the strong momentum of buyers and sellers. The retracement wave shows the weakness of buyers and sellers.
Therefore, we must look at the retracement wave when it comes to deciding the strength of a trend. For example, in an uptrend, the impulsive wave will be bullish; therefore, the retracement wave will be bearish. In a downtrend, the impulsive wave will be bearish; therefore, the retracement wave will be bullish.
The retracement wave shows the strength of the opposite side of the market. For example, if the impulsive wave is bullish, buyers are stronger. Then, in the retracement wave, sellers will try to dominate the buyers.
Therefore, the deeper the retracement goes, the stronger sellers will be than buyers, and the weaker the bullish trend strength will be.
With the Fibonacci retracement tool, there are three scenarios to determine trend strength:
Strong Trend Strength: 38.2% Fibonacci Retracement
Moderate Trend Strength: 50%–61.8% Fibonacci Retracement
Weak Trend Strength: 78.6% Fibonacci Retracement
The above examples show why the Fibonacci retracement tool can be extremely effective in determining not only how strong a trend is, but also how likely it is to continue past the beginning of the impulsive wave.
Bollinger Bands
Bollinger Bands are very effective in reading trend strength. Bollinger Bands are based on price volatility, which means that they expand when the market is trending and there are big prices, and they contract during sideways consolidations when the market ranges.
Bollinger Bands consist of two outer bands (top and bottom bands) on each side and a moving average in the centre between the outer bands (middle band).
One of the main reasons Bollinger Bands are so effective in reading trend strength is that they do not lag as much as other indicators because they always change automatically with the price.
Three important points to note when using Bollinger Bands to read trend strength:
If price pulls away from the outer band and heads towards the middle band as the trend continues, this is a key indication that the trend strength may be weakening.
During strong trends, prices stay close to the outer band and significantly away from the middle band.
Repeated pushes into the outer bands that do not actually reach the band indicate a lack of trend strength.
Let's see a chart example of Bollinger Bands reading trend strength:
As you can see, using Bollinger Bands can provide traders with very useful information about trend strength and the balance between bulls and bears.
Price Rejection
We do not always need indicators or tools to read trend strength; it is possible to do this just by looking at a naked chart. The way rejected continuations or reversals happen on charts can be a huge indicator of being able to read trend strength. Before understanding the price rejection, it is important to know about the wick or shadow of the candlestick.
Upper wick
The upper shadow shows that the price went up and then came down again. This indicates that buyers wanted to increase the price, but sellers dominated the buyers to push the price back down.
Lower wick
The lower shadow represents that the price went down and then came back up. This indicates that sellers wanted to lower the price, but buyers dominated the sellers to push the price back up.
Identifying price rejection
Traders should first wait for the price to reach a strong support or resistance level. Then, at the support or resistance level, candlesticks will likely make wicks opposite the trend due to the strength of the level. For example, wicks or shadows will form on the upper side at the resistance zone, while at the support zone, wicks or shadows will form on the lower side of the candlesticks.
These wicks or shadows are identified as price rejections in the market.
Price rejections are very important, especially in identifying trend strength, because they accept or reject the identification of key levels in the market. For example, if you are unsure whether a support zone will hold or break, you can see whether price rejection will occur at that level.
Let's see a chart example of price rejection and how you can use it to identify trend strength:
The chart above is proof alone that trend strength can be identified by just looking at the price action of a chart.
Understanding the strength of a trend does not have to be complex. Trend strength can be identified simply by using the three different techniques we have covered in this educational post.
The best thing we can all do as traders is to be simplistic and not overcomplicate things; this becomes especially easier when you accept that nothing in the market is certain.
Each market has its own unique market conditions and will not trade rationally all of the time. Therefore, when a trade does not go your way even though your trend strength signals were high and you followed the market, understand that it is just one trade and that the market is completely neutral. It is neither personally on your side nor personally against you.
Trade safely and responsibly.
BluetonaFX

ETC/UST 1D ReviewHello everyone, I invite you to review the ETC chart on the one-day interval. As we can see, the price did not manage to stay on the downtrend line and was quickly reversed.
After unfolding the Fib Retracement grid, we see that the price is holding just below the support at $19.19, the next support is at $16.69, then the third support at $14.84, and when we go lower we have a fourth very strong support at priced at $12.57.
Looking the other way, we can similarly determine the places of resistance that the price has to face. And here we see that the first significant resistance is at $21.67 with the downtrend line, then resistance at $24.15 and then the price will move to resistance at $27.26.
At this point, it is worth including the EMA Cross 200, which indicates that the ETC attempted to return to a strong uptrend, but it was a false break and a quick return.
The CHOP index indicates that there is a lot of energy for the upcoming move, the MACD indicates the continuation of the downward trend, while the RSI has approached the middle of the range, so the move will be based on BTC price jumps.
