EURJPY ANALYSISAfter seeing a bearish push last week on this pair, we could expect price to continue that momentum and seeing the 4hr structure making LL and LH as confirmation.
Supportandresitance

GBPUSD shortin this video we see that the previous week was a really bearish week for the pair and we could expect that momentum to continue for the earliest part of the week and also the 4hr structure points showing us more confluences

this week clearly more bearish than bullish but again cautious!PEPPERSTONE:HK50
HSI:HSI
Hello bello.....May everyone trade in the state of peaceful and calming mind.
Hong Kong Stocks Post Five-Day Rout
Hong Kong stocks ended lower on last Friday, extending the losing streak to a fifth session, as sentiment remained downbeat due to concerns over US-Sino trade tensions.
The Hang Seng Index retreated 0.92%, or 176.60 points, to end the week at 19,064.29.
Is the news helping? News is distraction. 😂
What's the magic numbers to look at for HSI for the near short-long term?
Well, we are now in the pullback correction area, worth to notice and recall that in fact in 2024 the index has actually bringing the full-year with almost 18% (17.67%) gain; closed at 20059.
Support: 18569, 18215 (from W Chart you can see this is the support level from May,Sept 2024). If this breakthrough then we will see the index at 17570 level.
Resistance: 18,930, 19,700 (well there are analyst forecasting that HSI has an upside of 15% targeting to 20,3000 by end of 2025)
b]4H chart - Bearish
Both MACD & KDJ are indicating Bearish mode.
MACD - remained at bearish zone, line still arcing. [ s]But crossing up. Good sign.
KDJ - remained in bullish green zone, indicating uptrend signal. Turned bearish.
Cross-checked with broader tf chart - D chart.
Bearish - at Oversold zone,below 80
Both KDJ and MACD below zero level. Bearish.
1H chart the Index seems has no mood and strength to move and need quite a long rest...
For day trade: Same strategy, sell at resistance; buy/TP at support.
Monitor the 1H,4H movement with confirmation using MACD & KDJ indicator.
Set your tf, have your entry and exit plan!
Support : 18215 (if breaks then next 19070)
Resistance :18650 (if breaks then 19450, then 19650)
MACD - closing to touch zero line trying to breakthrough but with the red histogram it looks likely dipping down.
KDJ - in bearish zone. It may be divergence signal that on the oversold area and could see a rebound.
Sticktoyourplan follow your trading strategy.
Trading to make pocket money isn't that challenging and it can be boring and you can make it fun and zen with it.
Let's follow our own strategy and zen with 📙 and 🍵 to let the results realized. It can be a winning trade or losing trade, it doesn't matter. We are aiming for long horizon; as we are not gambling or speculating.
Rememeber to allocate some of your gained pocket money for long term asset investment.
We should take contrarian strategy. Accumulate Hong Kong and China stock and wait for 12-24months or more to have an exponential capital gain.
Time frame is important! Prepared for the rollercoaster short-term rider for these two markets.
Got your trade plan ready for 2025, or are you still figuring out your moves?
Think of it like prepping for a wild night out—plan your entry, know your exits, and avoid getting caught in the wrong crowd (aka bad trades).
Happy Trading Everyone!

GBPCHF - Potential Rejection at ResistanceThe GBPCHF pair is trading near a key resistance zone around the 1.13646 level, which has acted as a significant area of interest in the past. This region has previously led to reversals, suggesting that sellers may regain control at this point. The price action indicates a potential for bearish momentum, especially if rejection patterns form at this level.
A rejection from the resistance zone could be confirmed by bearish candlestick patterns such as engulfing candles, long upper wicks, or other signs of selling pressure. If the rejection occurs, a potential move toward the 1.12850 target level is anticipated. This aligns with the broader expectation of a bearish correction within the current market structure.
If you have a different perspective or additional data, feel free to share!

NZDUSD - Potential Long from Key Support ZoneThe NZDUSD pair is currently approaching a significant demand zone near the 0.55800 - 0.54700 level. Historically, this area has acted as a strong support, leading to notable bullish reversals. The recent decline into this zone suggests a potential for buyers to regain control and push prices higher.
A bullish confirmation, such as a strong rejection pattern, bullish engulfing candles, or long lower wicks, would indicate an increased likelihood of a move upward. If this scenario unfolds, the price may head toward the 0.57580 level.
This setup aligns with a potential short-term rebound within the broader bearish market structure.
What are your thoughts on this outlook?

Euro can rise a little and then continue to fall to support lineHello traders, I want share with you my opinion about Euro. Observing the chart, we can see how the price some days started to trades inside the range, where it reached the top part at once and then dropped to the bottom part, breaking the resistance level, which coincided with the seller zone. Also then, EUR declined to the current resistance level, and even a little below, after which made a strong impulse up, backing up to the range, where it later broke the 1.0520 resistance level one more time. Then price some time traded inside the range and later reached the resistance line, after which started to decline. In a short time, the Euro declined to the current resistance level, thereby breaking the 1.0520 level and exiting from the range and then some time trading near the 1.0350 level. After this, the price broke this level and fell to the support line, but at once rebounded and rose to the resistance line, breaking the 1.0350 level again. A not long time ago, EUR broke the 1.0350 level one more time and continued to decline. For this case, I think that the Euro can rise to almost resistance level and then continue to fall to 1.0190 points, which coincides with the support line. Please share this idea with your friends and click Boost 🚀

LLY Earnings Preview: Breakout or Rejection? Key Levels to WatchNYSE:LLY moved from 761-799 this week, catching key support at that 761 level. NYSE:LLY closed as an outside week, bullish on the 15MIN-Week timeframe. This has the potential to be a really nice earnings run-up, if the 800 level can hold. As always do your own research, these are just ideas, not meant for investment advice.

MNQ!/NQ1! (EARLY) Day Trade Plan for 01/10/25MNQ!/NQ1! (EARLY) Day Trade Plan for 01/10/25
📈 21560
📉 20930
1/2 way mark 📈 21406 & 📉 21090
Like and share for more daily NQ levels 🤓
*These levels are derived from comprehensive backtesting and research, demonstrating over 90% accuracy. This statistical foundation suggests that price movements are likely to exceed initial estimates.*

still figuring out the moves? PEPPERSTONE:HK50
HSI:HSI
Happy Friday everyone!
www.tradingview.com
The Hang Seng fell 39 points or 0.2% to end at 19,241 on Thursday after trading modestly higher in the morning, with eventual losses in financials and property.
Is the news helping? News is distraction. 😂
4H chart
Both MACD & KDJ are on the divergence.
MACD - remained at bearish zone, line still arcing. But crossing up. Good sign.
KDJ - remained in bullish green zone, indicating uptrend signal.
Cross-checked with broader tf chart - D chart. It's still at oversold zone ,below 80 for KDJ and MACD below zero level.
1H chart the Index is dancing within very narrow range for today.
Support : 19130 (if breaks then next 19070)
Resistance :19375 (if breaks then 19450, then 19650)
MACD - closing to touch zero line trying to breakthrough but with the red histogram it looks likely dipping down.
KDJ - in bearish zone. It may be divergence signal that on the oversold area and could see a rebound.
For day trade: Same strategy, sell at resistance (19371); buy/TP at support (19070 strong support level; then 18910). Monitor the 1H,4H movement with confirmation using MACD & KDJ indicator.
Set your tf, have your entry and exit plan!
Sticktoyourplan follow your trading strategy.
Trading to make pocket money isn't that challenging and it can be boring but you can make it fun and zen with it.
Let's follow our own strategy and zen with 📙 and 🍵 to let the results realized. It can be a winning trade or losing trade, it doesn't matter. We are aiming for long horizon; as we are not gambling or speculating.
Rememeber to allocate some of your gained pocket money for long term assets investment.
Is end of the full trading week for 2025.
Got your trade plan ready for 2025, or are you still figuring out your moves?
Think of it like prepping for a wild night out—plan your entry, know your exits, and avoid getting caught in the wrong crowd (aka bad trades).
Share your ideas and goals with fellow market party animals, hype each other up, and sharpen your skills with regular practice. Let’s make this trading year a VIP experience!
Happy Trading Everyone!

waltzing within the boxPEPPERSTONE:HK50
timing markets is virtually impossible
we don't have crystal ball🔮 and hence we don't predict or speculate.
let's dance with the index
From yesterday post, from the indicators we keep an eye to monitor as it may rebound...
so is this the rebound ?(yes maybe short-term).
A full reversal? again, we don't know! But, don't think so, always cross-check with broader tf - D Chart. It's still at bearish zone; oversold zone (continue to monitor....)
From the 4H chart
Both MACD & KDJ turned around giving reversal signs.
MACD - although still below zero level but we can see the lines are curving up.
KDJ - turned into bullish green zone, indicating uptrend signal.
The 1H chart - the Index moving within the box. You may use BB indicator to get the range too.The previous range red box 19000 - 19200.
Support : 19200 if breaks then next 18960)
Resistance :19440 (if breaks then 19647, then 19945).
For day trade: Same strategy, sell at resistance; buy/TP into support.
Monitor the 1H,4H movement with confirmation using MACD & KDJ indicator.
For swing trade : Set your tf, entry and exit plan.
For slightly mid-long term trade (more than 9months - 36months++) : You may plan and DCA the Index. You may take a long position on HSI Tracker Fund 2800. HKEX:2800
The index is currently in a discount zone, check the historical price; there are ample of room to reach its ATH @33500. The law of attraction; we know that whatever bottom eventually rebound, it's the matter of time.
DYODD. Plan your trade, do not listen to anyone including this post!
Profitable traders/investors take contrarian moves. It's challenging but worth spending some time to think:- Ultimately what we want to achieve from our action/trading...
Sticktoyourplan follow your trading strategy. Set your SL/TP.
Once set, you may zen with 📙 and 🍵 wait for the results.
Happy Trading Everyone!
dancing cha-cha within the range ; be cautiousPEPPERSTONE:HK50
HSI:HSI
Helloy bello everyone!
Seems like the party ain't ending soon, is dancing cha-cha for the past few 1H candles
From the 4H, it seems inching down.
as the MACD & KDJ both indicating bearish mode.
Cross-checked with broader tf chart - D chart. And it's at oversold zone; keep an eye as it may rebound.
The 1H chart - the Index grasping at the level between 19200-19500
Support : 19200 (yesterday texted 19224; if breaks then next 18960)
Resistance :19500 (if breaks then 19650).
For day trade: same strategy, sell at resistance (19370-19400); buy/TP at support (19250-19270).
Monitor the 1H,4H movement with confirmation using MACD & KDJ indicator.
For swing trade : Set your tf, have your entry and exit plan.
For slightly mid-long term trade (more than 9months - 36months++) : You may plan and DCA the Index. You may take a long position on HSI Tracker Fund 2800 HKEX:2800
The Index is currently in a discount zone as it's traded 30% above its historical all-time-lo (ATL);
Ignore the news and plan for your long term capital gain game plan, be patience and zen.
The law of attraction; we know that whatever bottom eventually rebounds, it's a matter of time.
DYODD. Plan your trade, do not listen to anyone. You can't make the money beyond your realm of capabilities.
Sticktoyourplan follow your trading strategy. Set your SL/TP.
Once all is set, let's zen with 📙 and 🍵 wait for the results.
Happy Trading Everyone!

Choppy Market: Patience and Key Levels to WatchThis chart highlights a low-probability trading environment with corrective structures and low volatility. Key focus areas:
Upside Breakout: Watch for impulsive moves above the 30M trendline and 4H LQZ for short-term bullish setups.
Downside Correction: A steeper drop into the 15M or 1H LQZ may provide higher-probability long opportunities.
Stay Patient: Avoid trading inside the choppy range; wait for clear reactions at liquidity zones or strong breakouts with momentum.

Do you see it as a opportunity to scoop the dip?
PEPPERSTONE:HK50
Hello everyone, good day!
PEPPERSTONE:HK50 HKEX:2800
The 1H chart - the index had lost its strength and has plunged ~300pts from its morning open @19587.
Hi : 19868 (higher than 19876 @20250105 1H Hi)
Support : 19300 ( ati point of writing broke the level; next 19130, 18965) .
Monitor if is able to stay at this level.
Resistance :19600 (if breaks then 19700). Unlikely.
www.scmp.com
Do you see it as a opportunity?
For day trade: Same strategy, sell at resistance (19353); buy/TP into support. Monitor the 1H,4H movement with confirmation using MACD & KDJ indicator. Here taking Bearish position.
For swing trade : Set your tf, entry and exit plan.
For slightly mid-long term trade (more than 9months - 36months++) : you may plan and DCA the Index. You may take a long position on HSI Tracker Fund 2800. HKEX:2800
The HSI is currently in a discount zone as it's traded 30% above its historical all-time-lo (ATL); there is ample of room to reach its ATH @33500. The law of attraction; we know that whatever bottom eventually rebounds, it's a matter of time. DYODD. Plan your trade, do not listen to anyone including this post!
Sticktoyourplan follow your trading strategy. Set your SL/TP.
Once all is set, let's zen with 📙 and 🍵 wait for the results.
Happy Trading Everyone!

NIFTY : Bearish Trend, but a Bounce Might Be Coming
NSE:NIFTY has been trending lower, with sellers clearly in control. However, it looks like the market is taking a breather, and there’s a chance for a short-term bounce before the downtrend continues.
What’s Happening?
1. Resistance Zones:
- 23,770: This is the first hurdle for the price to cross. Sellers have been strong here.
- 23,833 and 23,935: If 23,770 breaks, these are the next levels where selling pressure might kick in.
2. Support Levels:
- 23,439: The first key level where buyers could step in.
- 23,303: A stronger support zone if the decline deepens.
3. Trendline Resistance:
There’s a clear downward trendline acting as a ceiling, making it hard for the price to move higher.
4. Current Setup:
The price is hovering around 23,629 after a sharp drop. It feels like the market is pausing to decide its next move. A bounce toward 23,770 looks possible, but the bigger picture still leans bearish.
How to Trade This:
- If you’re bullish:
Watch for a breakout above 23,770 with good buying momentum. If it happens, there’s room for the price to climb to 23,833 or even 23,935.
- If you’re bearish:
Look for the price to struggle near 23,770 or start falling again. That could be your signal to go short, with targets at 23,439 and 23,303.
Bottom Line:
The market still looks weak, but there’s a chance for a small bounce before sellers take control again. Keep an eye on how the price behaves around 23,770—it’ll tell us whether buyers are gaining strength or if the downtrend is here to stay.
What do you think? Are you leaning bullish or bearish? Share your thoughts in the comments!
Only for educational purposes.
This content is not a recommendation to buy and sell.
Not SEBI REGISTRAR.

Still in the awkward zone...PEPPERSTONE:HK50
Hello everyone! May everyone have a great week ahead, the weekend had past regardless you had a good one or challenging one, that had passed!
We live in now and then.
Let's see how the index doing this morning for the new start of the week and so we can plan and take action accordingly.
Are they waiting for the 2025-2026 budget speech in Feb; after CNY?
News are distraction. If you are using chart pattern, technical analysis to forecast the price movement; stick to it! Although sometimes news can be catalyst to price movement, as long we stick to our plan and continue to practice and adhere to our own SOP, our trades will not go too far off.
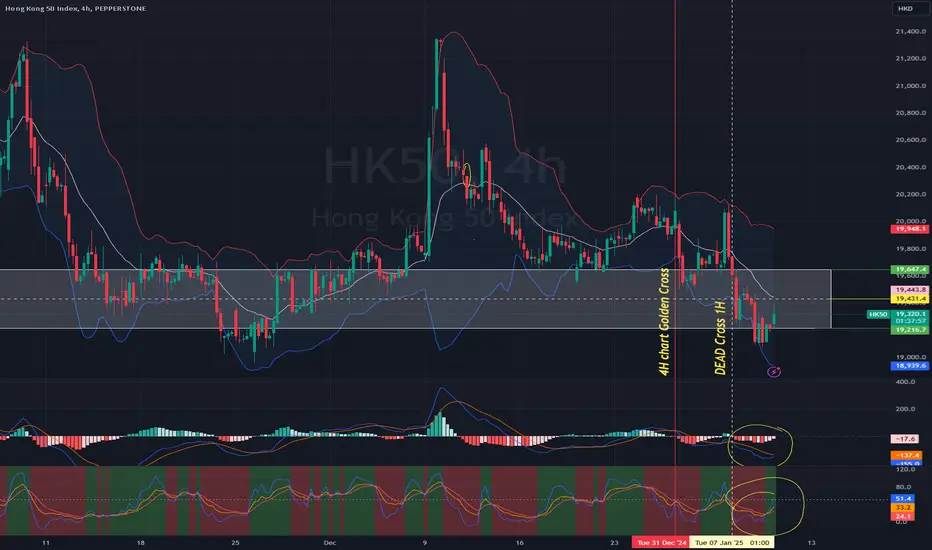
From D chart
What we can see is the MACD,Signal is getting weak , histogram is weak the signal line is breakthrough the zero line. We should monitor close by end of today if it crosses down the zero line.
Let's not go against the trend, trend is always our friend! ☺ However, for the index it seems currently is no trend...awkward. haha
The 4h Chart - the pricing had turned bearish since 31/12/24 as marked (Dead Cross).
Support : 19311
Resistance :20220
The 1H chart - the index dancing within the range bound as we noticed from chart.
Hi : 19868 (higher than 19876 @20250105 1H Hi)
Support : 19630 (if breaks then next 19311)
Resistance :19850 (if breaks then 19980 ;52EMA)
For day trade: Same strategy, buy into support, sell at resistance and monitor.
For swing trade : depends your time frame (tf); once the 1h hour chart MACD indicator crossing up the zero line and the KDJ turned green. May take bullish position.
Sticktoyourplan follow your trading strategy. Set your SL/TP.
Once all is set, let's zen with 📙 and 🍵 wait for the results.
Happy Trading Everyone!

Nifty50 Trendline Retest – What’s Next for Traders?The Nifty50 is at a decisive point, retesting a key breakout level. Here's my take on the key levels to watch and how traders can approach the market
Nifty50 Analysis - 5th January
What's Happening?
Nifty 50 is at a make-or-break point. It recently broke out of a downward trendline, which is usually a good sign for bulls, but now the index is retesting that breakout. How it reacts at these levels will set the tone for the next move.
Key Levels to Watch:
- Resistance Zones:
- 24,222
- 24,347
- 24,528
- Support Zones:
- 23,990
- 23,897
- 23,790
- 23,592
Possible Scenarios:
1. The Bullish Path:
If Nifty holds above 24,057 and shows strength, we could see a move to 24,222, and if the momentum is strong enough, it might even test 24,347 or 24,528.
2. The Bearish Path:
If the price drops below 23,897, things could get dicey, with the index likely heading toward 23,790 and 23,592.
How to Trade This?
- For the Bulls:
Look for sustained buying above 24,057 to go long. Targets: 24,222, 24,347. Stop loss: Below 23,897.
- For the Bears:
If the price slips below 23,897, you might want to short. Targets: 23,790, 23,592. Stop loss: Above 24,057.
Final Thoughts:
This is one of those moments where patience pays off. Let Nifty show its hand before jumping in. Watch those key levels closely, and always trade with a plan (and a stop loss!).
NSE:NIFTY
Let me know your thoughts on this setup! Do you think bulls will hold, or will bears take over?

AUDUSD BUYFundamentally we should see this push up for next coming days, this can get tense but am confident the top down technical analysis.

NIFTY - Parallel Channel PatternAll details are given on chart. If you like the analyses please do share it with your friends, like and follow me for more such interesting charts.
Disc - Am not a SEBI registered analyst. Please do your own analyses before taking position. Details provided on chart is only for educational purposes and not a trading recommendation

2025 NewYear Party with severe Hangover again!PEPPERSTONE:HK50
Happy New Year everyone!
1h Chart
From the chart we can see the 1h MACD forming Golden Cross on last 31/12/2024 0900; it was pumped to have a nice closure for 2024 and went for a heavy party.
This morning, as we can see the hangover hits quite severely! The index plunged more than 500bps this morning.
The MACD indicator now is forming Deadcross and in its bearish mode. The KDJ is also in its bearish zone.
Today the index could find support at 19453 and resistance at 19753.
D Chart
Well, we wish we had a crystal ball.
From the D chart, the MACD line crosses the Signal line forming a Deadcross. However, the Signal line is yet to cross below zero although the KDJ is already in its bearish zone.
Do not be swayed by the news, stick to your plan and set your TP/SL.
Do not anticipate and speculate how the markets move, we can only react with Buy,Hold or Sell.
Let's monitor the movement and practice your zentrading strategy.
Happy trading everyone!
Wishing you the best coming to you this 2025!
Let's continue 🧘♂️ Zen-ing with 📙 and 🍵.

GUJARAT FLUOROCHEM LTD GIVE A BREAKOUT WITH BIG VOLUME...NSE:FLUOROCHEM trade at 3975 level. Stock give a breakout with big volume at 3800 level.
You can watch for an upside move at 4800-5000 level...

1304: Triangle Breakout and Retest1304 has shown a recent upward movement.
Price was moving within triangle.
A breakdown of triangle was observed but could not sustain. Price took an upside movement after making a double bottom (support zone).
Price is retesting the breakout of triangle.
Entry can be taken with low risk.
Manage your risk and enjoy the ride.

SOL/USDT 1W Chart ReviewHello everyone, let's look at the 1W SOL to USDT chart, looking at the large time frame, we can see how the price is moving in the uptrend channel in which we currently have a visible correction approaching the lower part of the channel.
Seeing the current correction, which most likely held on support at our first stoplos, we will designate the locations of the next potential SLs:
SL1 = 184 USD
SL2 = 166 USD
SL3 = 143 USD
SL4 = 117 USD
However, if the price changes direction and the visible green candle starts gaining strength, it is worth moving on to setting goals for the near future, which include:
T1 = 211 USD
T2 = 234 USD
T3 = 253 USD
T4 = 271 USD

BANKNIFTY - Hourly time frame BOX patternAll details are given on chart. If you like the analyses please do share it with your friends, like and follow me for more such interesting charts.
Disc - Am not a SEBI registered analyst. Please do your own analyses before taking position. Details provided on chart is only for educational purposes and not a trading recommendation
