Supportbecomeresistance
AUDCHF - Support Becomes Resistance!Hello Traders 💖
The AUDCHF Price Breaks the daily Support Level 🔥
the support level becomes new resistance level !
so, i expect a bearish move 📉
i'm waiting for a retest...
TARGET: 0.59820🎯
----------
if you agreed with this IDEA, please leave a LIKE, FOLLOW or COMMENT!
EURCHF - SUPPORT BECOMES RESISTANCE 📉
the EURCHF price breaks the daily support level ,the old support becomes new resistance level ✔
the key level is broken (Break of structure)
so, i predict a bearish move 📉
TARGET: 0.94228 🎯
if you agreed with this IDEA, please leave a LIKE, SUBSCRIBE or COMMENT!
BTC Zoomed In (4hr chart)Let's take a closer look at BTC on the 4-hour chart. So far price is following the projected path of our last update (see linked idea). The question now is when are the bulls going to take control? We've seen a flourish of buying activity today with high volume, but will it be enough to trigger the reversal here? I'm showing the 4-hour chart (instead of the Daily) so I can show you that we still appear to have some overhead resistance that needs to clear (The blue field in the middle indicator). Some of that resistance has turned to support and we've just seen bullish divergence so we *might* see the bulls step up here. However, it still might take a few days for the path to clear. Be patient. I'm only looking to add to longs here.
----------------------------------------------------------------
These are my personal views and not financial advice. Please do your own research before investing.
I'd love to hear your thoughts, ideas and feedback. Feel free to Comment and I'll try and get back to you quickly.
If you appreciated this analysis, consider Liking or Following . Thanks!
M15 Supply Zone, Downtrend Pattern LH LL LH LLYou can see Lower Low Break at H1 and M30. Smooth downtrend pattern LH LL LH LL, then price reversal. So I think current uptrend is for retest. Based on Bullish Engulfing M30 and H1 break, I found matching M15 Bearish Engulfing, in the same possible zone of M30+H1 SBR. Exit target is based on price level that connect lower H H H structure that breaks.
EURJPY. Heading towards next Supply Zone.After breaking out of the trendline, expecting the market to collect orders in the next Supply Zone before continuing bearish pattern.
Chart has formed an ascending triangle, and there’s two possible breakouts of the triangle as shown above.
Green Box : Supply Zone
Orange Box : Demand Zone
White box : SBR Zone
AUDCAD Past Support To Become Future Resistance Short SetupHi All...
AUDCAD on the Monthly/Weekly broke down from a key level support making a lower low lower then the previous low,
Now the market has retraced to the past support level that has a high chance to become future resistance,
A good way to see if it will hold as resistance is to wait for the 4 hour chart to break the counter trend line and take out the most recent low that should give us a powerful indication that the market is most likely heading back down
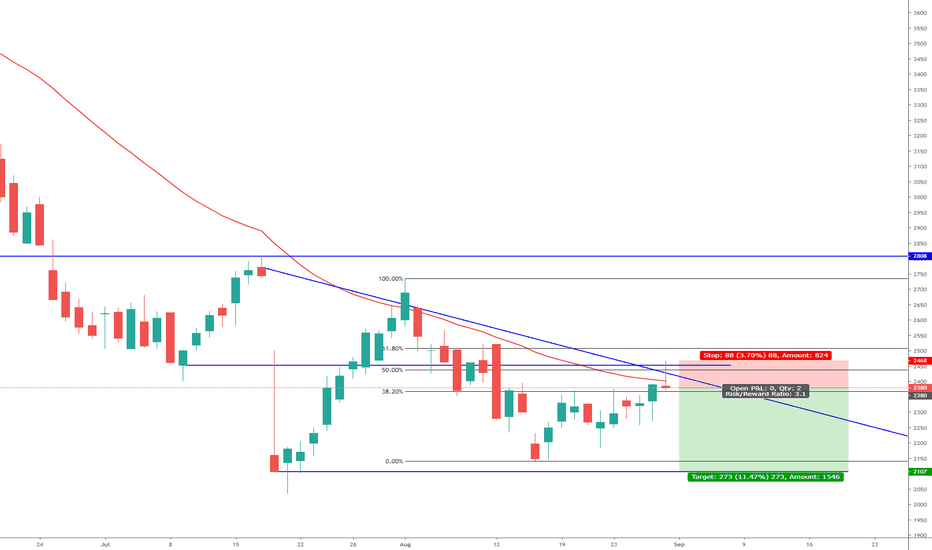
ASC Asos Short Opportunity Price action analysis identified LSE:ASC (ASOS) downtrend continuation and short opportunity. Reversal pin bar candle trigger, confluence with; rejection of falling trend line, rejection of 50% fib retracement, rejection of 50 WMA and rejection of previous support becomes resistance.
UPDATE of ETH bearish-call.Hello guys.
Just a quick update of my quick scenario, normally descending channel don't breakdown. If we can't bounce over our precedent support zone (400 area) then this second scenario is more likely than the first one. We need at least a daily close over it be patient.
But hope is not totally end, MACD is ready to breakout the descending triangle and go bullish that could help us to reintegrate the descending channel and don't fall like a rock to 200 area and then 150.
See my precedent chart i linked for more informations.
Have a nice day.
As always, I'm not a financial advisor.
Important EDIT : Do not take into account the Timeframe.
KEY SUPPORT IS DEAD : Welcome in bearish woods.Hello guys, here some updates of my precedent chart.
The crucial point of my precedent TA didn't hold and invalidate the ABCDE bullish flag.
We clearly see now the woods of a major correction. Remember correction are healthy and that's a good time to buy more if you caught the good price.
Different scenarios are now possible :
- We could be at the wave C of an EW ABC correction that would push us to 8k area.
- We can see on the chart a descending triangle pattern who could slowly put us to 7-6k area with a possible breakdown to 4K... and yes... i think it's possible but as always it's a game of probability.
For the first time in Bitcoin history (if i remember well) the daily MACD shows a possible reverse trend in bearish zone.
RSI shows signs of bearish too.
We'll probably retest 10K before any other scenario, but i don't expect this support to hold a very long time.
It's always a pleasure to read your comments, agreements and disagreements are always welcome when there are constructive.


