GBPPLN - A Potential Buying Opportunity towards 5.03500OANDA:GBPPLN is in a key support zone, which has multiple times seen strong bullish reversals and notable buyer interest. The recent bearish pressure has brought the price into this critical area, presenting a potential buying opportunity.
I expect a move toward 5.03500. However, if this support zone is breached, the bullish outlook would be invalidated, potentially resulting in additional downside movement.
-Target Price: 5.03500
-Support Zone Breach: Invalidates bullish outlook, potential decline
-Risk Management: Crucial for position sizing and protection
Supportbounce

Looking for a break of a trendline on MRK! Looking for a retest of support and then a break of the upper resistance line with valid volume! We have a major gap to fill above us on MRK, and the fundamentals are also looking very nice on MRK.

Why NVDA was not a good candidate for Selling Short last weekBy Friday last week in NASDAQ:NVDA , Support of the Market created an inside day to reversal rebound white candle that engulfed, indicating that the minor drop down out of this trading range was just that: a minor slip of price to below fundamental levels.
Volume was well above average and Volume Oscillators--TSV, TTVA or Chaikin Osc--ticked up along with money inflows. Never assume that a break to the downside from a stable sideways trend is going to continue down. Inside days are no longer a "sure thing" for selling short.
Along with support from a bottom formation, the minor nudge before the black candle that dropped below the low of the sideways trend also was a factor in determining that NVDA was not going to run down. Sell short risk was exceedingly high based on these factors.

Approaching a major support level on CVX.🔉Sound on!🔉
Thank you as always for watching my videos. I hope that you learned something very educational! Please feel free to like, share, and comment on this post. Remember only risk what you are willing to lose. Trading is very risky but it can change your life!

MSFT at Risk for More DownsideNASDAQ:MSFT needs to do a split. It doesn't have buybacks at this time. It is at risk of more downside until it hits prior lows. Support should kick in at the lows of prior rebound areas. The last earnings report was good. Percentage of Shares Held by Institutions ticked up this quarter.

SHOP range bound with potential for Bullish continuationHi guys so this is a Macro analysis on Shopify (SHOP). Recent weeks of price action have got my eyes on SHOP.
Lets jump right in. This analysis is done on the 1 week timeframe thus supporting a Macro lens look on whats happening.
As you can see, ive highlighted key area with an Orange rectangle.
Below it, you can see candles attempting to get into it and getting rejected few times.
However since Nov 2023 till present time, we've been inside the Orange rectangle.
Recently, we've made it to the bottom of the Rectangle to test it as SUPPORT.
We had about 3 weeks of Testing. With this weeks Candle printing a potential Large lower wicked Hammer candle.
This can be an indication of a attempt to reverse our downtrend from $90ish.
At the same time, we have Support confluence of this Ascending Channel.
And our current candle attempting to break Resistance trendline that formed since Feb and local top of $90.
Remember though a breakout above Resistance trendline is not enough. We would need confirmation of it acting as support.
On top of that, at the posting of this idea. Our weekly candle has yet to close. Maintaining price Above 73.50 would be key.
And to keep in mind that there is also Resistance Above $74.00
If things progress look to where the Upper trendline of Ascending Channel and the Upper border of Rectangle meet to potential target.
Also keep an eye for updates on further signs/ clues to take into consideration to help us make informed decisions!
__________________________________________________________________________________
Thank you for taking the time to read my analysis. Hope it helped keep you informed. Please do support my ideas by boosting, following me and commenting. Thanks again.
Stay tuned for more updates on SHOP in the near future.
If you have any questions, do reach out. Thank you again.
DISCLAIMER: This is not financial advice, i am not a financial advisor. The thoughts expressed in the posts are my opinion and for educational purposes. Do not use my ideas for the basis of your trading strategy, make sure to work out your own strategy and when trading always spend majority of your time on risk management strategy.

Arlo Macro Bullish Case + Ascending Channel trade setupHi Guys. As always im on the look out for Macro opportunities in assets with market structure or patterns that scream "Pay Attention to me".
One that stood out to me was ARLO.
This analysis is on the 1 week timeframe.
Notice the Orange rectangle. This zone is a MAJOR Support/ Resistance zone.
When Arlo went Public, we started ABOVE this zone.
Then made our way to the zone, attempted to maintain SUPPORT but eventually fell through and most of price action stayed Below the Zone since 2019.
We had many attempted to test the Zone and try to breakout with little to no luck in:
1. Feb 2021
2. Dec 2021
3. Feb 2022
4. July 2023
5. Sept 2023
UNTIL RECENTLY in March we made our way ABove this zone
We then came down to the bottom fo the zone and confirmed Support. With our current weeks candle up 11% indicating a BUllish Engulfing candle and MAJOR DEMAND.
I believe we are now on our way to test the Upper resistance limit of the Blue Ascending Channel that Arlo seems to be in.
After which we will attempt a Major Support test of the Zone.
Its also IMPORTANT to note, Above the zone, very little data exists. Meaning that theres very little resistance Above. This could fuel an extended Bull run for ARLO to New Highs.
But keep in mind specific signals or signs are needed.
Keep an eye for updates on further signs/ clues to take into consideration to help us make informed decisions!
__________________________________________________________________________________
Thank you for taking the time to read my analysis. Hope it helped keep you informed. Please do support my ideas by boosting, following me and commenting. Thanks again.
Stay tuned for more updates on ARLO in the near future.
If you have any questions, do reach out. Thank you again.
DISCLAIMER: This is not financial advice, i am not a financial advisor. The thoughts expressed in the posts are my opinion and for educational purposes. Do not use my ideas for the basis of your trading strategy, make sure to work out your own strategy and when trading always spend majority of your time on risk management strategy.

Snowflake Ascending Channel bound, with upside potentialHi guys! So always looking for opportunities in repeating patterns/ macro developments.
SNowflake (SNOW) particularly stuck out.
This analysis is conducted in the 1 day timeframe.
Since June 2022, SNOW has been in a Ascending Channel with consistent Higher low prints.
This shows a reoccuring pattern of everytime we've made our way to the bottom of the channel to test Support, we've had bounces to the Upside.
We've had roughly 4 major moves highlighted with returns ranging from 40% to 80%.
We have in April made our way back to test Suppport on this channel.
Currently up roughly 10%.
We are also Above the 21 EMA, maintaining Support.
This is also a reoccuring sign of a rally to the upside.
Currently our 21 EMA is curving to the upside. The rallies that have occured in the past from touching the support line of channel have shown this sign as well.
FOllowed by a Golden cross, where 21 EMA maintains its position above 50 SMA.
Look for this signal to appear.
There is also potential for another test of Support on the lower border of channel. Keep this in mind as it is seen when you look at the previous data.
Remember it is bad practice to trade using a single indicator or tool. Always try to find overlap of signals. Look to updates ont his idea for more evidence to make informed decisions.
__________________________________________________________________________________
Thank you for taking the time to read my analysis. Hope it helped keep you informed. Please do support my ideas by boosting, following me and commenting. Thanks again.
Stay tuned for more updates on SNOW in the near future.
If you have any questions, do reach out. Thank you again.
DISCLAIMER: This is not financial advice, i am not a financial advisor. The thoughts expressed in the posts are my opinion and for educational purposes. Do not use my ideas for the basis of your trading strategy, make sure to work out your own strategy and when trading always spend majority of your time on risk management strategy.

PLUG set up on support for Long EntryPLUG is on a 60 minute chart ascending in a relatively parallel channel and oscillating within
it. Price has cycled into the lower thick green support trendline. A falling wedge pattern is seen
It is now on its second touch of the support. PLUG has gained 75% in three weeks. As a green
energy small cap, it is sharing an uptrend with FCEL, QS and others.
I find PLUG properly situated to add to my position taking a trade of more shares long. I call it
buying a fall into support and buying a falling wedge set up for a breakout ( again).
Yesterday a successful put option scalp provided profit to redeploy here. I will roll over
options expiring February 16th into March 16th. The monthly call contracts have the narrower
spreads and better liquidity from volume.

Crowdstrike Holdings Testing Support, Whats next?Hi guys! This is a Technical Analysis on Crowdstrike Holdings (CRWD) on the 1 Week Timeframe.
Since this is a WEEKLY chart, its important to note that the current candle is not yet confirmed and closes end of trading Friday, 08/11/2023
Lets take our attention to the Orange circle highlighting current price action.
We have reached a critical SUPPORT zone.
A place where 2 SUPPORT levels converge
1. BLUE LINE - the 21 W EMA
2. BLACK SUPPORT TRENDLINE - 6 month support trend line
Currently we have "WICKED" or bounced from this convergence of supports.
It is crucial that we close this weeks candle ABOVE this zone.
Critical also to stay above the 21 W EMA, as doing so indicates BULLISH TREND.
Confirming BELOW would indicate BEARISH Trend.
*** If we see confirmation of SUPPORT
-> this can be an ENTRY ZONE for a potential trade/bounce back up.
*** How ever its a little too soon to tell
We are also currently BELOW another TRENDLINE thats labeled "Support turned RESISTANCE".
It be nice to see PRICE get ABOVE this, come end of week.
Notice also the RED CIRCLE that shows our REJECTION from a convergence of RESISTANCE.
Here we have 2:
1. being the ORANGE horizontal resistance line
2. Slanted BLACK LINE
Take a look also at the LARGE UPPER WICK and how multiple candles have LARGE UPPER WICKS.
This indicates SELL PRESSURE and that this area is a tough area to break to the UPSIDE.
It can give off further bearish momentum to the downside.
We also have GOLDEN CROSS of the:
1. 21 EMA
2. 50 SMA
BUt this alone is not enough for the BULLISH CASE.
We need to have price stay ABOVE for it not to be short lived and become a FAKEOUT.
Worst case scenario for now if we CANNOT maintain SUPPORT at our current area.
ANd we end up breaking below 21 EMA & 6 MONTH SUPPORT LINE.
Look to the 50 SMA as a SUPPORT level, it is currently pointed down so where ever it converged with price action at the time if a hypothetical price decline.
If that fails, look to the ORANGE " Previous Resistance Trend from TOP" line. That would actually be a wonderful zone, provided we maintain SUPPORT.
-> This would be another zone to enter POSITIONS for a trade.
Now lets take a look at our Indicators.
1. RSI -> We printed a Lower High, with RSI going BELOW the BLACK Moving Average.
If you look LEFT, there is evidence that when we do this, price tends to drop. So be alert.
2. STOCH RSI is also in the process of printing a BEARISH CROSS. If this happens BEARISH moment will enter, leading to the probability of further price DECLINE.
-> If you look LEFT, everytime we point down, it has coincided with price DECLINES.
3. MACD, with the printing of light GREEN histograms that are small in size, this also is an indication of waning of BULLISH momentum. If we see a CROSS between blue/orange lines where BLUE goes under the ORANGE -> this will lead to an injection of BEARish momentum and further price DECLINES.
CONCLUSION:
CRWD has reached a critical SUPPORT zone, for us to start our descent back to the all time highs we need to maintain SUPPORT here. Some signs point to bullishness where others give off signs of continuation of a DECLINE from our REJECTION zone. But the first thing that needs to get done is confirming SUPPORT above the mentioned zones. Important to see what price action and the indicators do come end of the week.
Stay tuned for more updates on CRWD in the near future.
Thank you for taking the time to read my analysis. Hope it helped keep you informed. Please do support my ideas by boosting, following me and commenting. Thanks again.
If you have any questions, do reach out. Thank you again.
DISCLAIMER: This is not financial advice, i am not a financial advisor. The thoughts expressed in the posts are my opinion and for educational purposes. When trading always spend majority of your time on risk management strategy.

Current Developments on CVS chart can make for opportunityHi guys! This is a Technical analysis on CVS Health Corporation (CVS) on the 3 day timeframe.
We discuss some Current developments on CVS, which maybe pointing to signs of potential opportunity to invest/ hold CVS.
We've had a deathcross that has brought us down more than 38%.
Which has lead us to a critical support trendline that has acted as support since March 2019.
We recently bounced from this trendline with a BULLISH ENGULFING candle print
We have from this support line bounced up to reach the 21 EMA
Current price action is attempting to establish support on 21 EMA.
MACD has crossed Bullish with Green bars printing.
BUT also remember that we have resistance above us from the 50 SMA.
We are also in an established DOWNTREND from the Deathcross. Until proven otherwise so we have to pay attention for signs of trend change.
Key area is around the 2 moving averages. We need to establish support on 21 EMA. We have to also see how we react with the 50 SMA. If we get ABOVE 50 SMA and maintain support, it is likely we print a GOLDEN CROSS, leading to BUY pressure to come in.
This could be the necessary catalyst for trend change.
Another hint in an attempt to trend change is the 21 EMA flattening out, beginning to show signs of a curvature to upside.
Now lets Look left to find evidence of previous patterns in the Moving average interactions, Support line interaction and MACD.
Our first time interacting with the SUpport line, we had many touches, before printing a GOLDEN CROSS. ALong with MACD CROSS ABOVE 0 level, we had a 48% Uptrend.
Our 2nd interaction with SUpport line, we experienced a fakeout on the 1st touch. MACD could NOT move ABOVE 0 level.
The 2nd touch of support line, had the GOLDEN CROSS and the MACD cross ABOVE 0 level. This lead to an extended Bull run for CVS with gains of 100%.
Keep this in mind. Look for similar pattern in our current price action. If we see a Golden Cross with MACD crossing ABOVE 0 level. This would mean an UPTREND is probable. But dont discount the possibility of a fakeout. We can always have another attempt to test support on support line.
Watch closely for these to develop in our current price action. Best opportunity to invest would be after Golden cross has been established with confirmed MACD cross Above 0 level in my opinion.
__________________________________________________________________________________
Thank you for taking the time to read my analysis. Hope it helped keep you informed. Please do support my ideas by boosting, following me and commenting. Thanks again.
Stay tuned for more updates on CVS in the near future.
If you have any questions, do reach out. Thank you again.
DISCLAIMER: This is not financial advice, i am not a financial advisor. The thoughts expressed in the posts are my opinion and for educational purposes. Do not use my ideas for the basis of your trading strategy, make sure to work out your own strategy and when trading always spend majority of your time on risk management strategy.

SRF bouncing from crucial support!Chemical sector has lately showed some good reversal signs.
SRF is one stock which you can keep on your watchlist from chemical sector.
Pin bar candle in weekly TF near support might be a signal of start of uptrend in the stock.
Minimum target can be 2400. SL is below low of pin bar candle or below 2100 WCB.
IDEA IS SHARED ONLY FOR EDUCATIONAL PURPOSES

Etsy Potential Major Support Bounce Trade IdeaHi guys! This is a technical analysis on Etsy (ETSY) on the 3 Day timeframe, supporting a potential Support Bounce Play.
We've come a long way from our recent Rejection off the "Major Resistance" Red Trendline.
Moving below the 21 EMA (Purple line)
Breaking Below our previous Support Trend line Turned Resistance Line (Black Horizontal line)
To now come in contact with Major Support.
Notice how in Previous interactions with this "Major Support", we have bounced for price gains.
The key is not the percentage gains but simply the fact that we bounce from here.
Our previous candle printing a Bullish Engulfing candle and current candle also in the process of confirming. This supports the idea of further price increases as it indicates buying pressure.
If history is any indication, also remembering that its not an exact reference. We can say that it is "probable" that we BOUNCE from here.
Since its our 3rd touch point in all of the history of ETSY's price action. This also adds to my bounce projection.
Price action tends to react around Support/ Resistance trendlines.
If this holds true, our target for this bounce idea, would be the "Re-test" of the Support Turned Resistance line or "Target 1 Sell Zone".
The 21 EMA also converges currently at the level. So this can be another line we interact with.
STOCH RSI is a great indicator to combine with this idea as it depicts when bullish or bearish momentum comes into trends.
We are currently BELOW the 20 level, but have CROSSED BULLISH.
Everytime we've done this in Previous History, and have CROSSED ABOVE the 20 level it has lead to a Bounce off the Support.
With all that has been said, this is a Critical Area to watch for Etsy.
__________________________________________________________________________________
Thank you for taking the time to read my analysis. Hope it helped keep you informed. Please do support my ideas by boosting, following me and commenting. Thanks again.
Stay tuned for more updates on ETSY in the near future.
If you have any questions, do reach out. Thank you again.
DISCLAIMER: This is not financial advice, i am not a financial advisor. The thoughts expressed in the posts are my opinion and for educational purposes. Do not use my ideas for the basis of your trading strategy, make sure to work out your own strategy and when trading always spend majority of your time on risk management strateg

Shopify Short term Sell Target Off Major Support BounceHI guys, ive been following Shopify (SHOP), since its test of some important SUPPORT. This is a quick update from my previous idea. (Which you can find down below for more context)
We've currently bounced extremely bullish off the SUPPORT level, heading towards a SUpport turned Resistance line associated with the UPTREND channel i identified.
Normally when we break down or break above trend lines, that we have respected for some time. We tend to retrace back to that same line to Re-Test it.
Such is the case for Shopify.
Watch the Volume, an INCREASE/ SPIKE in Volume is absolutely needed to get back ABOVE, resuming our UPTREND.
But due note: we are heading into Labor day weekend, thus RISK of LOW VOLUME.
I would then consider if you were able to take positions from the SUPPORT level bounce
To think about off loading some of your position here.
If we do get back into the UPTREND channel from my previous POST. We can look to take new positions if SUPPORT is CONFIRMED.
__________________________________________________________________________________
Thank you for taking the time to read my analysis. Hope it helped keep you informed. Please do support my ideas by boosting, following me and commenting. Thanks again.
Stay tuned for more updates on SHOP in the near future.
If you have any questions, do reach out. Thank you again.
DISCLAIMER: This is not financial advice, i am not a financial advisor. The thoughts expressed in the posts are my opinion and for educational purposes. Do not use my ideas for the basis of your trading strategy, make sure to work out your own strategy and when trading always spend majority of your time on risk management strategy

ARK Innovation Support Area to Watch for BounceHi Guys! This is a Technical Analysis on ARK Innovations ETF (ARKK) on the 1 Week Timeframe.
Jumping right in:
Our current Price action is currently bouncing off a Confluence of SUPPORT Test
We tested this Confluence of Support area the prior 2 weeks.
The Confluence involves:
1. 50 SMA
2. Support Line of the Uptrend Channel
This would make an area to go LONG.
We are currently in the process of testing RESISTANCE from 21 EMA
Since this is one the 1 Week timeframe, we need to observe how this weeks candle interacts with the 21 EMA.
If we can close ABOVE, at the end of the week. That would be a good sign.
NOTE: If we can confirm SUPPORT on 21 EMA, this is a bullish sign. Since UPTRENDS are associated with being ABOVE the 21 EMA
It would hint at or strengthen the probability we move towards the Horizontal "Resistance Line" Above in Red.
This would also be an area to TAKE PROFIT.
BUT my main focus for ARKK would be to BREAK Above and CONFIRM Support over the MAJOR Resistance Line in Orange.
Once we do that, we have CHANGED our MAJOR TREND.
Though we have a long ways to go, keep in mind that when this happens, itll be a CRUCIAL AREA to watch.
Since we havent had 3 touch points, we could be rejected which could make it a short play also.
Now since i believe we must always be prepared. Lets look at the downside, if we can't maintain this current SUPPORT area.
My first downside target would be the line titled "Support Line#1
My 2nd downside target would be the line titled "Support Line#2
To find more evidence of whats to come, i look at the current indicators placed.
STOCH RSI, is currently BELOW the 20 level. A BULLISH CROSS, where Blue line is above Orange ABOVE the 20 elvel, would indicate Bullish momentum coming in. This would help push prices towards Resistance Line.
Notice also RSI, particularly the Black line. We were for a short time, below this line but currently attempting to move back ABOVE. If we can maintain SUPPORT on this, our trend would be intacted. Which would support UPTREND.
Finally the MACD, we need to watch this one closely. We have crossed BEARISH. We need to see a Bullish Cross and maintain staying ABOVE the 0 level. If we do this, i can eventually see ARKK move towards the "MAJOR Resistance line".
__________________________________________________________________________________
Thank you for taking the time to read my analysis. Hope it helped keep you informed. Please do support my ideas by boosting, following me and commenting. Thanks again.
Stay tuned for more updates on ARKK in the near future.
If you have any questions, do reach out. Thank you again.
DISCLAIMER: This is not financial advice, i am not a financial advisor. The thoughts expressed in the posts are my opinion and for educational purposes. Do not use my ideas for the basis of your trading strategy, make sure to work out your own strategy and when trading always spend majority of your time on risk management strategy

MC - not the end yet?It had an insane move today, it may not be over yet, lots of traders in big profits so we can see some flush down taking profit moves. Be careful. The fact that it is still so high, could bring more buyers...
Details on the chart.
Good luck traders

ROLEXRINGS - Bullish Swing ReversalNSE: ROLEXRINGS is closing with a bullish swing reversal candle.
Today's candlestick formation indicates strong demand and stock should move to previous swing highs in the coming days.
The stock has been consolidating for the past few days which is indicating demand.
One can look for a 8% to 12% gain on deployed capital in this swing trade.
The view is to be discarded in the event of the stock breaking previous swing low.
#NSEindia #Trading #StockMarketindia #Tradingview #SwingTrade
Disclaimer:
This is for educational purposes only.

VIDUSDTSet alerts on this one. Preferable support zone bounce entry.
Oscillators in the sweet spot on 15min chart.
Good luck traders!

GBPCAD DOUBLE BOTTOMPrice has made a double bottom on the daily timeframe.
Strong price rejection on support suggests a strong bullish move coming.

GBPUSD bounce from cloud and kijun about to happen.I've put a stop market order right below the Kijun-Sen as that would mean we are moving away from these 2 strong ichimoku resistance lines. The chikou span is free to go lower as it will take 12 more bars for it to touch close again. It also gives some nice resistance when touching past price area. You can use a smaller stop and take profit to your liking but the entry part here is most crucial.

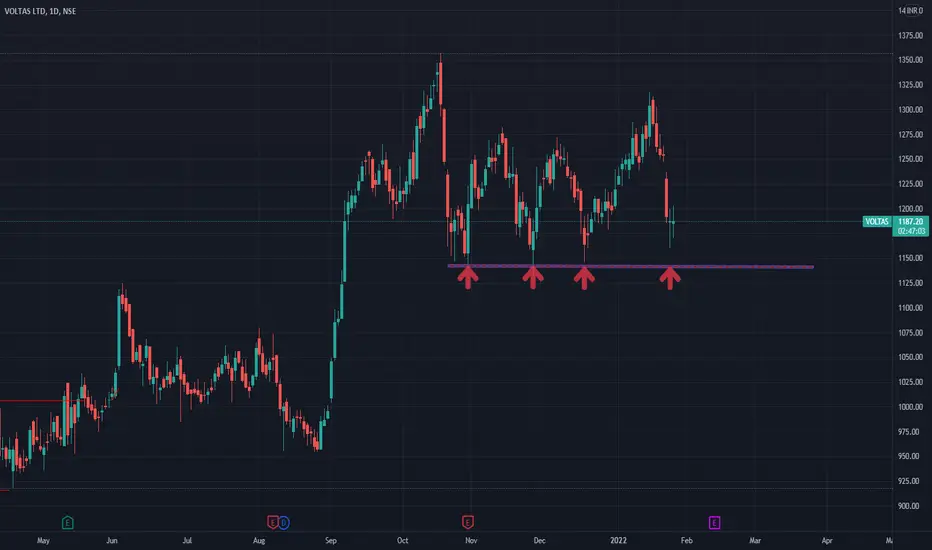
VoltasVoltas is nearing its very strong support zone of 1140, it bounced multiple times in last three months from 1140 levels.
Could be bought here or on dips till 1155-1160 levels & hold with stoploss slightly below 1140 levels for bigger targets of 1250/1300
USDCAD LONG IDEAHey guys, on the daily tf, we see formation of higher lows. I expect this pair to bounce from that horizontal support. My bias will be violated incase it breaks and starts trading on the lower side.

NZDCAD LONG IDEAHey guys, this pair bounced off from a major daily support level. I expect it to continue with the bullish momentum
