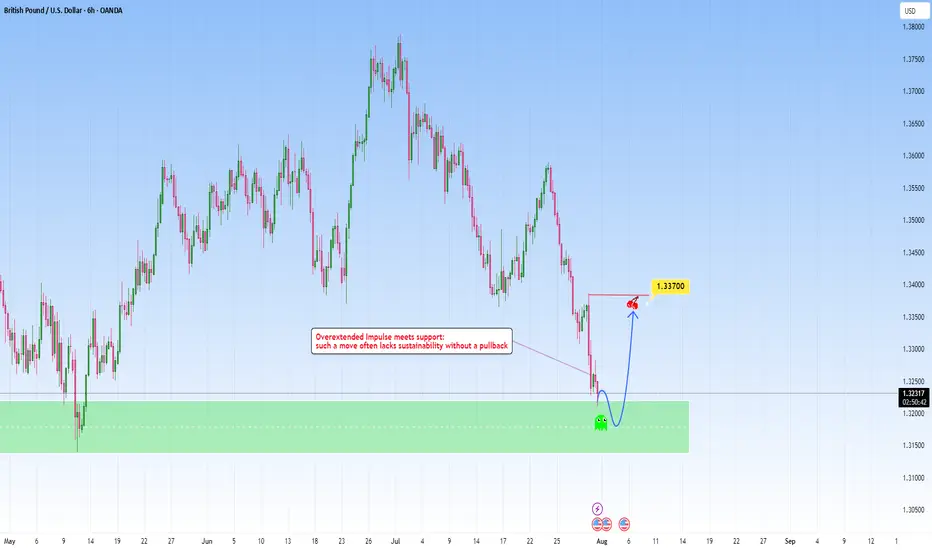
GBPUSD: Overextended move meets with supportAfter a steep and aggressive sell-off, price has tapped into a clear zone. This recent move wasn't gradual: it was impulsive and sharp, which tells us one key thing: exhaustion is likely.
The overextension into it without any meaningful pullback typically highlights imbalance, where price moves ahead of structure and becomes vulnerable to correction. But price doesn’t move in straight lines forever. Markets that fall too quickly tend to burn out just as fast. When such aggressive pushes meet with a clean, resistance like this one, they often trigger the exact opposite, a snapback correction.
I am now watching for signs of absorption and accumulation. This could play out in the form of sideways candles, wick rejections, or a sudden reversal spike. These are early signs that smart money might be stepping in.
My projected target would be toward the 1.33700 area, from the last impulsive drop. It’s a classic mean reversion setup, not just technical but psychological. Traders who chased the move late may find themselves trapped, fueling the correction as they’re forced to exit.
Supportzones
$SOL Loses Key Support | Eyes on $140 & $95 Zones📉 CRYPTOCAP:SOL Loses Key Support | Eyes on $140 & $95 Zones
🕵️♂️ On the daily timeframe, #Solana has officially lost its key support near $140, which previously acted as a strong bounce zone. A failure to reclaim this level could open the gates for a deeper drop toward the $95–$100 support range.
📊 Indicators signal downside:
RSI is trending downward
MACD shows a bearish crossover
Stochastic RSI confirms continued selling pressure
⚠️ Macro pressure adds fuel to the fire: August 1st tariff tensions, with expected news from Trump on charging Paris, are weighing down global risk assets. Historically, August tends to be a bearish month for crypto markets.
🎯 Key Levels to Watch:
Immediate Resistance: $140
Major Support: $95–$100
🧠 Trade wisely and manage risk accordingly.

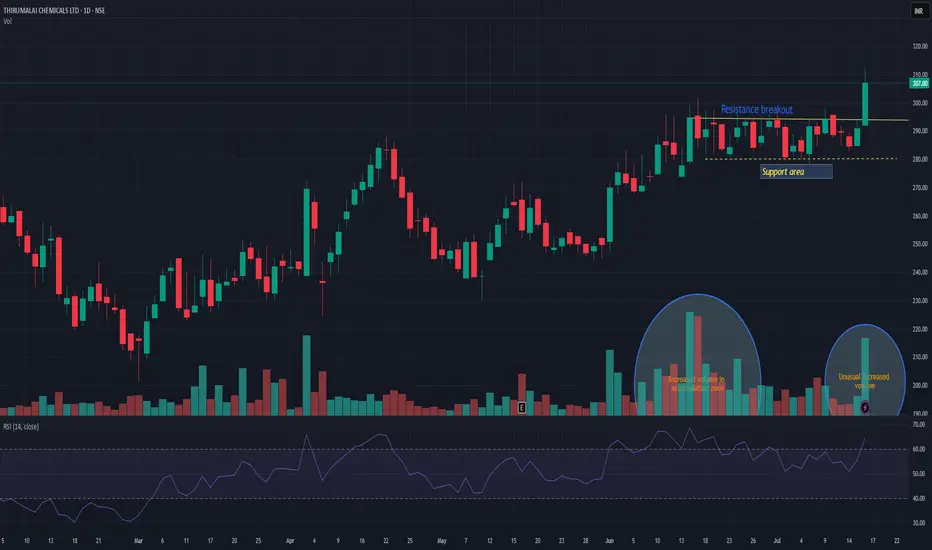
TIRUMALCHMTIRUMALCHM has given resistance breakout with decent volume. Another good thing is unusual volume increased in accumulation zone. Support can be seen near 280 levels. There is high probability that this time it may push the stock in to trend change and may take momentum to the next level. Keep it on radar.
LINK/USDT (Chainlink to Tether) from the 4H interval⚡️ Technical situation – quick overview
✅ Breakout from the descending channel (purple lines)
✅ Resistance zone 14.42 – currently being tested
✅ Target within the breakout range – around 17.73 USDT
⚠️ Stochastic RSI in the overbought zone – local correction possible
🟪 Descending channel – broken!
The descending channel that has been in place since mid-May has been broken upwards.
Such breakouts often signal a change in the local trend.
Theoretical range of movement = channel height (~3.30 USDT) added to the breakout point (around 14.42) = ~17.73 USDT – perfectly aligned with your resistance level.
🟢 Key Resistance Levels (green):
Level Meaning
14.42 USDT Current tested resistance – psychologically significant
15.65 USDT Local high + June price gap
17.73 USDT Potential target after a breakout – range from the formation
🔴 Support Levels (red):
Level Meaning
12.73 USDT Support from the pre-breakout consolidation
11.91 USDT Key defensive level of the uptrend
11.07 / 10.12 USDT Historical support with strong demand reactions
📉 Stochastic RSI (oscillator):
Currently deep in the overbought zone (above 80).
This may indicate local exhaustion of momentum and a short correction before further upward movement.
However: in strong trends, the RSI may remain high for an extended period – it does not automatically provide a sell signal.
📈 Bullish scenario:
Retest of the 14.42 level as support → confirmation of the breakout
Then a move towards:
15.65 – local stop
17.73 – final target from the channel breakout
🟩 Stop-loss: e.g., below 12.73 USDT (loss of key support)
📉 Bearish scenario:
False breakout and decline below 14.42
Loss of the 12.73 level → possible quick decline to 11.91–11.07
🔴 In this case, a new swing low could open the way to 10.12 USDT.
📌 Summary:
Element Rating
Technical Pattern ✅ Breakout from a descending channel (bullish signal)
Current Level ❗ Test of Key Resistance – Decision Point
RSI (Momentum) ⚠️ Overbought – Correction Possible
Upside Potential (Target) 📈 17.73 USDT
Threat ❌ False breakout and return to below 12.73 USDT
🧠 My suggestion (not investment advice):
Observe the price reaction at 14.42 – if it holds above and consolidation forms → a signal to continue.
If the 4H/1D candle closes below, consider caution, as this could be a bull trap.

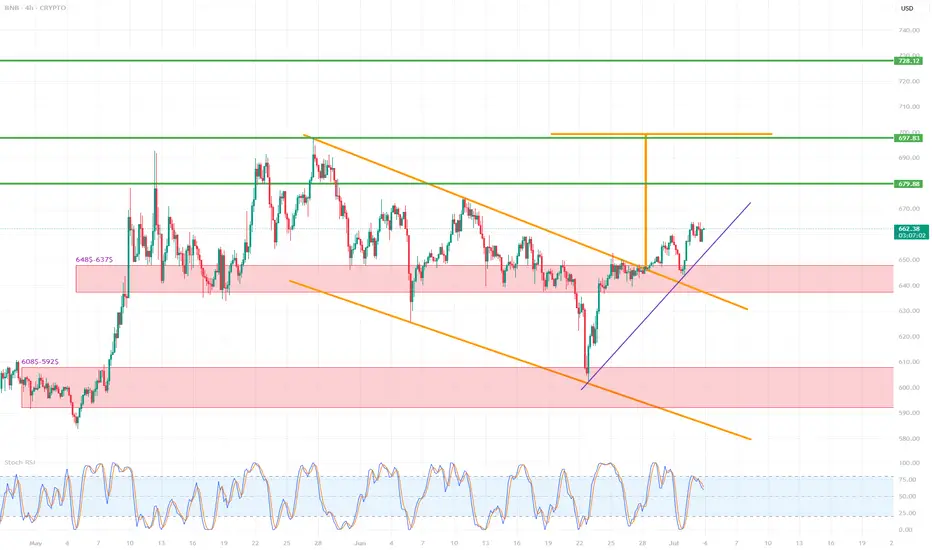
BNB/USD (4h interval)🔍 1. Chart structure
Instrument: Binance Coin / USD (BNB/USD)
Interval: 4 hours
📐 2. Technical formations
🔸 Breakout from the descending wedge formation
The descending wedge (orange lines) is a bullish formation - it suggests a potential breakout upwards.
The breakout occurred dynamically, with a large breakout candle (confirmation of the formation).
The goal of breaking out of the wedge is usually the height of the entire formation - this is marked with an orange arrow.
📈 Breakout range (target): around $697–710
🟢 Potential next targets:
697.83 (local resistance/projection result)
710.73 (main wedge height projection)
728.12 (strong resistance from history)
📊 3. Supports and resistances
🟥 Support zones (red rectangles):
$648.5–637.5 – previous resistance, now tested as support after the breakout.
$608.5–592.5 – strong support from previous lows.
🔼 Currently, the price has tested the upper support zone (648–637), reacted positively and continues to move up.
🟩 Resistance levels (green horizontal lines):
679.88 USD – local resistance, first target after breaking out of the wedge.
697.83 USD – projected range from the formation.
710.73 USD – full technical range of the breakout.
728.12 USD – strong resistance from history, may be a long-term target.
📉 4. Trends and support lines
Purple upward trend line – currently the price is above, which confirms the short-term upward trend.
Its break may lead to a retest of 648–637 USD.
Only below this zone can a larger correction be considered.
📈 5. Stochastic RSI indicator
Currently in the overbought zone (above 80).
Possible temporary cooling – signal for local correction / consolidation.
It is worth waiting for the indicator to go down to around 20 to re-enter the long.
✅ 6. Scenarios
🔼 Bullish (base) scenario:
Staying above 648–637 USD.
Maintaining the uptrend line.
Continuation to 679.88 → 697.83 → 710.73.
🔽 Bearish scenario:
Breaking the purple trend line.
Returning below 648 USD → going down to the 608–592 zone.
Negation of the breakout from the wedge.
📌 Final conclusions
Breaking out from the descending wedge is a strong pro-growth signal.
The price behaves in accordance with technical analysis, testing the previous resistance as support.
Currently, the retest and consolidation phase is underway – maintaining the trend line and the level of $648 will be key.
The medium-term target is $697–710.
TV Today Network is currently near its key support zone.This is the 4 hour chart of TV TODAY.
Stock is trading in an ascending channel.
Post a corrective phase of 8–11%, the stock typically rebounds with a return of 11–14%, aligning with the upper and lower boundaries of the ascending channel.
VRVP is indicating two significant price levels—₹170 and ₹160—where notable volume accumulation has occurred, suggesting potential support or resistance zones at these levels.
If this level is sustain, then we may se higher prices in the Tv Today.

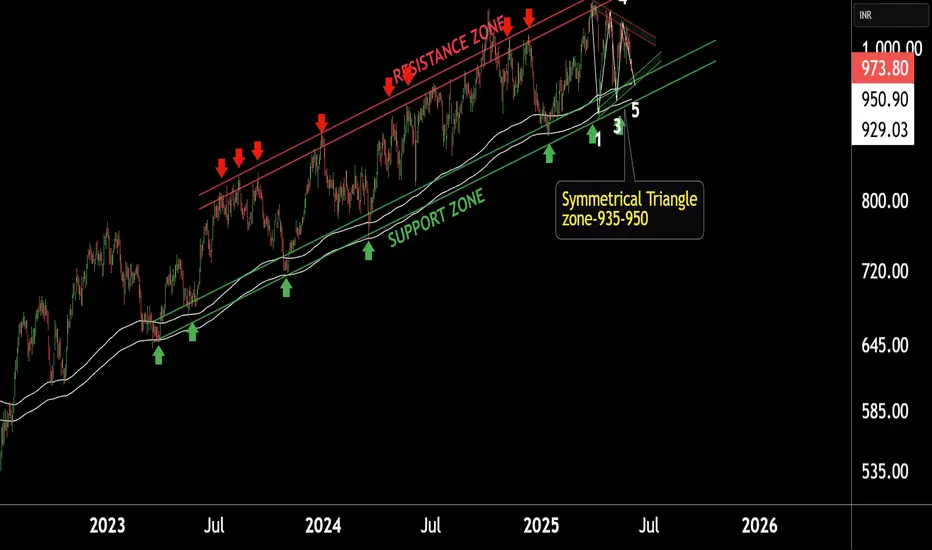
JSW Steel is near its Support LevelThis is Daily chart of JSWSTEEL.
The stock is trading within an Ascending Channel.
It is currently near the lower support zone of the channel, which lies in the ₹920–₹945 range.
Simultaneously, a Symmetrical Triangle pattern is forming with a consolidation range between ₹930–₹950.
The stock is currently taking dynamic support from two EMAs: the first EMA is providing support near ₹245, while the second EMA is acting as a deeper support around ₹230. Both EMAs are helping maintain the stock’s bullish structure."
If this level is sustain , we may see higher prices in the stock.
AAVEUSD 1D ChartHello everyone, I invite you to review the current situation of AAVE in the USD pair. When we enter the one-day interval, we can see how the AAVE price will see a return above the main upward trend line, but here we can see that we are still below the formed downward trend line, which in the event of further increases may prove to be a strong resistance.
Here we can see how the current rebound is fighting the resistance at $ 256, only when the level is positively tested, resistance will be still visible at the price of $ 290, this will be a strong resistance right next to the downward trend line, only a positive exit from the top and staying above this trend line can lead to movement towards resistance at $ 339.
Looking the other way, we can see that when the trend reverses, we first have a support zone from $ 233 to $ 211, however, if this zone is broken, we can see a quick return of the price to the support area at $ 174.
The Stoch RSI indicator shows that despite the current upward movement, there is still room for the upward movement to continue.

Meta - The Correction Is Officially Over!Meta ( NASDAQ:META ) is retesting the previous all time high:
Click chart above to see the detailed analysis👆🏻
For more than 7 years, Meta has been perfectly trading in a reverse triangle formation. And just three months ago, Meta once again retested the upper resistance trendline and reversed towards the downside. But with the retest of the previous all time high, this correction is over.
Levels to watch: $500, $800
Keep your long term vision,
Philip (BasicTrading)

Will BTC emerge from the local downtrend channel on top?Hello everyone, let's look at the 1D BTC to USD chart, in this situation we can see how the price is moving in a downtrend channel in which we can currently observe an attempt to exit on the top. In such a situation, it must be borne in mind that often exiting the channel gives energy for growth close to the height of the channel itself, which in this situation could give a valuation in the region of $ 100,000 for 1 BTC.
However, before this happens, the price must positively exit the channel and break the first resistance line at $ 88,800, and then a significant level at $ 94,200.
Looking the other way, when the price bounces off the upper boundary of the channel and starts to fall again, we have a visible support zone from $ 85,150 to $ 83,000, and then a second very strong zone from $ 77,200 to $ 74,100.

Will THETA return to an upward trend?Hello everyone, I invite you to review the current situation on Theta Token. When we enter the one-day interval, we can see how the price moved in the formed downtrend channel. What's more, we can see here the movement at the lower border of the channel and how the price maintains a strong support at the level of $ 0.90, however, if we go lower, just below the channel border, a very strong support zone for the price from $ 0.69 to $ 0.42 is visible.
We can also see how the price enters a slight sideways trend in which it can approach the downtrend line lasting inside the downtrend channel, such consolidation and gathering of energy can have a positive impact on the movement in the coming weeks, which can lead to growth. When such a scenario works, we can see a nice upward movement around $ 1.36, another significant resistance can be seen at $ 1.75, and then we have strong resistance around $ 2.36.
It is worth paying attention to the MACD indicator here, which shows how we are staying in the lower range and the ongoing movement is visible here, which may also indicate a potential attempt to rebound the price.

BNX: After a +900% Rally, What's Next?BNX had an incredible run, skyrocketing +900% in just 19 days, completing a 5-wave Elliott Wave structure and peaking at $1.3333. Since then, the price has been in a downtrend, now approaching the critical $1.00 psychological support level.
Key Support Levels
The weekly open sits at $0.9387, aligning perfectly with the Point of Control (POC) from the previous trading range, making this a crucial level to watch. However, the bigger question remains—where is the next high-probability trade setup?
Liquidity Below $0.8278 – There's a significant liquidity pool just below this low, making it an attractive area for potential stop hunts before a reversal.
0.5 Fibonacci Retracement ($0.7333) – Measuring the full +900% move, the 50% retracement aligns near a key support zone.
Weekly Bullish Order Block ($0.7076) – A historical area of demand, adding further confluence.
1.272 Fibonacci Extension ($0.7250) – Another confirmation of a potential bounce area.
Anchored VWAP from $0.1334 – Currently sitting at $0.6675, this dynamic support strengthens the buy zone.
0.618 Fibonacci Speed Fan – If the price drops towards this level by late February, it could provide additional confluence for a bounce.
Potential Trade Setups
Bullish Setup: If price sweeps $0.8278 liquidity and enters the $0.7333 - $0.7076 demand zone, a long opportunity with confirmation could offer a great risk-to-reward trade.

NMR with potential for growthHello everyone, let's look at the NMR chart in hand at USDT, taking into account the 1W interval.
As we can see, the prices are moving under the designated inheritance trend line, and what is more, you can see here when we entered a strong support zone from $ 11 to $ 7, which can potentially be a good shopping zone for Long position.
In a situation where BTC stabilizes at the current price or the valuation increases again, we can see an interesting increase on NMR.
It is worth considering several output levels like T1 = 12.36 $
T2 = 14.98 $
T3 = 19.59 $
T4 = 22.77 $
T5 = $ 26.74
Looking at the RSI indicator, you can see the traffic below the lower limit, which may also indicate a potentially upcoming growth movement.

MCHP Long Setup: Oversold Rebound w/ Rising Volatility & VolumeMicrochip Technology (MCHP) is presenting a promising long opportunity for a temporary rebound, supported by three strong technical factors:
Slow Stochastic in Extreme Oversold Territory : The indicator is below 20, signaling excessive selling pressure, often linked to potential short-term recoveries.
Rising Volatility Index (LSVI) : The significant increase in volatility suggests the market is entering a phase of larger price movements, increasing the probability of a sharper rebound.
Increasing Volume with Reduced Decline: Recent candles show higher trading volume accompanied by a slowing rate of decline, indicating potential buyer activity and a technical correction from the recent sharp drop.
With the price near a critical support zone and a target identified at $65.00 (10% gain), this setup offers a compelling risk-reward ratio for short-term traders. If the price crosses above the red line, it may reach $71.00 (20% gain).
Watching for confirmations such as a %K/%D crossover on the Slow Stoch and sustained buying volume will be key to validating this thesis.
Disclaimer : Always manage risk carefully, particularly in high-volatility environments.

NZDCAD Technical Analysis: Bullish Trend Remains IntactHello traders,
I can see that the NZDCAD pair is currently trading at 0.82634, maintaining a bullish trend as price action consistently forms higher highs and higher lows. After a temporary correction from Friday's high of 0.83107 to 0.82495, the pair appears to have resumed its upward trajectory, targeting a breakout above the previous high.
Key Observations
Trend: Bullish, with a series of higher highs and higher lows.
Momentum and Sentiment: Both indicators support the bullish outlook, reinforcing expectations for continued upside.
Key Levels:
Immediate Resistance: 0.83107 (Friday's high)
Invalidation Point: A break below 0.82428 would negate the bullish scenario and signal potential downside risk.
Conclusion
The overall outlook for NZDCAD remains bullish, with momentum and sentiment aligned for a continuation higher. A sustained break above 0.83107 would confirm the bullish trend, while a move below 0.82428 would call for a reassessment of this view.
Do let me have your take.
Cheers and happy trading.

BALAMINES: SUPPORT & RESISTANCE TRADINGBalaji Amines has been trading in a consolidating zone for an extended period, oscillating between well-defined support and resistance levels. This range-bound behavior reflects a lack of decisive directional movement, but also offers an excellent opportunity for range-based trading strategies.
Technical Analysis:
The stock has recently touched its support level for the 7th time, indicating a strong demand zone at this level.
The repeated testing of support without a significant breakdown strengthens the case for a potential bounce.
Key support: ₹ 1990-2000
Key resistance: ₹ 2441-2550
Trade Setup:
Entry: Near the support level around ₹1990-2000.
Target: ₹2441-2550, the upper boundary of the consolidation range.
Stop Loss: Below the support level, to minimize risk if the support fails.
Disclaimer: This analysis is for educational purposes only. Conduct thorough research or consult a financial advisor before making trading decisions.

FTM/USDT Long-TermI invite you to take a quick look at the FTM to USDT chart over a one-weekend period. As we can see, the price moved upwards from the downward trend channel with dynamic movements.
Currently, we can see that we are moving between two zones, there is a strong support zone from $0.61 to $0.52, and a second resistance zone from $0.84 to $0.97.

MKR/USDT 1W interval chartHello everyone, let's look at the current situation of MKR taking into account the interval of one week. As we can see, the price has left the trend triangle with a dynamic downward movement, currently we are staying below the downward trend line.
Let's start by setting goals for the near future, which include:
T1 = $1,745
T2 = $2192
T3 = $2546
T4= $2,900
Looking the other way, there is a strong support zone that managed to keep the price from further correction, the zone from $1,278 to $936, but if this zone is broken, we may see a strong price drop to around $514.

BTC new ATH what's next?BTC reaches new ATH, but the level around $76,600 is a key place in the four-year cycles lasting for BTC, because from its low in each cycle, it grows less by 5.3 times than in the previous cycle. However, the situation may change with the introduction of ETFs to the market, which changed price movements. If we manage to break out of the $76,600 level, we can see a move towards $83,800, and then the important level is at $89,000. When the price starts to recover, the first important thing for us is the support zone from $73,700 to $70,000, when this zone is broken, the price can quickly return to the level of $66,000, and then the important support is at the price of $59,300. We have also identified a visible upward trend line on which we can currently base critical points in the event of a correction.

Will Kasia stay in the support zone?Hello everyone, let's take a look at the Kaspa chart in USDT pair, taking into account the time frame of one day. you can see here how the price has returned to the very important support zone from $0.177 to $0.0931, this is a very important zone because it is the last place of support before a strong price drop.
You can see here how the price is struggling to maintain the level in the triangle, from which we can see candles that are trying to pay off the triangle with the bottom, then the last support line is visible.
Looking the other way, when the price starts to rise again, first of all you can see the resistance at the level of $0.144, then the level at the price of $0.168 will be important, and then the very important resistance at the price of $0.208, which previously turned out to be the price peak.

BankNifty Levels for Intraday for 22 Oct 2024BankNifty is trading between support and resistance zone but it is still in bullish channel so trading on buy side has high probability.
We can go long when price starts reversing from 51850-51900.
Trade only when price comes to support zone for good risk to reward and high probability.
Note : Its just an analysis, wait for the price to confirm.
Disclaimer : Always follow risk to reward, this is the only key to success in market, no matter how much good a trade is looking we never know the future.

BankNifty is in Bullish ZoneBank Nifty was recover itself into its channel and still trading in bullish channel near bottom of the channel.
Resistance Level is also nearby so wait for the price come to near support level for good risk to reward.
Learning : If any instrument is in bullish trend then all support act as strong support and resistance levels breaks.
Note : Its just an analysis, wait for the price to confirm.
Disclaimer : Always follow risk to reward, this is the only key to success in market, no matter how much good a trade is looking we never know the future.

Credit Access at Strong SupportThe Strongest stock in one of India's fastest growing sectors has fallen to very strong support.
The fundamentals of the sector were hurt due to lengthy high interest rates, which are soon to witness the much favorable downturn.
Company fundamentals are still intact though and it is the leader in small finance industry.
This idea is to spread awareness and should not be considered as basis of any financial commitment. DO YOUR OWN RESEARCH BEFORE TRADING/INVESTING.
