USDX Analysis going into next week's Trading. See Weekly-Chart!
Buy AAAPL, Buy Googl, Buy QCOM, Buy McDonalds Fast Food.
I honestly have not checked their charts. But they are some of the stocks that must be starting to turnaround in their share prices following the recent sell-off, these companies I would say with their global franchises & operations would be benefiting from a weakening US-Dollar.
You can see in the Weekly chart where USDX is coming down into an area of Support on the Weekly chart & my feeling is that it will start to turnaround this coming week as its very oversold. But of-course if I may hedge my bets a bit, the path of least-resistance is down as it's well under important moving averages, but a reversal is imminent is my feeling.
* Trading/Investing in precious metals, currency's, commodities & stocks is risky. Please don't rely solely on my financial advice.
Supportzones

Buyback Watch for Swing TradingEarnings are over so buybacks are back in the mix. The market is likely to continue to be volatile and choppy until all the ETF investors who want to sell have done so. Then, the uptrend is likely to resume because there are not enough barometers warning of a recession AND we just had one 3 years ago.
Buybacks tend to drive price up, so they are a good swing and momentum trading strategy. Notice how neatly the support from previous highs halted the run down. Reversal points at strong support levels are one area to watch for buyback patterns.

PARAS DEFENCE Getting Support @ Previous ALL Time HighNSE:PARAS
Positive factors – The outlook will be revised to Stable if the company demonstrates a material improvement in its working
capital cycle and liquidity position, along with improvement in earnings and scale of operations.
Healthy order book provides medium-term revenue visibility – The company’s fresh order inflows over the past four fiscals
remained adequate, with orders worth ~Rs. 621 crore added in the last 21 months ending December 31, 2023.
The pending order book of Rs. 526.3 crore as on December 31, 2023 (OB/OI ratio of 2.4 times of the OI in FY2023) provides medium-term
revenue visibility.
Comfortable capital structure and healthy coverage indicators – The company’s capital structure remains comfortable with
TOL/TNW of 0.3 times as on September 30, 2023, supported by equity infusion of Rs. 162.3 crore during FY2021-FY2022 and
low debt levels.
The interest coverage stood at 12.2 times in 9M FY2024 due to the limited dependence on external borrowings
to fund its working capital. Going forward, ICRA expects the coverage indicators to remain comfortable, benefitting from the
scale-up in operations, given the strong order pipeline.
Extensive experience of management team – PDSTL’s promoters have more than three decades of experience in designing,
developing and manufacturing a wide range of engineering products and solutions for the defense and space sector in the
domain of optics, heavy engineering and electronics. Its long presence in the defence and space sector has helped to establish
strong relationships with its customers as well as suppliers. It has developed a strong management and execution team
comprising several ex-employees of BEL and DRDO, among others.
High working capital intensity due to elongated receivables cycle – The business is working capital intensive with NWC/OI of
88.3% and 114.8% in FY2023 and H1 FY2024, respectively, owing to the high inventory holding period and long receivables
cycle.
The inventory levels are high because of additional stocking of critical raw materials to avoid any disruption in the
delivery schedules and high work-in-progress due to elongated manufacturing cycle.
PDSTL has been partly managing its
working capital cycle by stretching its trade payables by more than three months as it has a longstanding relationship with
most of its suppliers and availing mobilisation advance for part orders. Going forward, the company’s ability to alleviate its
working capital intensity while scaling up its revenues and improving its operating margins will be the key rating monitorable.
Moderate scale of operations – Though the company reported a robust YoY revenue growth of 21% and 10% in FY2023 and
9M FY2024, respectively, supported by healthy order book and the timely execution of orders, the scale of operations still
remains moderate. Given the Government’s thrust on ‘Make in India’ in the defence sector, PDSTL has been mainly catering
to domestic demand (~84% of OI contributed by domestic orders in FY2023). Driven by the healthy order book status, ICRA
expects the company to sustain its revenue growth in FY2024 and FY2025.
High customer concentration risk, though largely mitigated by reputed customer base and repeat orders – The company
faces client concentration risk with top three clients contributing 46% to the total order book as on December 31, 2023 and
top five clients accounting for 51% of the revenue in FY2023. The client profile mostly comprises government organisations
with repeat orders received over the years, largely mitigating the counterparty credit risk. A major part of PDSTL’s clientele
included reputed government organisations, namely Laboratory for Electro-Optics Systems (a unit of ISRO), BEL, Instruments
Research and Development Establishment (a unit of DRDO) and private companies like RRP S4E Innovation Private Limited and
Unifab Engineering Project Private Limited. The company has long standing relationships with most of its clientele. PDSTL also
exports to companies based in Israel, Singapore and USA.

BNB/USDT 1D Long TimeBNB is fighting to break out of the falling channel on top, it is currently struggling with the upper limit of a specific channel, as you can see, breaking out of the downtrend line with the top gave a strong upward signal.
Resistance lines are visible just above the upper border of the downtrend channel, while the next significant resistance levels are $666 and $724.
However, if the price is rejected and we experience declines again, we can see the first support zone from $564 to $544, then we have support at $509, and then the second very strong zone from $486 to $454.

LINK/USDT 1D Hello, I invite everyone to review LINK in pairs to USDT, taking into account the interval of one day. As we can see, the price has moved upwards from the downward trend line.
After unfolding the trend based fib extension grid, we can determine a strong resistance at the level of $14.87, only an upward move can give room for an upward movement towards $15.98, and then we can see resistance at the level of $17.41.
Looking at the second stone, we will similarly determine the support places. However, here there is a strong support zone from $12.54 to $11.30, only a break from this zone may result in a drop to around $9.55.
It is worth looking at the RSI indicator here, which shows a strong movement beyond the upper limit, which translates into a loss of growth power and may change the direction of the price.

Dogecoin - Last buy before +250% pump!CRYPTO:DOGEUSD broke out of another triangle formation and is preparing a major move.
Cycle after cycle after cycle. Dogecoin is definitely one of these assets where you have to look at the higher timeframes; otherwise there is a high risk that you get caught up in short term moves. The trend is clearly bullish and five months ago Dogecoin broke out of a symmetrical triangle formation. We also have a valid break and retest, all indicating a bullish reversal.
Levels to watch: $0.125, $0.359
Keep your long term vision,
Philip - BasicTrading

Tesla - Indecision with the triangleNASDAQ:TSLA has been consolidating for almost 4 years and is definitely ready for a breakout!
+3.300% was the previous rally on Tesla which started back in 2019. But at the moment Tesla is not looking bullish whatsoever, considering that Tesla is trading at the same level as it was about four years ago. However, there is a long term descending triangle formation forming and therefore it is quite likely that we will (soon) see a breakout, either towards the upside or towards the downside.
Levels to watch: $210, $120
Keep your long term vision,
Philip - BasicTrading

IREDA - Head & Shoulder patternAll details are given on chart. If you like the analyses please do share it with your friends, like and follow me for more such interesting charts.
Disc - Am not a SEBI registered analyst. Please do your own analyses before taking position. Details provided on chart is only for educational purposes and not a trading recommendation

EUR-GBPThe eurgbp pair is getting close to an extremely solid parallel support zone, where there is a good likelihood that it will move in a bullish direction similar to the last one. The price has confirmed my prediction over the past three to four times, and it is now heading toward the same area where there is a greater likelihood of a bullish move. Near the zone, we'll be searching for a reversal candle.

USD-CADThe USDCAD creates a support level at 1.36200. There is also a vertical downward trendline that touches three times its trendline, which may drain the market downward. If the market holds this support level then the market goes upward to the trendline. But if the market breaks this support zone then the market goes downward to the 1.35600 level.

USD-CADThe USDCAD creates a support level at 1.36200. There is also a vertical downward trendline that drains the market downward. If the market holds this support level then the market goes upward to the trendline.

Snowflake Ascending Channel bound, with upside potentialHi guys! So always looking for opportunities in repeating patterns/ macro developments.
SNowflake (SNOW) particularly stuck out.
This analysis is conducted in the 1 day timeframe.
Since June 2022, SNOW has been in a Ascending Channel with consistent Higher low prints.
This shows a reoccuring pattern of everytime we've made our way to the bottom of the channel to test Support, we've had bounces to the Upside.
We've had roughly 4 major moves highlighted with returns ranging from 40% to 80%.
We have in April made our way back to test Suppport on this channel.
Currently up roughly 10%.
We are also Above the 21 EMA, maintaining Support.
This is also a reoccuring sign of a rally to the upside.
Currently our 21 EMA is curving to the upside. The rallies that have occured in the past from touching the support line of channel have shown this sign as well.
FOllowed by a Golden cross, where 21 EMA maintains its position above 50 SMA.
Look for this signal to appear.
There is also potential for another test of Support on the lower border of channel. Keep this in mind as it is seen when you look at the previous data.
Remember it is bad practice to trade using a single indicator or tool. Always try to find overlap of signals. Look to updates ont his idea for more evidence to make informed decisions.
__________________________________________________________________________________
Thank you for taking the time to read my analysis. Hope it helped keep you informed. Please do support my ideas by boosting, following me and commenting. Thanks again.
Stay tuned for more updates on SNOW in the near future.
If you have any questions, do reach out. Thank you again.
DISCLAIMER: This is not financial advice, i am not a financial advisor. The thoughts expressed in the posts are my opinion and for educational purposes. Do not use my ideas for the basis of your trading strategy, make sure to work out your own strategy and when trading always spend majority of your time on risk management strategy.

Roku Test with Destiny A 2 year Support trendline A Buy?Hi Guys. So i am always on the lookout for Macro trend setups, signs and opportunities. I believe ROKU is potentially in a position to take a nice swing.
This analysis is on 1 day.
Notice we have reached a Sloping Support trendline from December 2022.
We've had 2 touches previous that resulted in bounces.
Trendline theory states trendlines can stay intact for atleast 3 touch points.
Owing to the idea that our recent touch point is a solid area to take positions. Has a decent probability of a bounce.
On top of that we have the Blue horizontal trendline, which acts as an added layer of Support.
Incase the black trendline does not hold, this would be next lvl.
Stop loss/limit should be placed below trendlines based on risk tolerance. Small positions can have a larger % loss, vise versa.
Now to Support my theory of this buying a solid area to take positions.
I have 3 indicators.
RSI which is in Oversold conditions after 3+ months.
On top of that the momentum indicators MACD and STOCH. Are also oversold.
MACD is signaling a waning bearish momentum. As seen by the light red histobar prints.
We are looking for and eventually should see Green bars and a bullish cross. Which can bring in necessary demand we need for bounce.
Also STOCH RSI is below the 20 lvl, but crossing Bullish as we speak.
This must continue and a bullish cross ABOVE 20 lvl, will also bring in demand and help with bounce.
If we see bullish changes in the momentum indicaotrs, i believe there would be a even higher probability of prices bouncing.
So pay attention, be diligent and manage risk accordingly.
__________________________________________________________________________________
Thank you for taking the time to read my analysis. Hope it helped keep you informed. Please do support my ideas by boosting, following me and commenting. Thanks again.
Stay tuned for more updates on ROKU in the near future.
If you have any questions, do reach out. Thank you again.
DISCLAIMER: This is not financial advice, i am not a financial advisor. The thoughts expressed in the posts are my opinion and for educational purposes. Do not use my ideas for the basis of your trading strategy, make sure to work out your own strategy and when trading always spend majority of your time on risk management strategy.

Bitcoin (btcusd)The bitcoin price moves in the consolidation zone. The ATH resistance level is 73000-73800 and the support level zone is 60000-61000. If the market breaks this ranging zone and goes further upside then the market creates a new all-time high. but, if the market breaks the support level then go downward to order blocker which is 50500-51500 zone.

How far can the price of BTC go ?The chart shows the levels to which the BTC price may drop in the coming days/weeks.
Currently, we can see that the price is based on the support at the 0.382fib level at the price of $60,000. I further identified a strong support zone from $55,000 to $52,000, which is between 0.382fib and 0.618fib, taking into account two fib retracement grids and trend-based fib extension.
The third place is the second very strong zone from $43,487 to $38,591, located between the 0.618fib and 1fib levels of the previously mentioned fib grids.
When we look at the RSI indicator, we will see a break at the bottom from the trend line, under which there is room to continue the downward trend. However, the STOCH indicator shows a descent below the lower limit, which previously resulted in a change of movement path, which in this case may return the price to the upward trend.
Currently, the correction level reaches 18%, which is a relatively small decrease compared to the earlier stages of the growth market. However, here I do not expect a descent below the first support zone, at which the correction would be around 30%.

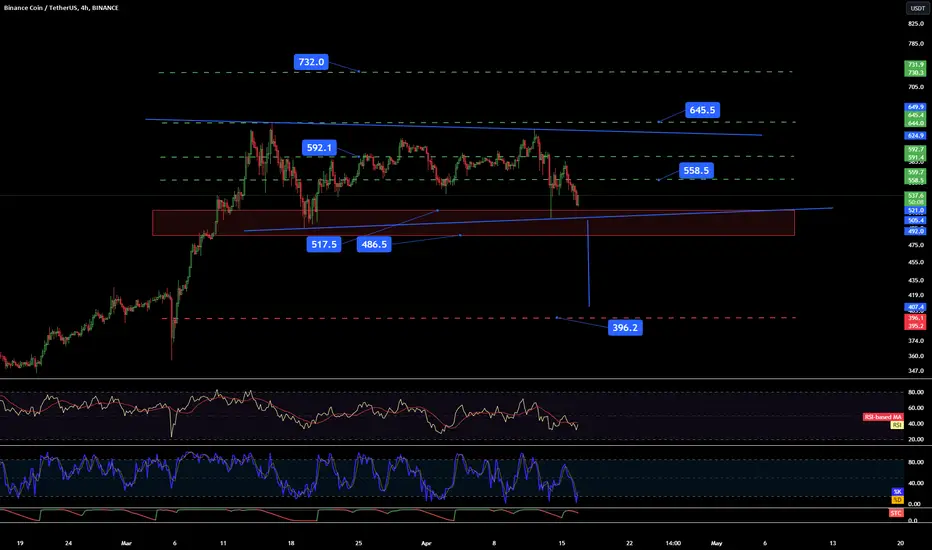
BNB/USDT 4HInterval ChartHello everyone, let's look at the 4H BNB to USDT chart, as we can see the price is approaching the lower border of the horizontal trend channel, which is located in the support zone from $517 to $486, while a break from the bottom of the channel and a drop below this zone can give a strong downward movement towards the support level of $396.
Looking the other way, if the declines were stopped, the price has several significant resistance levels. And here you can see the first resistance at $558, then the second one at $592, the third one at the last peak at $645, and then you can see the way towards $732.
Looking at the RSI indicator, there is still room for a greater recovery, while the STOCH indicator indicates that the lower limit has been exceeded and confirms the current price rebound.
Bitcoin ETF: Sideways Action to Pattern Out Excessive GainsProbably the most popular Stock Exchange Traded Bitcoin Trust at this time, AMEX:GBTC has started a consolidation that may turn into a small triangle formation. Triangles are a form of a consolidation that can work to pattern out excessive price gains without a run or correction down.
This is the weekly chart where we can see that GBTC is now above its previous all-time highs. It is still affordable and poses less risk than the actual Bitcoin, which is very expensive.

XAU-USD (GOLD)A stronger US dollar and fewer worries about inflation caused gold to retreat after hitting a record of 2431.
Market volatility is caused by geopolitical tensions between Iran and Israel, which initially increases demand for safe havens. Fed officials' remarks that strengthen the US dollar work against the price of gold. Fed rate cut bets and bullish USD seem to have little impact on the current upswing. Given how near the daily support is, there's a greater likelihood that the price may pick up additional positive momentum in preparation for the new high. And the market has a strong 4h support level at the 2330-2320 zone that is mentioned in the chart.

GBP-USDThe gbpusd pair breaks his support level which is 1.25200. The market creates a higher low structure. Daily candle body closed below the 1.2500 level, the market gave some retracement and then downward to the 1.2200 level which is an order blocker. If there is no stop then the higher support and demand area is 1.2100.

EUR-USDThe eurusd pair broke out his high support level which is 1.07500. And close the wick below this level. So, the market gives some retracement and moves downward to the 1.0500 support level.

Americas Car Mart Testing Multi-Year Demand Zone (Buy Zone)Hi guys!
This is a MACRO Analysis on AMericas Car Mart (CRMT). Macro meaning larger timeframe aka the 2 week in this instance.
Macro moves tend to speak louder than smaller timeframes like the 1 day for example when they start to move in price.
I believe CRMT has come to an important area and poses a great trade setup in my opinion.
If we look to Price action.
Notice 2 Support trendlines outlined. These are MULTI Year Support zones.
When price reached the trendlines, we ended up bouncing UP.
Notice our current price indicated by Orange box.
Our 2 support trendlines have converged. When 2 support trendlines meet it strengthens the Support.
Also notice the 21 EMA (Purple moving average) -> We have been below this since Septemberish of 2023. Moves below 21 EMA especially on the 2 week pose for good Buy zones as well.
So the combination of converging Support lines and being below 21 EMA = Good area to take positions
Now notice the 2 indicators ive included. These are momentum indicators.
STOCH RSI has crossed BULLISH. (where blue line moves above orange line)
Momentum can pick up and start a move up once this crosses ABOVE the 20 lvl.
MACD is currently below the 0 lvl. With the histogram bars changing from dark red to light red. This indicates a waning of bearish momentum. It is also attempting to create a higher low. All good signs. Look for a Bullish cross and green bars to show up. That will help drive prices up.
A cross ABOVE 0 lvl would bring about massive moves up.
Continue to monitor the indicators and price to stay above the Support zone indicated.
__________________________________________________________________________________
Thank you for taking the time to read my analysis. Hope it helped keep you informed. Please do support my ideas by boosting, following me and commenting. Thanks again.
Stay tuned for more updates on CRMT in the near future.
If you have any questions, do reach out. Thank you again.
DISCLAIMER: This is not financial advice, i am not a financial advisor. The thoughts expressed in the posts are my opinion and for educational purposes. Do not use my ideas for the basis of your trading strategy, make sure to work out your own strategy and when trading always spend majority of your time on risk management strategy.

Just A View - SBICARD📊 Script: SBICARD
📊 Sector: Finance
📊 Industry: Finance & Investments
Key highlights: 💡⚡
📈 Script is trading near it's support level.
📈 We may see some good rally into this stock.
📈 One can go for Swing Trade.
⏱️ C.M.P 📑💰- 730
🟢 Target 🎯🏆 - 778
⚠️ Stoploss ☠️🚫 - 712
⚠️ Important: Always maintain your Risk & Reward Ratio.
✅Like and follow to never miss a new idea!✅
Disclaimer: I am not SEBI Registered Advisor. My posts are purely for training and educational purposes.
Eat🍜 Sleep😴 TradingView📈 Repeat 🔁
Happy learning with trading. Cheers!🥂

BNB/USDT 4HInterval Support and ResistanceHello everyone, let's look at the 4H BNB to USDT chart as we can see that the price has broken out of the local uptrend line.
Let's start by setting goals for the near future that we can include:
T1 = $575
T2 = $618
T3 = $649
AND
T4 = $689
Now let's move on to the stop-loss in case of further market declines:
SL1 = $512
SL2 = $484 - $469
AND
SL3 = $425
Looking at the RSI indicator, we can see that we have again approached the downward trend line and there is still a lot of room for recovery, while the STOCH indicator, despite the current rebound, also has a lot of room for recovery.
