Will XRP change the trend to an upward trend?Hello, we are reviewing the XRP to USDT chart over the one day timeframe looking at the long run.
It makes sense to designate two channels, yellow lines for the uptrend channel and blue lines for the downtrend channel we are currently in. Price behavior that moves from the bottom to the top of the channel can be used for short-term licks.
It is worth noting that we are currently in the lower part of the channel and in the support zone. Looking at the price of XRP in the long term, it is worth setting two resistance zones that we have to overcome in the future, the first is from $ 0.682 to $ 0.947, while the second is from $ 1.33 to $ 1.62.
Note the CHOP indicator, which shows that we have a lot of energy on the 1-day interval, and the MACD indicator shows that the blue line is very close to the intersection of the red line from the bottom, which would confirm the upward trend shift.
Supportzones

ADAUSDT price chart reviewHi everyone
Let's take a look at the ADAUSDT chart on the one-day timeframe. As you can see in the long run, the ADA is moving in the downward channel marked with yellow lines, while in the short run we are moving in the local upward channel marked with blue lines.
It's worth setting a support zone with the price in front of you from $ 0.409 to $ 0.226
and
resistance zones, and in this case it is worthwhile to determine two:
- first resistance zone from $ 1.054 to $ 1.44
- second resistance zone from $ 2,081 to $ 2,544
Looking at the 1-day interval on the CHOP indicator, we can see that we still have a lot of energy for the next move, and the MACD indicator confirms the local upward trend.

SHIB / USDT on 1Day IntervalHi everyone,
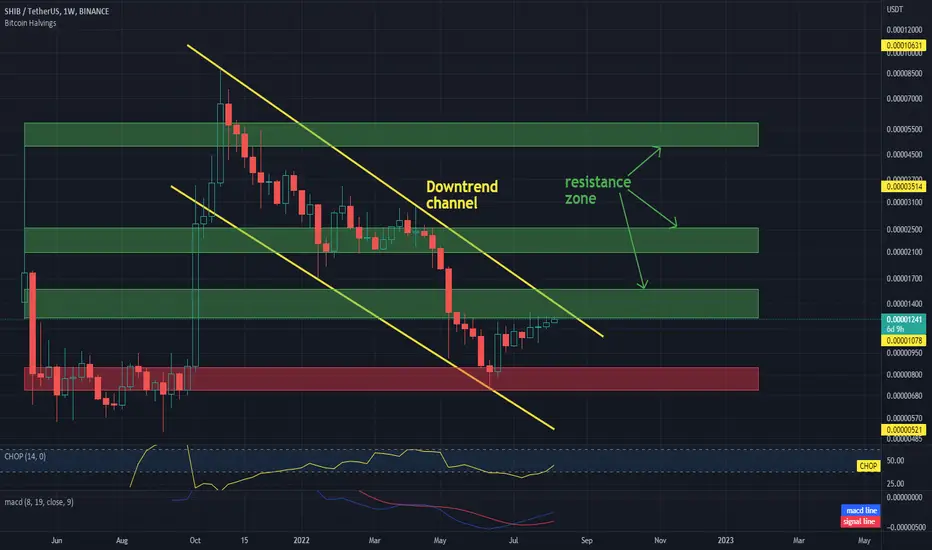
Let's take a look at the SHIBUSDT chart on the 1 day time frame.
As you can see, we are moving in the downtrend channel marked with yellow lines.
It is worth setting a support zone from which the SHIB price has rebounded, and 3 important resistance zones that the price has in front of it. We are currently fighting the first one from $ 0.00001245 to $ 0.00001567. However, it should be taken into account that in order to break the first resistance zone, we have to leave the downward channel upwards and change the trend in the long term.
The CHOP indicator shows that we are starting to gain more and more energy and the MACD indicator shows a local upward trend.
Review of the SOL situation on a 1-day intervalHi everyone,
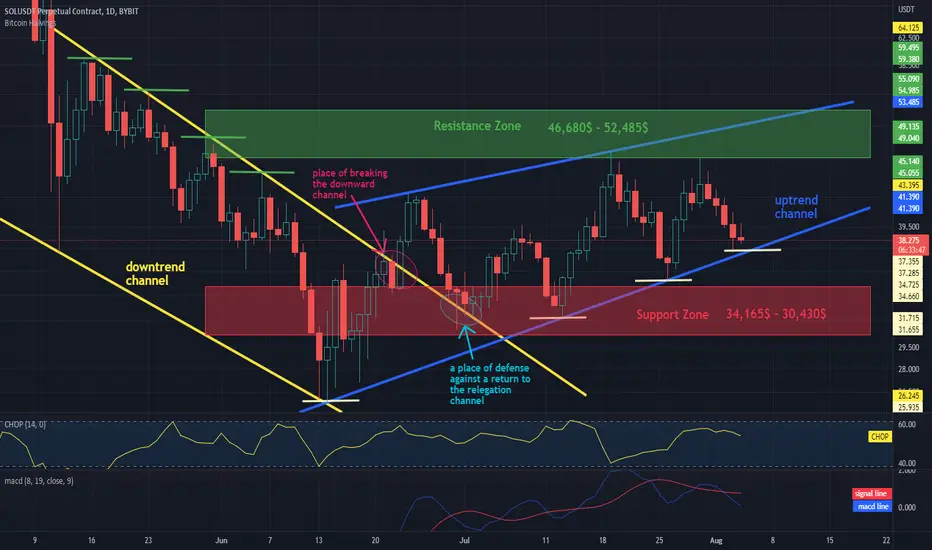
Let's take a look at the SOLUSDT chart on the 1 day time frame.
What is striking in the foreground are two channels:
- the downtrend channel marked with yellow lines
and
- the uptrend channel marked with blue lines
Then, expressively, we can notice the place where the downward trend breaks and the point of defense of the upward trend change in which we are currently.
It is also worth designating support and resistance zones, and so we can see that the support zone is from $ 34,165 to $ 30,430, and the resistance zone is from $ 46.680 to $ 52,485.
Going further, we should pay attention to the behavior of the price, which moves nicely from the upper to the lower limit of the channel, which can potentially be used in short-term games with appropriately selected stoplots.
Remember these are my thoughts and this is not an investment advice :)
CAD/CHF (Support Zone)Good Support Zone! FX:CADCHF
Multiple time pullback from this zone show significance of this area.
Best of luck!


WK-06 (XAU/USD)Gold at its potential support area RN!
Take trade with a good candle stick pattern!
go for short if it brakes this zone!
go for long if makes a good bullish pattern at its support!

GBPAUD Long from supply zoneI expect growth from this support zone.
Entry: 1.7362
SL: 1.7309
TP: 1.76956

US OIL analyzehello everybody.
according to the technical analyze we can see the terminal trend in US oil.
and i think the trend in 1D timeframe become weak and i see a correction potential for that.
after we break out of disjoint channel that i draw on my chart we could have a pullback and after that
go down.
the first target for swing traders is around 93 94
and we can see a strengh support around 85-90 area like i illustrate in chart.
PCC(point of control)is in this area and we have the MA200 here too.
in addition longterm trendline is around this condition.
so we have 3 important levels and support in this area (85-90).
our momentum is in overbought level and going downward.
dont forget to put stoploss above the last major high.
(NOTE:friends this is my personal opinion and its not a trade suggestion.
please analyze in your own strategy and help me be better)
thank you all.

RELIANCE - Bullish trendRELIANCE - Bullish trend
1. have good support at 2540
2. Now in a small downtrend, Looks like it will move upwards If the market trend reverses before it crosses 2540.
3. If the downtrend continues another support at 2420.
4. First target will be 2800 if the market reverse.
Note:
1. I’m not a SEBI Registered advisor, my views are personal and for educational purposes only.
2. Always check with your financial advisor and take the trade as per your risk/reward ratio.
3. Follow me for more patterns and like, and share so that we feel it is helpful to many and share more patterns...

HDFC BANK - Trend Analysis for InvestmentHDFC BANK - Trend Analysis for long term Investors
1. Golden ratio at 1110, It's a golden apportionment for the invertors to accumulate at this level.
2. It's not yet broken the 1st support at 1290.
3. Based on the NIFTY BANK weakness, the upcoming week will be more pressure on this bank.
4. Next support zones are 1275,1175 and 1110 respectively.
5. FII Slightly reduces the percentage of holdings for a couple of quarters, but at below 1100, they will start accumulating.
Note:
1. I’m not a SEBI Registered advisor, my research is personal and for educational purposes only.
2. Always check with your financial advisor and take the trade as per your risk/reward ratio.
3. Follow me for more patterns and like, and share so that we feel it is helpful to many and share more patterns...

NIFTY METAL - Bearish zoneNIFTY METAL - Bearish zone
1. It breaks the 1st support zone 4830 on the downside this week.
2. In a bear trap, the next support will be at 4490, and 4200 respectively.
3. Till it gets support most of the metal sector will be in a downtrend in upcoming weeks.
4. Example: TATA Steel will be on a more downtrend in upcoming weeks.
Note:
1. I’m not a SEBI Registered advisor, my research is personal and for educational purposes only.
2. Always check with your financial advisor and take the trade as per your risk/reward ratio.
3. Follow me for more patterns and like, and share so that we feel it is helpful to many and share more patterns...

DXY reversal? Positive signs for the marketDXY is touching the top of a multi-year parallel channel on the monthly chart, whilst also displaying bearish divergence on the RSI. This, to me, signifies at least a small reversal over the next couple of months. This should be buillish for stocks and crypto, which are all reaching significant levels of support at the same time. There is a lot of fear in the market, and blood on the streets (at least in crypto), so I am buying in here for a swing trade.
BTC:
SPY:
QQQ:

ETH stays in the support zoneHello everyone, let's take a look at the ETH to USDT 1 day chart. As you can see, the price is moving below the downtrend line.
Let's start with determining the support line and as you can see the support that should be taken into account is the support zone from $ 1856 to $ 1694 in which the price is currently located.
Now let's move from the resistance line as you can see the first resistance is $ 2,153, if you can break it the next resistance will be $ 2,426 and $ 2,649.
Looking at the CHOP indicator, we can see that on the 1-day interval we have a lot of energy to make a move, while the MACD indicator shows an upward trend.

The infamous Trend Reversal Trade The Trend Reversal Trade, can it work? I have been trading the market for 10 years & the statistics in NOT in your favour, this type of trade has a low probability & trading is a game of stacking the probabilities in your favour. this is to be distinguished from investing; which is a whole different game.
Back to the infamous Trend Reversal Trade. This is the trade where most average home managed investors loose their money.
Lets put this into practice. Imagine following: A good name stock price is over
selling or maybe crashing with over balanced selling right into a demand zone. like WEED in this example on a (W) chart.
The investor buys a LNG position & thinking he purchased a Good company stock for a good price,
isnt that what balance & income sheet based fundamental trading teaches.
Now, all one have to do is wait for the trend to reverse price goes up & big profit. expect that a big pay off does not come, hope is mislead by a bounce in price due to the demand zone. before the prevailing trend continues its down fall beyond your ENTR price, the emotions kicks in & you are in the red profit zone.wtf.. I hope you had a stop loss in place. If you are following me those far, those trades are dangerous..learn from my many mistakes..Fuc*king Hope
What was my mistake? expecting a DZ to reverse the dominant trend & while this does frequently happen, and it is how market is created. but the futility is in the assumption that you can gauge the top or the bottom before the trend changes. I learned to wait for the trend to change without me then i ride the new trend. much like surfing a wave. ride the wave & trade the trend.

2020/5/20 11:30am XAU/USD analysePivot Point: 1834
Currently: Consolidating at this 1848.00 level , its next support zone is at 1856.00
Reaction: Resisted at 1817.00 and retraced back to 1807.00
I just started sharing my daily technical analysis of Metals & Forex Market with my indicators on tradingview~ Wish to receive some feedbacks from you! 😊
Btw you can feel free to use our designed indicators!!! Just lemme know if you want it! Follow & like our posts to support us😎! Can’t wait to chat with you more~

Support and resistance levels for Bitcoin 17 May 2022BYBIT:BTCUSD These are the most Current Daily, Weekly and Monthly Levels for Bitcoin.
Support and resistance Definition (quoted from Investopedia.com)
The concepts of trading level support and resistance are undoubtedly two of the most highly discussed attributes of technical analysis. Part of analyzing chart patterns, these terms are used by traders to refer to price levels on charts that tend to act as barriers, preventing the price of an asset from getting pushed in a certain direction.
At first, the explanation and idea behind identifying these levels seem easy, but as you'll find out, support and resistance can come in various forms, and the concept is more difficult to master than it first appears.
Key Takeaways
Technical analysts use support and resistance levels to identify price points on a chart where the probabilities favor a pause or reversal of a prevailing trend.
Support occurs where a downtrend is expected to pause due to a concentration of demand.
Resistance occurs where an uptrend is expected to pause temporarily, due to a concentration of supply.
Market psychology plays a major role as traders and investors remember the past and react to changing conditions to anticipate future market movement.
Support and resistance areas can be identified on charts using trendlines and moving averages.
(end of quote)
Trading based on these levels, I would suggest entering trades based on a sign of strength (Long) or weakness (short) at these levels.
Never use Levels on their own, but enter trades based on confluence - i.e. Chart patterns, order flow, indicators, market structure

AUDUSD SELL!AUDUSD has been trading inside the given parallel channel since February 2021 . Recently, the price succeeded to break through a significant support 0.69865 , went back retested it and is now ready to move down all the way to a significant support on monthly Chart 0.68709, which would be my final Target . the downward move is further confirmed by the price trading below the 200 and 50 EMA !

MTLUSDT Wants the demand zoneThe price is creating a falling wedge on 4h timeframe and now the market is testing the support. We could see a new bearish impulse until 1.5.
How to approach it?
IF the price is going to lose the support, According to Plancton's strategy , we can set a nice order
–––––
Keep in mind.
🟣 Purple structure -> Monthly structure.
🔴 Red structure -> Weekly structure.
🔵 Blue structure -> Daily structure.
🟡 Yellow structure -> 4h structure.
–––––
Follow the Shrimp 🦐

Will ETH use energy to reverse the trend?Hello everyone, let's take a look at the ETH to USDT 1 week chart. As you can see, the price has dropped below the uptrend channel.
Let's start with the line of support and as you can see the first support in the near future is $ 2155, then we have a fundamental support zone from $ 1856 to $ 1694.
Now let's move from the resistance line as you can see the first resistance is $ 2,811, if you can break it the next resistance will be $ 3,195 and $ 3,528.
Looking at the CHOP indicator, we can see that in the interval of 1 week, despite the correction, we have a lot of energy.

Bitcoin VOLUME levels - this is NOT a free fallHey fellow traders,
just a reminder to see the big picture... Look at the historical trading volume which is below us (actual price 38,5k atm) and the number of supports from them... Now imagine how much of a sell effort would that be to break all of them? Is it realistic? I feel NOT.
Let's wait what FED will have for us next week, how the markets will react and if Dollar index would bump back off the historical resistance...
GL&HF
Cryptovlcoun

CAD/CHF: Buy i the reaction zoneCanadian Dollar/Swiss Franx show up a good moment to buy in the key supoort around $0.7500 CHF
I buy in the market price and put my Sl to 0.7460 CHF and target to $0.7585 °CHF
Re.ember CAD it's bullish as I sae from Sunday when i made an analysia of this par.

GOLD what is next 💡Based on the chart, the price is close to vital support area ($1920) and our important trend line and resistance area are located on the chart ✔️
if
the price stays above this support zone ($1920) we will see more gain, at least to $1960 🚀
and if
the price breaks the support area to the downside, we will see correction to lower price 📖💡
Please, feel free to ask your question, write it in the comments below, and I will answer.🐋
