XAU/USD Intraday Plan | Support & Resistance to WatchGold remains in a bullish structure after breaking above the $3,348 level late last week. Price has since advanced into the $3,368–$3,387 resistance zone and is currently consolidating just beneath $3,387.
A clean break and hold above $3,387 would open the path toward the next upside level at $3,422, with $3,445 as the higher target above.
If price rejects here, watch for a pullback into the $3,358–$3,344 zone. This area is now acting as the first support, backed by the rising 50MA which may act as dynamic support. If buyers fail to hold that zone, focus shifts to the $3,329–$3,313 pullback zone — a deeper support where the 200MA is also positioned, adding confluence.
Failure to hold that area would open the door to a drop into the Secondary Support Zone around $3,295–$3,281, followed by the HTF Support Zone at $3,229–$3,208 if bearish pressure accelerates.
📌 Key Levels to Watch
Resistance:
‣ $3,387 ‣ $3,422 ‣ $3,445
Support:
‣ $3,358 ‣ $3,344 ‣ $3,329 ‣ $3,313 ‣ $3,295 ‣ $3,281 ‣ $3,254
🔎Fundamental Focus:
Today’s key event: ISM Services PMI (4:00pm) – high-impact for USD and gold volatility.
Earlier data (Trade Balance, PMI) may cause intraday spikes.
⚠️ Risk Reminder:
Avoid chasing. Let price react, then confirm. Stay sharp around news.
Suppportandresistance
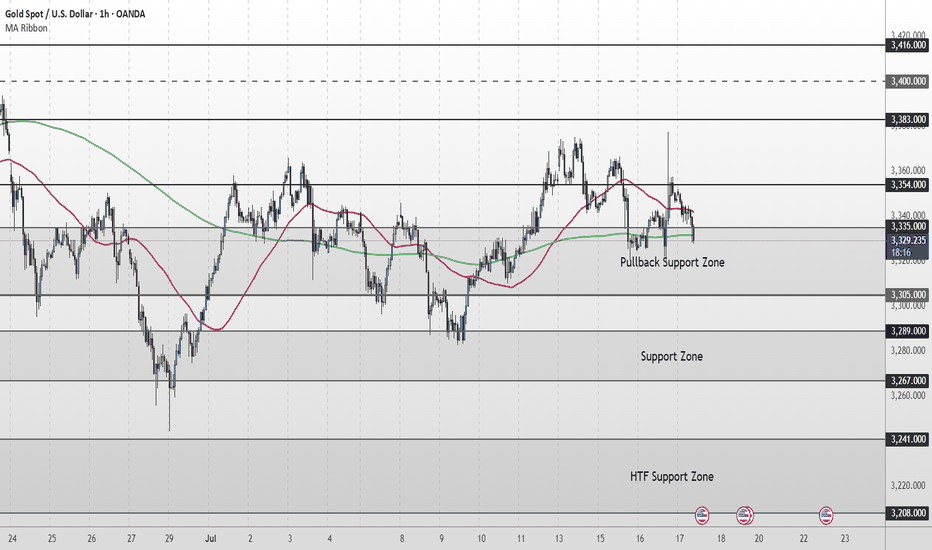
Gold Short Term OutlookYesterday, gold staged a strong rally, pushing up toward 3,377, which was followed by a strong rejection. Price has pulled back sharply and is now testing the Pullback Zone once again.
Currently trading around 3,329, price is caught between the 50MA overhead acting as dynamic resistance and the 200MA below offering dynamic support.
For the bullish structure to regain momentum, we need to see a clean break and hold back above 3,354. This would reopen the path toward 3,383 and 3,400, with 3,416 as a higher‑timeframe target.
If buyers fail to defend the Pullback Support Zone, and price breaks decisively below 3,305, attention shifts to the Support Zone (3,289–3,267). A deeper selloff could then expose the HTF Support Zone (3,241–3,208).
📌 Key Levels to Watch
Resistance:
‣ 3,354
‣ 3,383
‣ 3,400
‣ 3,416
Support:
‣ 3,335
‣ 3,305
‣ 3,289
‣ 3,267
‣ 3,241
🔎 Fundamental Focus – High‑Impact U.S. Data Today
A packed U.S. calendar could drive volatility:
📌Core Retail Sales m/m and Retail Sales m/m
📌Unemployment Claims
📌Philly Fed Manufacturing Index
These red‑folder releases can create sharp intraday swings.
Additionally, multiple FOMC member speeches later in the session could add headline‑driven moves.
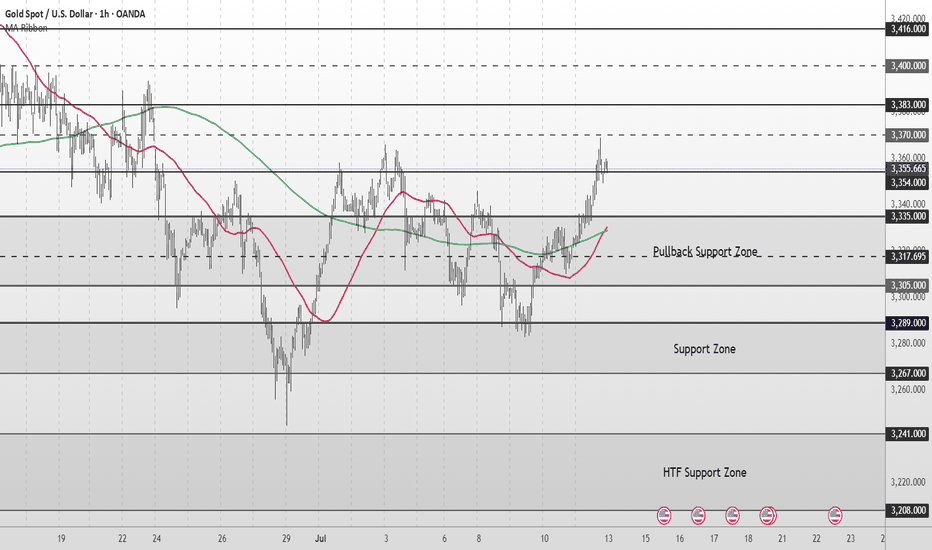
Gold Medium to Short Term Outlook Gold has shifted into a bullish structure after reclaiming key technical levels.
The strong impulsive move from below $3,300 into the $3,354–$3,370 resistance area reflects renewed buying interest, likely driven by improving sentiment and shifting macroeconomic expectations.
If bulls maintain control and price breaks and holds above $3,354, we could see continuation toward $3,383 and $3,400, with $3,416 marking the next major higher-timeframe resistance. These levels will be critical in determining whether gold resumes a broader bullish trend or begins to stall into a deeper correction.
On the flip side, if gold begins to fade below $3,354, then the $3,335–$3,305 pullback support zone will be key for potential bullish re-entry attempts.
A sustained break below this area would invalidate the current bullish leg and expose the market to a deeper retracement toward $3,289–$3,267, with $3,241–$3,208 acting as the higher-timeframe support floor.
📌 Key Levels to Watch
Resistance
‣ $3,370
‣ $3,383
‣ $3,400
‣ $3,416
Support
‣ $3,335
‣ $3,305
‣ $3,289
‣ $3,267
‣ $3,241
‣ $3,208
🔎 Fundamental Focus
Multiple high-impact U.S. data releases this week, including CPI, PPI, Retail Sales, and Unemployment Claims.
Expect elevated volatility across sessions.
⚠️ Manage your risk around news times. Stay sharp.
ETH Retesting Breakdown – More Pain Ahead?ETH/USDT has been trading within a broad range of approximately $2,000, consolidating after a long uptrend.
However, the price has broken down below the ascending trendline and is now retesting this breakdown, just above a key support zone.
This retest is crucial in determining whether ETH will confirm further downside or reclaim the trendline.
RUNE/USDT Testing Critical Support – What's Next?RUNE/USDT depicts a bearish breakdown from a rising channel pattern. The price is currently hovering near the critical support zone around $4.20 to $4.50.
If this key support fails to hold, we could see a continuation of the downward momentum, targeting levels near $3.50 or lower.
However, a temporary consolidation near the support zone cannot be ruled out before the next decisive move.
DYOR, NFA
gold simple level before big cpi newsgold price again flying on the news of china central bank gold buying since monday market open
while market totally ignored strong nfp, rising cpi number and overheating financial market
if white line and yellow horizontal level both at same place breakout at the same time
technically it will be big bullish signal and investors will buy more
if fail to breakout than sideway range correction can continue until fomc
BALAMINES: SUPPORT & RESISTANCE TRADINGBalaji Amines has been trading in a consolidating zone for an extended period, oscillating between well-defined support and resistance levels. This range-bound behavior reflects a lack of decisive directional movement, but also offers an excellent opportunity for range-based trading strategies.
Technical Analysis:
The stock has recently touched its support level for the 7th time, indicating a strong demand zone at this level.
The repeated testing of support without a significant breakdown strengthens the case for a potential bounce.
Key support: ₹ 1990-2000
Key resistance: ₹ 2441-2550
Trade Setup:
Entry: Near the support level around ₹1990-2000.
Target: ₹2441-2550, the upper boundary of the consolidation range.
Stop Loss: Below the support level, to minimize risk if the support fails.
Disclaimer: This analysis is for educational purposes only. Conduct thorough research or consult a financial advisor before making trading decisions.
USDJPY - 2nd chance sharing opportunityI believe the BOJ conducted its second FX intervention yesterday. As the market retested the sell zone, I shorted this pair and placed Stops at 156.82, which is a good 58 pips of initial risk.
Once the market reaches 155.78, I'll shift my stops to the entry-level. This would prevent any losses incurred by hectic volatile movement.
If all goes well, my 1st target would be at 154.85 and I'll keep my second target open.
What are your thoughts on this?
AAPL Update: Log Chart Reveals Key Levels and CluesPrimary Chart: Parallel Channel Defining Downtrend from All-Time High, Uptrend Line from Covid Lows Through June 2022 Low, Fibonacci Levels
AAPL's logarithmic chart reveals some interesting technical facts that are not as apparent on a linear / arithmetic chart.
1. AAPL remains in a trading range. This range developed and persisted over the past month. The top of the range is about $157 and the bottom of the range is about $134 (lows on October 13, 2022). The breakout of this range may determine the next multi-week trend leg in AAPL.
Supplementary Chart: 65m Chart Showing Chop Range for AAPL over Past Month
2. Uptrend Line from March 2020 through June 2022. First, consider the uptrend line (light blue) from the Covid 2020 lows that connects through the June 2022 low. On October 12, 2022, SquishTrade discussed this trendline, showing it on both linear and logarithmic charts. This TL formed the lower boundary of a very large multi-month triangle. SquishTrade's previous AAPL post forecasted whipsaws around this trendline stating on October 12, 2022 as follows:
"But when multi-month triangles like this break, and when multi-year trendlines like this break, it should be expected this could be a process rather than a quick event, assuming the trendline is valid. In part, this is because multi-year trendlines and multi-month triangles do not break and dissipate easily. The lower trendline of the triangle pattern is a multi-year trendline from the Covid lows to the present. Price does not always just break right through such an important level. On occasion, it can slice right through a level deemed consequential and long-term. But often when encountering a very important longer-term level, price can tag it, then break it repeatedly in both directions, whipsawing above and below the line a few times before following the ultimate direction it will take. Or it can break the line and then retest it from underneath a couple times as well."
On the Primary Chart for October 12, 2022, SquishTrade stated: "watch for a retest or whipsaw moves around this line."
The expected whipsaw has occurred to an even greater degree than was expected. Notice on today's Primary Chart the black line showing seven breakouts above and below the line. Price has been whipsawing back and forth around this TL for more than four weeks (since September 29, 2022).
On the log chart, price seems to be making progress, however, back to the downside. But with the long lower wick on the candle for November 4, 2022, one might expect yet another retest or whipsaw before moving lower. If AAPL were to retest this TL, the retest would be at approximately 152.70 if it were to occur next week—the line slopes, so the retest resistance level increases with each day that passes.
3. Major Support and Target Areas in the $128-$131 range . The immediate support zone arises at the base of the parallel channel, currently at $130-$131. The VWAP anchored to the 2020 low lies around $128.03 over the next few days. SquishTrade forecasts that AAPL will reach $128-$131 within the coming weeks or couple months though this will not likely happen in a straight line given the choppy price action in both AAPL and equity indices like SPX and NDX. This $128-131 level shows confluence with the YTD price low at $129.04 as well as a key Fibonacci level at $133.
4. Major Support and Target Areas in the $114 to $122 range. If this $128-131 target is reached and violated to the downside, then further downside targets will be considered as viable and effective. The next lower targets are (i) a Fiboancci projection at $122.25, (ii) a long-term Fibonacci retracement at $118.02 (.50 Fib retracement of the 2020-2022 rally on a linear chart), and (iii) another key Fibonacci retracement at $114.07 (.382 Fibonacci retracement of 2020-2022 rally on a logarithmic chart). This area should be considered as a significant support / target zone from $114 to $122.


