Important Support and Resistance Zones: 23.03-28.93
Hello, traders.
If you "Follow", you can always get the latest information quickly.
Have a nice day today.
-------------------------------------
(INTC 1D chart)
It shows an upward trend above the 18.69-21.33 zone, which is a medium- to long-term buy zone.
However, you need to be relaxed because it needs to rise above 28.93 to turn into an uptrend.
The 28.93 point is the HA-Low indicator point on the 1M chart, and it is expected that a breakout trade will be possible when it breaks above this point.
Since the price is located below the M-Signal indicator on the 1M chart, you should respond quickly and briefly with short-term trading while observing the situation.
Therefore, if you were unable to purchase in the mid- to long-term purchase section,
1st: M-Signal indicator on the 1M chart
2nd: 28.93
You can proceed with a purchase when it shows support near the 1st and 2nd above.
If it falls below 18.69, you should stop trading and observe the situation.
-
Thank you for reading to the end.
I hope you have a successful transaction.
--------------------------------------------------
Supprotandresistance

Check if it can hold the price above 26.37
Hello, traders.
If you "Follow", you can always get new information quickly.
Have a nice day today.
-------------------------------------
Hyperliquid token is a decentralized exchange token.
It forms the Hyperliquid Ecosystem.
To see if Hyperliquid can survive in the coin market in the future, we will have to see if the ecosystem expands.
---------------------------------------------
(HYPEUSDT 1D chart)
We need to see if the price can be maintained by rising above the Fibonacci ratio 1 (35.51).
If so, the next target range is expected to be around the Fibonacci ratio 1.618 (51.70).
-
The HA-High indicator on the 1D chart is formed at the 26.37 point.
Therefore, if it falls, we need to check if it is supported near the HA-High indicator on the 1D chart.
The current volume profile section is formed over the 19.59-23.19 section.
Therefore, if it falls to the maximum, it is expected that the 19.59-23.19 section will act as a strong support.
-
(30m chart)
Since the chart was created not long ago, it is difficult to analyze the chart over a long period of time.
Therefore, when trading these coins (tokens), it is recommended to trade mainly in short-term trading (day trading) or increase the number of coins (tokens) corresponding to the profit by increasing the number of coins (tokens).
-
The basic trading strategy is to buy when it receives support near the HA-Low indicator and sell when it meets the HA-High indicator.
However, if it is supported and rises near the HA-High indicator, there is a possibility of a stepwise upward trend, so you should think about how to proceed with a split transaction.
If it is resisted and falls near the HA-Low indicator, there is a possibility of a stepwise downward trend, so you should also think about a response plan for this.
-
In any case, you can see that it must rise above 33.89 to continue the upward trend.
Therefore, the key is whether it can rise with support near 33.17-33.89.
Currently, OBV > OBV EMA, so when it rises above the High Line, you should check whether it can maintain the price by rising above the 33.17-33.89 range.
-
Thank you for reading to the end.
I hope you have a successful transaction.
--------------------------------------------------
- This is an explanation of the big picture.
(3-year bull market, 1-year bear market pattern)
(3-year bull market, 1-year bear market pattern)
I will explain more details when the bear market starts.
------------------------------------------------------

Important section: 101947.24-106133.74
Hello, traders.
If you "Follow", you can always get new information quickly.
Have a nice day today.
-------------------------------------
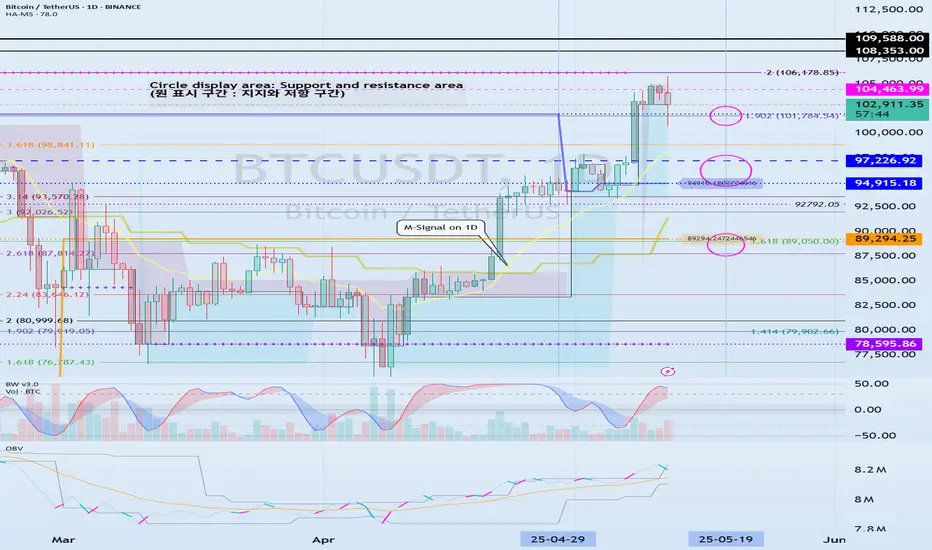
(BTCUSDT 1D chart)
It has touched the Fibonacci ratio 1.902 (101784.54) and is rising.
The key is whether it can receive support near the StochRSI 50 indicator (102971.99) and rise.
If not, it can fall to the 94915.18-97226.92 area.
Since the HA-Low indicator is formed at the 89294.25 point, it is important whether the price can be maintained above that point.
If the StochRSI indicator falls below the overbought range and then rises while moving sideways around the Fibonacci ratio range of 1.902 (101784.54) ~ 2 (106178.85), it is expected to renew the ATH.
Even if it falls more than expected, if it rises along the M-Signal indicator on the 1D chart, it is highly likely to renew the ATH.
----------------------------------------------------------
I will explain the newly added indicators, StochRSI 50, StochRSI 80, and StochRSI 20.
The disadvantage of interpreting the StochRSI indicator added as an auxiliary indicator is that it cannot determine the price movement.
Because of this, when interpreting the StochRSI indicator so far,
- Whether it is in the overbought or oversold zone,
- Whether StochRSI is above or below the 50 point,
we interpreted it as above.
Therefore, we added the price movement to the StochRSI indicator to check the movement more accurately.
-
The StochRSI 50 indicator is literally created when the StochRSI indicator passes the 50 point.
Therefore, we need to think about a response plan based on the price StochRSI 50 indicator.
-
The fact that StochRSI 80 is created means that the StochRSI indicator has risen above 80.
Therefore, in order to continue the upward trend, StochRSI must rise above 80.
If StochRSI 80 is not created and only StochRSI 20 is created, the upward trend will occur when the price is maintained above the StochRSI 50 indicator.
-
The fact that StochRSI 20 was created means that the StochRSI indicator has fallen below 20.
Therefore, in order to continue the downtrend, it must fall below StochRSI 20.
If StochRSI 20 is not created and only StochRSI 80 is created, the downtrend will occur when the price is maintained below the StochRSI 50 indicator.
-
Thank you for reading to the end.
I hope you have a successful trade.
--------------------------------------------------
- This is an explanation of the big picture.
I used TradingView's INDEX chart to check the entire range of BTC.
I rewrote the previous chart to update it by touching the Fibonacci ratio range of 1.902 (101875.70) ~ 2 (106275.10).
(Previous BTCUSD 12M chart)
Looking at the big picture, it seems to have been following a pattern since 2015.
In other words, it is a pattern that maintains a 3-year bull market and faces a 1-year bear market.
Accordingly, the bull market is expected to continue until 2025.
-
(Current BTCUSD 12M chart)
Based on the currently written Fibonacci ratio, it is displayed up to 3.618 (178910.15).
It is expected that it will not fall again below the Fibonacci ratio of 0.618 (44234.54).
(BTCUSDT 12M chart)
I think it is around 42283.58 when looking at the BTCUSDT chart.
-
I will explain it again with the BTCUSD chart.
The Fibonacci ratio ranges marked in the light green boxes, 1.902 (101875.70) ~ 2 (106275.10) and 3 (151166.97) ~ 3.14 (157451.83), are expected to be important support and resistance ranges.
In other words, it seems likely to act as a volume profile range.
Therefore, in order to break through this section upward, I think the point to watch is whether it can rise with support near the Fibonacci ratios of 1.618 (89126.41) and 2.618 (134018.28).
Therefore, the maximum rising section in 2025 is expected to be the 3 (151166.97) ~ 3.14 (157451.83) section.
To do that, we need to look at whether it can rise with support near 2.618 (134018.28).
If it falls after the bull market in 2025, we don't know how far it will fall, but considering the previous decline, we expect it to fall by about -60% to -70%.
So, if the decline starts near the Fibonacci ratio 3.14 (157451.83), it seems likely that it will fall to around Fibonacci 0.618 (44234.54).
I will explain more details when the downtrend starts.
------------------------------------------------------
Support around 148.18 is important
Hello, traders.
If you "Follow", you can always get new information quickly.
Please click "Boost" as well.
Have a nice day today.
-------------------------------------
(SOLUSDT 1D chart)
The OBV Line indicator on the 1M chart is formed at the 148.18 point.
Therefore, the key is whether it can be supported around 148.18 and rise above the M-Signal indicator on the 1W chart.
If not, and it falls, you should check whether it is supported near the M-Signal indicator on the 1M chart.
-
Since the M-Signal indicators of the 1D, 1W, and 1M charts are converging, I think the current location is an important support and resistance zone.
-
If it continues to rise, there is a possibility that it will touch the HA-High indicator point of the 1D chart, which is around 225.0.
However, since the HA-High indicator of the 1M chart is formed at the 179.74 point, we need to see if it can break through this area upward.
-
Since the StochRSI indicator is in the overbought zone, even if it rises further, it will eventually show a downward trend.
We need to create a response strategy by keeping this in mind.
In other words, we need to check whether the price is maintained above the M-Signal indicator of the 1D chart or above the M-Signal indicator of the 1W chart and create a response strategy.
-
Thank you for reading to the end.
I hope you have a successful transaction.
--------------------------------------------------
- Explanation of the big picture.
I used TradingView's INDEX chart to check the entire range of BTC.
I rewrote it to update the previous chart by touching the Fibonacci ratio range of 1.902 (101875.70) ~ 2 (106275.10).
(Previous BTCUSD 12M chart)
Looking at the big picture, it seems to have been maintaining an upward trend following a pattern since 2015.
In other words, it is a pattern that maintains a 3-year upward trend and faces a 1-year downward trend.
Accordingly, the upward trend is expected to continue until 2025.
-
(Current BTCUSD 12M chart)
Based on the currently written Fibonacci ratio, it is displayed up to 3.618 (178910.15).
It is expected that it will not fall again below the Fibonacci ratio of 0.618 (44234.54).
(BTCUSDT 12M chart)
Based on the BTCUSDT chart, I think it is around 42283.58.
-
I will explain it again with the BTCUSD chart.
The Fibonacci ratio ranges marked in the green boxes, 1.902 (101875.70) ~ 2 (106275.10) and 3 (151166.97) ~ 3.14 (157451.83), are expected to be important support and resistance ranges.
In other words, it seems likely that they will act as volume profile ranges.
Therefore, in order to break through these ranges upward, I think the point to watch is whether they can receive support and rise near the Fibonacci ratios of 1.618 (89126.41) and 2.618 (134018.28).
Therefore, the maximum rising range in 2025 is expected to be the 3 (151166.97) ~ 3.14 (157451.83) range.
In order to do that, we need to see if it is supported and rises near 2.618 (134018.28).
If it falls after the bull market in 2025, we don't know how far it will fall, but based on the previous decline, we expect it to fall by about -60% to -70%.
Therefore, if it starts to fall near the Fibonacci ratio 3.14 (157451.83), it seems likely that it will fall to around Fibonacci 0.618 (44234.54).
I will explain more details when the bear market starts.
------------------------------------------------------

Next Volatility Period: Around April 25-29
Hello, traders.
If you "Follow", you can always get new information quickly.
Please click "Boost" as well.
Have a nice day today.
-------------------------------------
(BTCUSDT 1W chart)
The key is whether it can receive support near the OBV Line indicator (84349.94) on the 1M chart and rise above the M-Signal indicator on the 1W chart.
-
(1D chart)
(Movement in a wide range)
If you look at the lines drawn with multiple lines, you can see that it is currently moving sideways within the section that the fingers are pointing to.
It may seem a bit complicated, but the key is in which direction the finger points out.
(Narrow range movement)
After the volatility period of around April 14-17, there is a possibility that the short-term trend will change.
The next volatility period is expected to be around April 25-29 (up to April 24-30).
Therefore, the point of interest is whether it will fall below the M-Signal indicator on the 1D chart and show a downward trend, or rise above the M-Signal indicator on the 1W chart and show an upward trend.
In other words, you need to look at whether it will rise along the trend line (2) or fall along the trend line (4).
-
As I said before, if the StochRSI indicator is above 50, it is better to focus on finding a selling point.
The reason is that even if it rises, the upward trend is likely to be limited.
If the trading volume increases explosively when it shows support at a certain support and resistance point or section, it is possible that it will lead to a large increase, but it is a rare case, so it is better to refrain from expecting it.
-
Thank you for reading to the end.
I hope you have a successful transaction.
--------------------------------------------------
- Here is an explanation of the big picture.
I used TradingView's INDEX chart to check the entire section of BTC.
I rewrote it to update the previous chart while touching the Fibonacci ratio section of 1.902 (101875.70) ~ 2 (106275.10).
(Previous BTCUSD 12M chart)
Looking at the big picture, it seems to have maintained an upward trend following a pattern since 2015.
In other words, it is a pattern that maintains a 3-year bull market and faces a 1-year bear market.
Accordingly, the upward trend is expected to continue until 2025.
-
(Current BTCUSD 12M chart)
Based on the currently written Fibonacci ratio, it is displayed up to 3.618 (178910.15).
It is expected that it will not fall again below the Fibonacci ratio of 0.618 (44234.54).
(BTCUSDT 12M chart)
Based on the BTCUSDT chart, I think it is around 42283.58.
-
I will explain it again with the BTCUSD chart.
The Fibonacci ratio ranges marked in the green boxes, 1.902 (101875.70) ~ 2 (106275.10) and 3 (151166.97) ~ 3.14 (157451.83), are expected to be important support and resistance ranges.
In other words, it seems likely that they will act as volume profile ranges.
Therefore, in order to break through these ranges upward, I think the point to watch is whether they can receive support and rise near the Fibonacci ratios of 1.618 (89126.41) and 2.618 (134018.28).
Therefore, the maximum rising range in 2025 is expected to be the 3 (151166.97) ~ 3.14 (157451.83) range.
In order to do that, we need to see if it is supported and rises near 2.618 (134018.28).
If it falls after the bull market in 2025, we don't know how far it will fall, but based on the previous decline, we expect it to fall by about -60% to -70%.
Therefore, if it starts to fall near the Fibonacci ratio 3.14 (157451.83), it seems likely that it will fall to around Fibonacci 0.618 (44234.54).
I will explain more details when the bear market starts.
------------------------------------------------------

Support Zone: 106.19
Hello, traders.
If you "Follow", you can always get new information quickly.
Please click "Boost" as well.
Have a nice day today.
-------------------------------------
(NVDA Chart)
The HA-Low indicator on the 1D chart was formed at 106.19.
Therefore, the key is whether it can receive support and rise near 106.19.
-
(30m chart)
If it falls below 106.19,
1st: M-Signal indicator on 1M chart
2nd: HA-Low indicator on 30m chart
You need to check if it is supported near the 1st and 2nd above.
In order to continue the uptrend, the price must be maintained above the M-Signal indicator on the 1M chart.
-
(1D chart)
Since the HA-Low indicator on the 1D chart has been newly created, the key is whether it can be supported near this area and rise above the M-Signal indicator on the 1D chart.
If so, it is expected to turn into a short-term uptrend.
If not, there is a possibility of a stepwise downtrend, so the current position is an important section.
-
Thank you for reading to the end.
I hope your transaction will be successful.
--------------------------------------------------

GOLD BUY US SESSIONHI there is your PAW again
As I am monitoring market from Asian opening market is just pumping up
I buy gold from 2718.6 and now I am telling you to buy it too
It will gonna up and retest the trend line
ENTRY 2718.6
Tp 2732
Sl 2714
139.4 Pips target
34 pips Stop loss

Understanding Market Structure In 5 MinutesThis video goes into depth on the types of market structures and how they happen. Ranging -> Breakout (Spike) -> Channel (trend or a ranging trend) -> Climax. The market moves in these repeatable patterns over and over and over again. If you can diagnose where we are in these cycles then you can harness this skill to improve your trading.

Perpetual Protocol PERP Coin Price Prediction🔥 Price on the 4H chart might come at these support area and we might get a potential bounce🔥
Potential bounce areas for Buying 1.24866 and 0.93070
👉 Follow me for More Real Time Opportunities.
Share your Thoughts if you have any?

KR a food sector leader for a safe modest trade LONGKR in early August rose from its usual range into a head and shoulders from which
it trended down into its present lower base. I see this as a good setup for a long
trade to reach to and possibly beyond the mid Fibonacci retracement levels also
confluent with horizontal R/S lines drawn from the pivots to the left. I will take
the very safe long trade taking partials at the levels above as drawn onto the chart
with 30% at the 1st and 2nd partials and 20% for the 3rd and last. I will also
take a trade in some call options. If you would like my idea of the best calls
in my opinion, please leave a comment.

USOIL: Bearish Divergence at Bearish AB=CD and Gartley PCZThere is Bearish Divergence on USOIL at the PCZ of a Bearish AB=CD and Bearish Gartley as it potentially backtests previous support as resistance

GBPCAD Short Opportunity - FEBRUARYY RECAP Explanation within chart screenshot:
Looking for London downward momentum after DT formed - 2RR

EURJPY H4EURJPY clear downtrend. It can be Retest resistance area and grab some LQ After That it can be push Downside for continuation. If it makes Divergent it can be hit Supply Zone.


EURUSD ! looking at bullish form, long trade idea 📈If EURUSD can break through the 0.98720 level and hold, it's start to again new bullish rally. My guess is that eurusd will continue to rise and test the major level.

gbpusd bearish market analysisIf we look at Weekly charts it's shows that price on a strong bearish trend no reversal point till now so we need to look for sell Positions and last week market already rejected from moving upwards. Which indicate that we still in bearish market Look for psychological level to short market.....
Happy trading 🕺🌈💯

XAUUSD ! Gold is expected to continue in the short term, Gold has broken the resistance level of 1655 and has a bullish form, and the growth can continue up to the level of 1688. If the gold gets rejection at 1688 level and shows bearish form, it will be a short trade, so wait if you enter short trade.

BTC/USDT (targets done) 30.07.22🟢🤑🎯
Finally, after a long time, this analysis was done,
follow and achieve your dreams
if you like the idea, do not forget to support with a like and follow.
📅 30.07.22

" GBPAUD " BUY Trade ( With 200 Pips Target )Pair Name : GBPAUD
Time Frame : 15 Min
Analysis Type : Scalping Trade
--------------------------------------
➡️ Main Support Level : 1.72100
➡️ Main Resistance Level : 1.76450
➡️ Time To Entry : After Break Out The Area And Test it
➡️ Target : 1.76400

CHFJPY SHORT There is a higher resistance level discharge
After breaking, the price may fall to the next support level


SAND/USDTI analysis by smart money, Al Brooks, OB, Trend, Supply and demand, elliott wave, fib, MACD, RSI and ...

BULLS GET READY! BTC Primed for a RALLY!!!!!!Bitcoin has been lately testing the waters and Bitcoin made huge moves in downward direction that changed market sentiment from Bullish to bearish for Crypto.
MAJORITY are expecting a Drop to 30k. And that is what doesn't happen very often.
After what BTC did today, BTC has printed so many GREAT BULLISH SIGNS that i am pretty Confident that BTC has BOTTOMED OUT for Short to MID TERM and is looking to rally hard from this 40k ZONE.
But, What Exactly did BTC DID TODAY ?
1) BTC just Printed a DRAGONFLY DOJI Candlestick on DAILY Timeframe with HUGE VOLUME on Support Zone:-
2) BTC forming a beautiful falling wedge :-
3) Bouncing from Support Zone :-
4) BTC Making a DOUBLE BOTTOM with a massive bullish divergence :-
5) Monthly Timeframe Strong Bullish Divergence on BTC :-
Overall, Market Overreacted to Changes introduced by FED. Thus BTC Dumped on Sudden fear of increase in interest rates or increase in 10 Year Bond Yields but i do believe FED wouldn't want to crash the market.
Thus, for precaution sake, INVALIDATION point for this POST is $39570:
and My Target for BTC are for SHORT to MID Term :-
This is not a financial advice. This is just an educational idea and my own view and my own reasons due to which i have opened long positions from here for SHORT Term.
One more reason, i have gone long on BTC now is that It is a very low risk to Go long with Small Positions right now due to which i am willing to do so.
Enjoy everyone, and Trade Safely.
