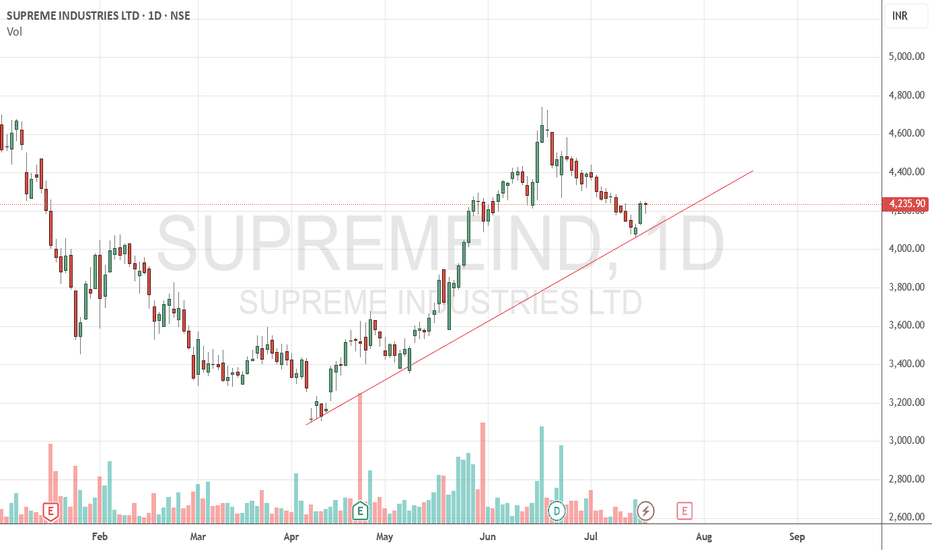
SUPREMEIND
SUPREME INDUSTRIES LTD - Inverse Head & Shoulder + Cup & Handle 📊 Script: SUPREMEIND (SUPREME INDUSTRIES LIMITED)
📊 Nifty50 Stock: NO
📊 Sectoral Index: NIFTY 500 / NIFTY MIDCAP
📊 Sector: Industrials Capital Goods
📊 Industry: Plastic Products - Industrial
Key highlights: 💡⚡
📈 Script is trading at upper band of Bollinger Bands (BB) and giving breakout of it.
📈 MACD is giving crossover.
📈 Double Moving Averages also giving crossover.
📈 Volume is increasing along with price which is volume breakout.
📈 Script is giving breakout of Inverse Head & Shoulder + Cup & Handle + trendline.
📈 Current RSI is around 68.
📈 One can go for Swing Trade.
⏱️ C.M.P 📑💰- 2263
🟢 Target 🎯🏆 - 2474
⚠️ Stoploss ☠️🚫 - 2131
⚠️ Important: Always maintain your Risk & Reward Ratio.
⚠️ Purely technical based pick.
✅Like and follow to never miss a new idea!✅
Disclaimer: I am not SEBI Registered Advisor. My posts are purely for training and educational purposes.
Eat🍜 Sleep😴 TradingView📈 Repeat🔁
Happy learning with trading. Cheers!🥂
SUPREME INDUSTRIES - Lifetime breakout - Weekly ChartThis analysis is purely based on price action.
(This stock was analyzed previously on Monthly Time Frame, whose link is also provided here. Do check it. )
Analysis is done on Weekly Time Frame.
Trade Strategy is given in image itself.
Don't run after the price.
*Trade at your own risk & money management. Always do your own study before entering into any trade*
Feel free to comment for any query or suggestion.
Multi-year Breakout in Supreme IndustriesThis is about positional trade opportunity (monthly or weekly) in Supreme Industries (a leader in plastic products sector).
As can be seen in monthly or weekly charts, 1476 level is acting as a multi-year resistance and the stock price has again come near that level. It has tested that level multiple times, hence chances of its breaking are high.
If the stock price breaks that level with volume (preferably in monthly time-frame), stock may show some really good up-move in coming weeks.
Trading Strategy would be to enter above the high of the monthly candle that breaks & closes above that resistance level and SL can be take accordingly (either below the low of the breakout candle or below the recent swing support).
Another strategy to enter the stock (if the breakout candle goes too high so that entering at that high would give bad Risk:Reward) would be to wait for retesting of the 1476 level and enter at the signs of reversal (upwards). Since it would be a multi-year breakout, if it breaks that level, it should retest that level in sometime shortly.
Target of this stock can be anywhere near 30% to 50% of up-move on that timeframe.
This is purely as per the study of weekly and monthly chart study of the stock and technical analysis.


