SONIC/USDT Breakout in Progress? Watch This Critical Level Close🧠 Technical Breakdown – Daily Chart (1D, Coinex)
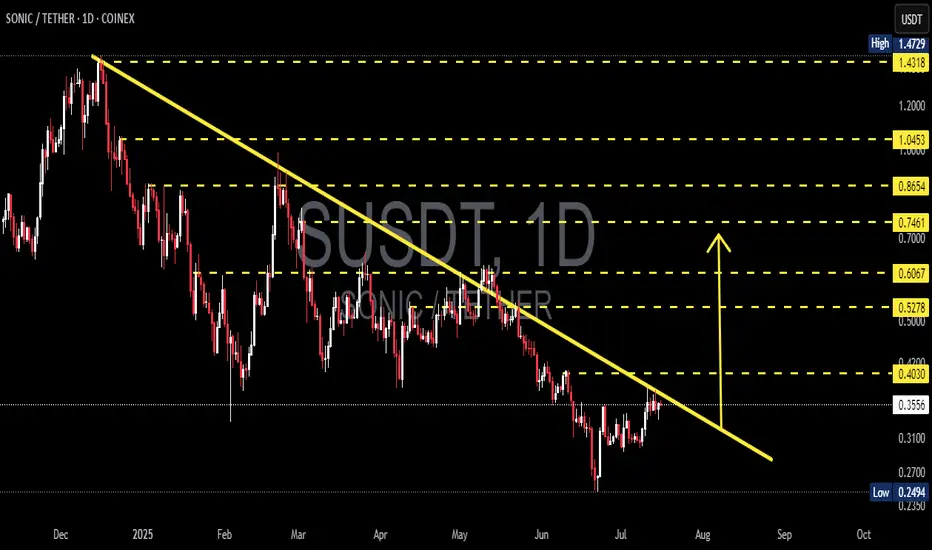
The SONIC/USDT pair is currently exhibiting a textbook descending trendline breakout setup, formed over the past 7+ months. This long-term downtrend has been respected since late November 2024, connecting multiple lower highs and establishing a well-defined bearish structure.
However, recent price action shows a potential trend reversal as the pair consolidates tightly near the apex of the structure, with signs of breakout momentum building.
📐 Pattern Identification:
✅ Falling Wedge / Descending Triangle
✅ Continuous lower highs connected by a descending trendline
✅ Support held above $0.25 (strong demand zone)
✅ Price now testing the upper boundary of the trendline
This is a classic bullish reversal pattern—especially when price breaks out after long-term compression.
🚀 Bullish Scenario:
Should SONIC successfully break and close above the $0.4030 level (trendline + horizontal resistance), it could unlock a wave of bullish momentum. Here are the key upside targets based on Fibonacci retracement from the previous high ($1.4729) to the local low ($0.2494):
🎯 Resistance Level Significance
$0.5278 0.382 Fib – First major target post-breakout
$0.6067 Key confluence level – psychological barrier
$0.7461 0.618 Fib – Bullish continuation zone
$0.8654 High momentum extension
$1.0453 0.786 Fib – Reversal confirmation
$1.4318 Retest of the all-time high
If volume supports the breakout, we could see a sharp move toward these zones.
🧨 Bearish Scenario:
If price fails to break out and gets rejected from the trendline:
It could retrace back toward $0.3100 and $0.2700
A daily close below $0.2494 (previous low) would invalidate the bullish setup, signaling potential continuation of the downtrend
Traders should monitor RSI divergence and volume drop as warning signs
📌 Why This Setup Matters:
This is not just a short-term play. A successful breakout here signals the end of a multi-month downtrend and the potential start of a new macro uptrend. SONIC has been heavily compressed — and the tighter the coil, the bigger the move.
Smart money often enters before the breakout confirmation. Monitor for volume surges, candle structure changes, and key breakout retests.
✅ Summary:
🔄 Trendline breakout imminent
🟢 Watch for breakout confirmation above $0.4030
🔴 Breakdown below $0.2494 invalidates the bullish thesis
🧭 Fibonacci levels offer reliable target zones for profit-taking
This is a critical make-or-break zone for SONIC/USDT. Traders, be ready.
#SONICUSDT #BreakoutSetup #AltcoinAlert #CryptoAnalysis #TrendReversal #TechnicalAnalysis #CryptoTA #Altseason #FibonacciLevels #PriceAction
Susdtlong
Long Sonic (S) - before altcoin seasonSonic (S) - One of the strongest coins when it comes to fundandamentals.
Now listed on Coinbase. I expect more good news to come soon.
The risk reward now is incredible good for investors.
I think it is likely that we will see a bounce between 0.30-0.31 to set a higher low. that could be a killer entry before the altcoin season kicks off.
My idea is to buy and hold
I see 0.30 as a really good long term investment entry.
No financial advice.

SUSDT 1D AnalysisS ~ 1D Analysis
#S Buy back gradually from here if you still have confidence in this coin with a short term target of at least 15%+ from here.

SONICUSDT 1D Analisis S / SET:SONIC ~ 1D Analisis
#S / #SONIC Buy gradually from here if you still have confidence in this coin with a short term target of at least 10%+ From here.

SUSDT - This opportunity might not come around again.!All tokens built on the Ethereum network pumped yesterday as ETH moved up by just 4%, and SONIC (S) stood out as the top performer among them, surging by around 22%.
Currently, the coin has formed a symmetrical triangle pattern, which has been broken to the upside with a massive green candle. It's now retesting the 0.382 Fibonacci level — a key zone to watch for continuation.
This is a massive investment opportunity to buy the token at around $0.55 only.
The long-term targets for S in 2026 are insane — the most conservative target for now is $1.20.
Best regards Cecilion🎯

SONICUSDT 12HS / SET:SONIC ~ 12H Analysis
#S / #SONIC Buy after successfully penetrating this resistant line with a short -term target of at least 10%+ from here.

SUSDT Still in Trouble – Is the Worst Yet to Come?Yello, Paradisers! Are you letting this short-term bounce on #SUSD fool you? Be careful. What looks like a recovery could just be a deceptive pause before the next major drop hits.
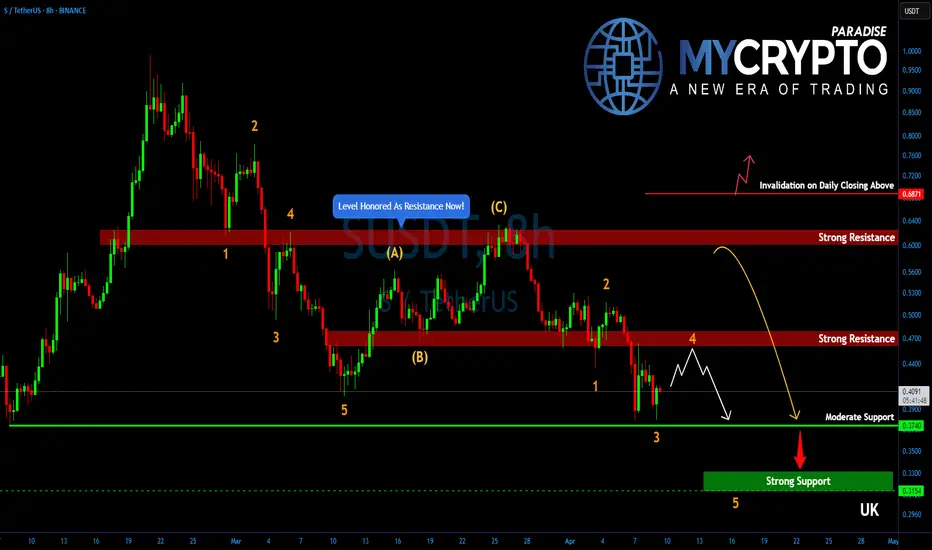
💎After topping out just shy of the psychological $1.00 mark, SUSDT has entered a significant zigzag corrective structure. Despite the recent bounce, the bigger picture still suggests that the market is setting up for one more leg to the downside, where the real bottom might finally be reached.
💎#SUSDT has printed a short-term double bottom around the $0.38 level, positioned slightly above a moderate support zone. This has triggered a minor bullish push, offering a temporary sense of relief for bulls. However, based on the current market structure, this move is likely to be short-lived and part of a broader corrective pattern.
💎The resistance zone between $0.465 and $0.4720 is now the key level to watch. It’s a strong supply area where selling pressure is expected to return with intensity, making it difficult for buyers to gain control. If price gets rejected from this zone, a drop back toward the $0.3740 level is highly probable, as this area serves as the next moderate support.
💎The structure on SUSDT is far from done to the downside. If the rejection plays out as expected, the price could slide even lower, targeting the $0.3300 to $0.3150 range. This is where the final drop may conclude and a proper base for recovery could finally be established.
Paradisers, strive for consistency, not quick profits. Treat the market as a businessman, not as a gambler.
MyCryptoParadise
iFeel the success🌴
SUSDT 12HS ~ 12H Analysis
#S Buy gradually from here if you still have a Conviction on this coin with a short -term target of at least 10%+.

#SUSDT.P -A New Upside Opportunity with the Cup and Handle Hey everyone,
Today’s analysis is for #SUSDT.P. We’ve got a solid Cup and Handle formation here, and I believe it’s set to play out well. The ideal long entry zone is between 0.53-0.56, with short-term targets at 0.60 and longer-term targets at 0.66.
Just like our BINANCE:REDUSDT.P analysis from yesterday, I’m rooting for this one to hit its targets quickly. Wishing you all a green-filled day ahead!
What do you think of my analysis? Let’s meet in the comments and discuss!
Manage your risk, stay in the game! 🎯🔥
#AlyAnaliz #TradeSmart #CryptoVision #SUSDT

S (The Ex FTM) Has Formed a Bull Pattern and in Wave 3In short time frame the S, AKA "Ex FTM" has formed a Cup&Handle pattern. The breakout has already copleted. If it can stay above the invalidation level, S can reach the level 0.62 easily.
For a better perspective for long term, S also completed it's Bearish A-B-C waves and seems bullish again.
Good Luck.

S/USDT: FALLING WEDGE BREAKOUT!! 🚀 Hey Traders! SONIC Breakout Alert – ATH Incoming? 👀🔥
If you’re excited for this setup, smash that 👍 and hit Follow for premium trade ideas that actually deliver! 💹🔥
🔥 SONIC/USDT – Breakout & Retest in Play! 🚀
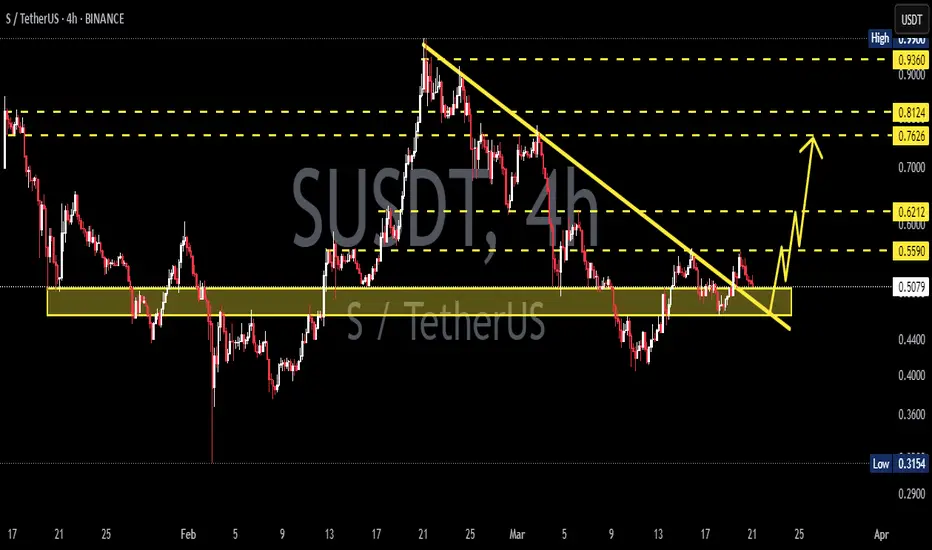
SONIC is breaking out of a falling wedge on the 4H timeframe and is currently retesting the breakout level. With momentum building, we’re expecting a move toward ATH soon.
💰 Trade Setup:
📍 Entry: CMP, add more up to $0.50
🎯 Targets: $0.56 / $0.62 / $0.69 / $0.78 / $0.85 / $0.96
🛑 Stop-Loss: $0.46
⚡ Leverage: Low (Max 5x)
🔎 Strategy:
Enter with low leverage now
Add more on dips and ride the wave higher
💬 What’s Your Take?
Are you bullish on SONIC’s breakout? Share your analysis, predictions, and strategies in the comments! Let’s lock in those gains and ride this pump together! 💰🚀🔥

SUSDT 4HS ~ 4H Analysis
#S Buy from here if you only have a Conviction on this coin with a short -term target of at least 10%+.
SUSDT - Bearish chart!Breaking down the rising wedge pattern in 4H chart
Price targeting the 0.45 level
Entry: 0.53 - 0.54
Targets: 0.525 - 0.515 - 0.505 - 0.480 - 0.450
Stoploss:0.570
Leverage: x5
Best regards Ceciliones 🎯

SUSDT - a pattern as text bookS looks bullish as it breakout the trendline in 4h chart
consolidation a v bottom pattern as text book... price acton expected to be a shown in chart
(breakout the neckline , retest then continuation in bullish)..
expected 25% bullish rally in coming days
Best regards Ceciliones🎯

Reversal for Sonic has commencedSeems like 50 cents has some iron wall defending it and now double bottom at 50 cents was established, allowing those who wanted to exit to do so (capitulation), based on the volume.
We now have made a clean reversal on the hourly.
Next targets are the launch high, which is a nice take profit target to those on long positions, but i expect overall trajectory to be higher.
