[Deep Dive] SUSHI – Edition 3: Accumulate. Anticipate. Accelerat🧠 Cycle Anatomy: What the Chart Is Telling Us
📉 Phase 1: Markdown
The bears dominated, slicing price downward into key historical support around the $0.50 mark — the same level that anchored the previous accumulation zone.
📦 Phase 2: Accumulation
Both accumulation phases (mid-2023 and Q2 2025) occurred near identical support zones, with rounded bases and sideways chop — signaling strong hands quietly absorbing supply.
📈 Phase 3: Markup Incoming?
Following breakout point “1” and retest point “2,” the current structure aligns remarkably well with the previous markup phase — which propelled SUSHI from ~$0.50 to over $3 in just weeks. While past performance isn’t a guarantee, this fractal deserves attention.
🔥 Why Fundamentals May Support This Move
- SushiSwap v3 continues rolling out on multiple chains, optimizing capital efficiency and fee structure for LPs.
- Governance has stabilized after the rough patches of 2022–2023, with more transparent treasury and development direction.
- Cross-chain expansion and integrations with major aggregators (like 1inch, Matcha, and DeBank) are boosting SUSHI’s visibility in the broader DeFi flow.
Additionally, a surge in TVL and DEX activity on low-fee chains could redirect volume back to SushiSwap — a platform known for its cross-chain capabilities.
📍 What to Watch Next
- A confirmed breakout above $1.00 would validate the “markup” thesis.
- A dip toward the $0.65–$0.70 zone could offer a high-risk/reward entry aligned with point “2.”
- Failure to hold the $0.50 level would invalidate the structure.
For now, the rhythm is clear: markdown → accumulation → markup. And if the pattern holds, SUSHI might just be preparing for its third vertical.
💬 Do you think this is just another fakeout — or is SUSHI gearing up for a DeFi comeback?
🔔 Disclaimer: This post is for educational and informational purposes only. It does not constitute financial advice. Always do your own research and manage risk carefully.
📚 Always follow your trading plan => including entry, risk management, and trade execution.
Good luck!
All strategies are good, if managed properly.
~ Richard Nasr
Sushi

SUSHIUSDT at a Critical Pivot Golden Pocket Retest or Bull Trap?📊 Full Daily Chart Analysis (1D) — KuCoin
After months of dull sideways movement, SUSHI is finally showing signs of life! A strong breakout above a long-term consolidation range has pushed price up to the key resistance at $1.03, raising the possibility of a mid-term trend reversal.
However, the price is now entering a pullback phase. The key question:
Is this just a healthy correction before the next leg up—or the beginning of another downward move?
---
🔍 Structure & Pattern Breakdown:
Rounded Bottom Formation:
Formed from April to July 2025, this pattern signals a shift from accumulation to potential bullish expansion.
Confirmed Breakout:
A breakout above the neckline at $0.80, supported by increasing volume, suggests this move is legitimate—not a fakeout.
Golden Pocket Retest (Key Fibonacci Zone):
Price is currently pulling back into the Fibonacci Golden Pocket (0.5 at $0.7992 and 0.618 at $0.7295) — the most ideal technical zone for a bullish re-entry. This area also aligns with a strong historical demand zone.
---
📈 Bullish Scenario (Primary Case):
If daily candles hold above the $0.7295–$0.7992 zone and form a strong reversal signal (e.g. bullish engulfing or hammer):
Price is likely to retest $1.03 (minor resistance).
A successful breakout above $1.03 could lead to a rally toward:
🔸 $1.3374 – Previous horizontal resistance
🔸 $1.8307 – Key psychological level & March 2025 swing high
🔸 $2.6591 – Fibonacci extension target
🔸 $2.8195 – Major high from November 2024
This could mark the beginning of a mid-term bullish trend if volume continues to build.
---
📉 Bearish Scenario (Alternative Case):
If the price fails to hold above the Golden Pocket and breaks below $0.7295:
A deeper correction is likely, with price revisiting $0.60 or even retesting the bottom zone at $0.4515.
This would invalidate the bullish setup and confirm a bull trap.
---
🧠 Conclusion:
SUSHI is at a decisive moment. This retest of the Golden Pocket will determine whether this is simply a healthy pullback within a new uptrend, or the early sign of another bearish breakdown.
> Plan the trade, trade the plan. The $0.73–$0.80 zone is the battlefield for SUSHI’s next major move.
---
📌 Key Levels:
Level Description
$0.7295–$0.7992 Golden Pocket (Fibonacci Re-Entry Zone)
$1.03 Minor Resistance
$1.3374 Bullish Target 1
$1.8307 Bullish Target 2 (Mid Resistance)
$2.6591–$2.8195 Long-Term Bullish Targets
$0.60 / $0.4515 Bearish Supports if Breakdown Occurs
#SUSHIUSDT #CryptoBreakout #FibonacciTrading #GoldenPocket #AltcoinReversal #SushiSwap #CryptoSetup #TechnicalAnalysis #BullishScenario

Massive Upside for SUSHI from Key Demand Zone!CRYPTOCAP:SUSHI is bouncing strongly from a key multi-tested weekly support zone (~$0.42–$0.55), signaling a potential bottom formation. Price action shows a bullish structure with the possibility of a trend reversal. If momentum continues, we could see a rally first toward Resistance 1 at $1.25, followed by a larger move targeting Resistance 2 at $3.75.
Stop Loss: $0.43
Resistance 1:$1.25
Resistance 2:$3.75
BINANCE:SUSHIUSDT

Sushi Turns Bullish, Major Support Zone Left Behind · $105 Next?A major support zone from November 2020 has been left behind. The launch pad for Sushi's previous bull market. Let me explain.
Right after SUSHIUSDT became available for trading late August 2020 it started a strong decline. This decline found support at a low point November 2020. To this day, this low remains the strongest and most important support for this pair and it has never been broken on a weekly close, not even once. The level was tested three times: In 2025, 2024 and 2023 and each time it gets tested a bullish wave develops.
From November 2020 through March 2021, 126 days, SUSHIUSDT went ultra-bullish, total growth amounting to 4,864%.
The bullish waves in late 2023 and 2024 were something minimal, whales buying nothing more as there was no continuation. The situation is different today.
Sushi has been accumulating for years and is ready for a full-blown bull market. This week it started trading above EMA55 on a full green candle, coupled with really high volume. This is it, the major bull market cycle and wave. It ends in a bull-run phase.
The November 2020 support is now being left behind. Sushi is preparing and has the possibility of hitting a new all-time high in late 2025. It can happen that the action goes beyond this year and into 2026.
Some pairs can produce an entire bull market bullish wave in 3-4 months. Other pairs can do so in 6 months exact. Some others go for longer and last 8 months while a different set can take 12 months or more. Some pairs have been in bull market territory (higher highs and higher lows) for years... Let's hope the entire market decides to produce long-term growth.
The low in June this year is a higher low compared to April. Here you can see the market variations. Some pairs produced lower lows and others, like this one, produced a higher low. Lower low or higher low makes no difference when it comes to the bigger picture, this is simply a technicality.
We are now entering a massive, marketwide bullish phase. You just need to be prepared for what is coming because this will be the opportunity of a lifetime. While there will always be new bear markets and bull markets, the prices we are seeing now will be forever gone. Crypto will grow so fast and so strong, that the next correction bottom will be really high compared to the most recent major low. Cryptocurrency is going mainstream and is here to stay for the long haul.
Namaste.

SUSHI/USDT Reversal from Historical Demand ZoneThe SUSHI/USDT pair is showing strong potential for a bullish reversal from the long-term demand zone between $0.44 - $0.58, which has historically acted as a solid support area since 2021. Price has tested this zone multiple times and has bounced back, indicating significant buying interest.
🔍 Technical Overview:
Timeframe: Weekly (1W)
Key Support Zone: $0.44 - $0.58 (strong accumulation area)
Key Resistance Levels (Potential Targets):
$0.815
$1.392
$1.950
$2.765
$3.500+
Price Structure: Currently forming a possible double bottom or sideways accumulation near the macro support, often seen before bullish markup phases.
Bullish Signal: The yellow arrow illustrates a projected upward movement over the coming weeks/months if the support holds.
After a prolonged downtrend, SUSHI/USDT is now at a critical turning point, bouncing from a multi-year support zone. This accumulation phase may be the early stage of a major bullish trend. Traders should keep an eye on this setup as a breakout toward higher resistance levels could be imminent.
#SUSHI #SUSHIUSDT #CryptoAnalysis #Altcoins #CryptoReversal #TechnicalAnalysis #CryptoSupportResistance
#BullishReversal #CryptoSignals #PriceAction #ChartPattern

#SUSHI/USDT#SUSHI
The price is moving in a head and shoulders pattern on the 1-hour frame, adhering well to it, and is heading for a strong breakout upwards and retesting it, forming the right shoulder.
We have a bounce from the lower channel line to the right shoulder, which is support at 0.620.
We have a downtrend on the RSI indicator that is about to be broken and retested, supporting the upside.
We have a trend of consolidation above the 100 moving average.
Entry price: 0.629
First target: 0.637
Second target: 0.650
Third target: 0.666

#SUSHI/USDT#SUSHI
The price is moving within a descending channel on the 1-hour frame and is expected to break and continue upward.
We have a trend to stabilize above the 100 moving average once again.
We have a downtrend on the RSI indicator, which supports the upward move by breaking it upward.
We have a support area at the lower limit of the channel at 0.616, acting as strong support from which the price can rebound.
Entry price: 0.621
First target: 0.634
Second target: 0.643
Third target: 0.654

Sushiswap 1,2 Breakout Sequence Can Lead To New ATH (3,000% PP)On this chart and after reaching a market bottom Sushiswap produced a clear 1,2 breakout sequence. This sequence has been shown to produce a bullish wave.
You know what they say, "Third time's a charm," and we are on the third breakout from a long-term support.
1) In early June 2023 we have the first 1,2 breakout sequence which leads to a bullish wave that ended in March 204.
2) In August 2024 the same sequence again, and a new bullish wave ends December 2024 with a higher high compared to March.
3) Fast forward and bring yourself to this present day, April 2025 the same sequence starts as a higher low. "Third time's a charm." Here we are getting not only a higher high but it is possible even a new all-time high.
» Growth potential can reach 1,500%, 2,500% or even beyond 3,000%, it is still too early to say.
It is not early to know though that the market already hit bottom and is preparing to grow.
This is a good chart and a great project; an awesome opportunity. Buy and hold.
Namaste.

SUSHIUSDT 1W AnalysisSUSHI ~ 1W Analysis
#SUSHI This is the lowest support for now, buy from here with a short term target of at least 15%+ from here.

Is SUSHIUSDT About to Bounce or Break? Yello, Paradisers! SUSHIUSDT is setting up an intriguing scenario after reacting to a key resistance trendline. Let’s break this down:
💎If SUSHIUSDT shows a bullish I-CHoCH (Internal Change of Character) from the key support zone—previously a resistance level—it could signal a higher probability of a bounce. However, patience is key here; we need to wait for confirmation of a bullish I-CHoCH on lower timeframes to take action.
💎On the flip side, if the price experiences further drops or shows signs of panic selling, the best approach would be to wait for it to reach a stronger support zone. At that point, we’d need to look for bullish patterns such as A W formation or An Inverse Head and Shoulders on lower timeframes to stack the odds in our favor.
💎If the price breaks down and closes a candle below the strong support zone, it will invalidate the bullish thesis entirely. In that case, it’s smarter to wait for a clearer structure to develop before considering any entries.
🎖 Remember, Paradisers, disciplined trading is the only way to achieve long-term success. Avoid impulsive decisions and always prioritize confirmation over speculation. The market rewards patience and preparation—stay sharp, stay focused.
MyCryptoParadise
iFeel the success🌴

SUSHI - History Repeating Itself!Dear TradingView community and fellow traders,
I am Richard, also known as theSignalyst.
I find the SUSHI 🍣 daily chart intriguing , as it seems to be following the classic Wyckoff Cycle 📈.
If history repeats itself, we’ve just broken out of the accumulation phase ✅, highlighted in green 🟩.
As long as the bulls 🐂 remain in control, the markup phase may have just begun—potentially pushing SUSHI as high as $2.5 🚀.
❓ What's next?
Will SUSHI continue to trade higher from here, or will this cycle play out differently?
I hope you find this post useful, and I would appreciate your likes and support.
Which scenario do you think is more likely to happen first? and why?
📚 Always follow your trading plan regarding entry, risk management, and trade management.
Good luck!
All Strategies Are Good; If Managed Properly!
~Richard

SUSHIUSDT 1D AnalysisSUSHI ~ 1D Analysis
#SUSHI Buy when re -testing this support block with a short -term target of at least 10%+ from here.

SUSHIUSDT Holding Strong Support — Bullish Ahead?"SUSHIUSDT Technical analysis update.
SUSHIUSDT has respected a strong horizontal support zone for several years, as shown by multiple successful retests. Every dip into this support area has triggered a notable bounce.
Currently, SUSHI is once again bouncing off this major support, and the price action suggests potential for a larger bullish move ahead. Before the big rally price could correct, if the rally continues, then the next target $2.80–$3.40 level.

SushiSwap: Your Altcoin ChoiceAnother great chart. In December 2024 SushiSwap hit its highest price since December 2020 on a bullish move. In general, December 2024 produced the highest level since April 2022. Really something, a multiple years long high.
How are you doing today my friend in the law?
I hope you are having a wonderful day and weekend.
This is another classic chart setup and price action dynamic that I am about to show and analyze. SUSHIUSDT produced a triple-bottom on a wide, long-term consolidation (sideways) channel.
It is interesting to notice that shy higher highs have been present since October 2022. The bottom portion is mixed. Last week produced the lowest price ever based on candle close. On candle wick, this week is a higher low vs early August 2024. This is pretty much irrelevant.
Seeing a lower low, higher low, perfect double-bottom, etc., wouldn't change the bigger picture.
There is a strong correction after a descent but minor bullish wave. This correction ends at support and once the low is in a new bullish impulse will develop. Now, the preceding years the action was not really strong because these are transition years. A transition from bearish to bullish.
This year, everything changes. Instead of a small "descent" bullish wave, we will have a major bullish cycle, that is what comes next. The price now is absolutely awesome, the best possible, true All-Time Low. Once we are in with great timing and pricing, a bull market becomes really fun. When you manage to catch the bottom, all that follows is to see how your capital/profits grow.
Enjoy your life! And thank you for your continued support.
This is a great Top Altcoin Choice.
Namaste.

SUSHIUSDT 1WSUSHI ~ 1W Analysis
#SUSHI Buy gradually from here with a short -term target of at least 20%+. This is the lowest support for now.

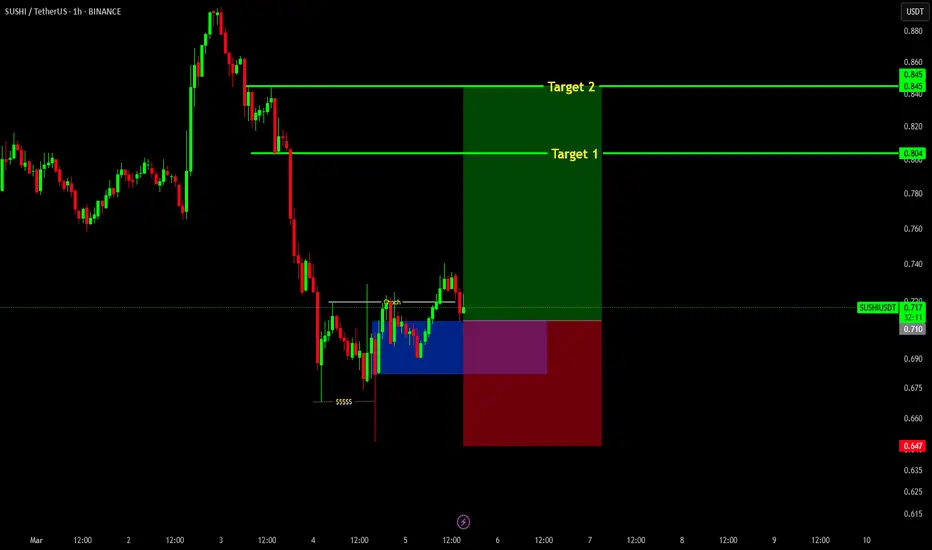
Sushi long trade setupSushi recently on 1hr time frame gave a proper ChOCh which is a bullish setup.
Entry region marked (blue box)
Stoploss at 0.647
Targets: 0.805, 0.845
UNIVERSOFSIGNALS| SUSHI: Key Levels and Market Outlook👋 Welcome to UNIVERSOFSIGNALS !
In this analysis, I want to review SUSHI for you. SushiSwap is a DeFi protocol operating in the DEX sector, with its token currently ranked 195th on CoinMarketCap and a market cap of $58 million.
📅 Weekly Timeframe
On the weekly timeframe, we can see a consolidation box between $0.534 and $1.959. Since 2022, the price has been fluctuating within this range, forming a large consolidation zone, with multiple touches to both the upper and lower boundaries of this box.
🔍 As observed, in the last bullish leg, the price broke above the box's upper boundary with a large weekly candle. However, it quickly retraced back into the range after being rejected at $2.734, resulting in a fake breakout.
🧩 Currently, the price is near the lower boundary of the range at $0.534. If this support level breaks, the price could initiate another bearish leg and move toward a new all-time low (ATL). On the other hand, if the upper boundary of the box is broken and price stabilizes above it, we could see an upward movement in SUSHI.
⚡️ The largest and most significant resistance ahead is at $20.444, which is the all-time high (ATH). Reaching this level would be extremely difficult, as it would require a significant increase in market capitalization, meaning a substantial capital inflow into the coin.
✨ Let’s now analyze the daily timeframe to gain more insight into price movement.
📅 Daily Timeframe
On the daily timeframe, as seen in the last bullish leg, the price bounced from the $0.534 support and moved upward. After breaking $0.803, strong bullish momentum entered the market. Additionally, RSI reaching the oversold zone contributed to a stronger bullish push.
🔽 Following this movement, the fake breakout at $1.855 led to the start of a corrective and bearish phase, with the price initially declining to $1.347.
📊 After breaking below $1.347 and retesting it as resistance, the price entered another bearish leg, reaching $0.803. Currently, after some range-bound movement around this level, RSI has exited the oversold zone, and the price seems to be retesting this level as resistance.
✅ If RSI re-enters the oversold zone, the price could drop further to the lower boundary of the range at $0.534, which would not be a good sign for SUSHI. As observed, buying volume has significantly decreased, and most traders in this market are sellers.
🛒 For spot buying, I recommend avoiding this coin for now and waiting for a clear bullish structure to form. At a minimum, SUSHI should start showing strength against Bitcoin.
🧲 From a USDT perspective, if the upper boundary of the range ($1.855) breaks, then $2.734 could serve as a trigger for a buying opportunity.
📝 Final Thoughts
This analysis reflects our opinions and is not financial advice.
Share your thoughts in the com

TradeCityPro | SUSHI: Key Levels and Market Outlook👋 Welcome to TradeCity Pro!
In this analysis, I want to review SUSHI for you. SushiSwap is a DeFi protocol operating in the DEX sector, with its token currently ranked 195th on CoinMarketCap and a market cap of $58 million.
📅 Weekly Timeframe
On the weekly timeframe, we can see a consolidation box between $0.534 and $1.959. Since 2022, the price has been fluctuating within this range, forming a large consolidation zone, with multiple touches to both the upper and lower boundaries of this box.
🔍 As observed, in the last bullish leg, the price broke above the box's upper boundary with a large weekly candle. However, it quickly retraced back into the range after being rejected at $2.734, resulting in a fake breakout.
🧩 Currently, the price is near the lower boundary of the range at $0.534. If this support level breaks, the price could initiate another bearish leg and move toward a new all-time low (ATL). On the other hand, if the upper boundary of the box is broken and price stabilizes above it, we could see an upward movement in SUSHI.
⚡️ The largest and most significant resistance ahead is at $20.444, which is the all-time high (ATH). Reaching this level would be extremely difficult, as it would require a significant increase in market capitalization, meaning a substantial capital inflow into the coin.
✨ Let’s now analyze the daily timeframe to gain more insight into price movement.
📅 Daily Timeframe
On the daily timeframe, as seen in the last bullish leg, the price bounced from the $0.534 support and moved upward. After breaking $0.803, strong bullish momentum entered the market. Additionally, RSI reaching the oversold zone contributed to a stronger bullish push.
🔽 Following this movement, the fake breakout at $1.855 led to the start of a corrective and bearish phase, with the price initially declining to $1.347.
📊 After breaking below $1.347 and retesting it as resistance, the price entered another bearish leg, reaching $0.803. Currently, after some range-bound movement around this level, RSI has exited the oversold zone, and the price seems to be retesting this level as resistance.
✅ If RSI re-enters the oversold zone, the price could drop further to the lower boundary of the range at $0.534, which would not be a good sign for SUSHI. As observed, buying volume has significantly decreased, and most traders in this market are sellers.
🛒 For spot buying, I recommend avoiding this coin for now and waiting for a clear bullish structure to form. At a minimum, SUSHI should start showing strength against Bitcoin.
🧲 From a USDT perspective, if the upper boundary of the range ($1.855) breaks, then $2.734 could serve as a trigger for a buying opportunity.
📝 Final Thoughts
This analysis reflects our opinions and is not financial advice.
Share your thoughts in the com

#SUSHI/USDT#SUSHI
The price is moving in a descending channel on the 1-hour frame and is expected to continue upwards
We have a trend to stabilize above the moving average 100 again
We have a descending trend on the RSI indicator that supports the rise by breaking it upwards
We have a support area at the lower limit of the channel at a price of 0.850
Entry price 0.897
First target 0.924
Second target 0.947
Third target 0.980

#SUSHI Holders, Beware: A Major Move Is Brewing in the EcosystemYello Paradisers! Have you been watching #SUSHIUSDT? If not, now’s the time to pay attention. #SushiSwap is approaching a critical point that could spark a bullish breakout:
💎#SUSHI has completed a classic 5-wave impulsive structure, with Wave 5 peaking at around $2.80. What followed is an A-B-C corrective wave, bringing #SUSHI down to its current levels. Right now, we’re seeing Wave C testing the descending support near $0.92. The key question: Will this be the end of the correction, or is there more downside ahead?
💎For the bulls to regain control, #SUSHIUSD needs to break above the $1.356 resistance. A solid breakout here could trigger a rally towards $1.80, and if momentum holds, a push into the strong resistance zone between $2.60 and $2.80. However, if #SUSHI fails to clear this hurdle, expect more sideways action or even a retest of lower levels.
💎On the downside, we have strong support at $0.70. This strong support has held many times more and we believe buyers will setup in to defend this level. The next line of defense for the bulls is present at $0.60.
💎If a candle closes below this level, the bullish setup is invalidated, and we could see a sharp decline towards $0.40 or even lower. This would mark a failure of the corrective structure, leading to a deeper bearish trend.
Stay focused, patient, and disciplined, Paradisers🥂
MyCryptoParadise
iFeel the success🌴

SUSHIUSDT 1WSUSHI ~ 1W Analysis
#SUSHI This is the lowest support for now. Buy from here if you still have a Conviction on this coin with a minimum target of 20%+.

SUSHIUSDT 1WSUSHI ~ 1W
#SUSHI So far it continues to maintain its bullish structure. Buy in stages from here. with a minimum target of 20%++

#SUSHI/USDT Ready to go higher#SUSHI
The price is moving in a descending channel on the 1-hour frame and sticking to it well
We have a bounce from the lower limit of the descending channel, this support is at a price of 1.37
We have a downtrend on the RSI indicator that is about to be broken, which supports the rise
We have a trend to stabilize above the moving average 100
Entry price 1.45
First target 1.58
Second target 1.73
Third target 1.89
