SUSHI/USDT Reversal from Historical Demand ZoneThe SUSHI/USDT pair is showing strong potential for a bullish reversal from the long-term demand zone between $0.44 - $0.58, which has historically acted as a solid support area since 2021. Price has tested this zone multiple times and has bounced back, indicating significant buying interest.
🔍 Technical Overview:
Timeframe: Weekly (1W)
Key Support Zone: $0.44 - $0.58 (strong accumulation area)
Key Resistance Levels (Potential Targets):
$0.815
$1.392
$1.950
$2.765
$3.500+
Price Structure: Currently forming a possible double bottom or sideways accumulation near the macro support, often seen before bullish markup phases.
Bullish Signal: The yellow arrow illustrates a projected upward movement over the coming weeks/months if the support holds.
After a prolonged downtrend, SUSHI/USDT is now at a critical turning point, bouncing from a multi-year support zone. This accumulation phase may be the early stage of a major bullish trend. Traders should keep an eye on this setup as a breakout toward higher resistance levels could be imminent.
#SUSHI #SUSHIUSDT #CryptoAnalysis #Altcoins #CryptoReversal #TechnicalAnalysis #CryptoSupportResistance
#BullishReversal #CryptoSignals #PriceAction #ChartPattern
Sushiusdt

#SUSHI/USDT#SUSHI
The price is moving in a head and shoulders pattern on the 1-hour frame, adhering well to it, and is heading for a strong breakout upwards and retesting it, forming the right shoulder.
We have a bounce from the lower channel line to the right shoulder, which is support at 0.620.
We have a downtrend on the RSI indicator that is about to be broken and retested, supporting the upside.
We have a trend of consolidation above the 100 moving average.
Entry price: 0.629
First target: 0.637
Second target: 0.650
Third target: 0.666

#SUSHI/USDT#SUSHI
The price is moving within a descending channel on the 1-hour frame and is expected to break and continue upward.
We have a trend to stabilize above the 100 moving average once again.
We have a downtrend on the RSI indicator, which supports the upward move by breaking it upward.
We have a support area at the lower limit of the channel at 0.616, acting as strong support from which the price can rebound.
Entry price: 0.621
First target: 0.634
Second target: 0.643
Third target: 0.654

Sushiswap 1,2 Breakout Sequence Can Lead To New ATH (3,000% PP)On this chart and after reaching a market bottom Sushiswap produced a clear 1,2 breakout sequence. This sequence has been shown to produce a bullish wave.
You know what they say, "Third time's a charm," and we are on the third breakout from a long-term support.
1) In early June 2023 we have the first 1,2 breakout sequence which leads to a bullish wave that ended in March 204.
2) In August 2024 the same sequence again, and a new bullish wave ends December 2024 with a higher high compared to March.
3) Fast forward and bring yourself to this present day, April 2025 the same sequence starts as a higher low. "Third time's a charm." Here we are getting not only a higher high but it is possible even a new all-time high.
» Growth potential can reach 1,500%, 2,500% or even beyond 3,000%, it is still too early to say.
It is not early to know though that the market already hit bottom and is preparing to grow.
This is a good chart and a great project; an awesome opportunity. Buy and hold.
Namaste.

SUSHIUSDT 1W AnalysisSUSHI ~ 1W Analysis
#SUSHI This is the lowest support for now, buy from here with a short term target of at least 15%+ from here.

Is SUSHIUSDT About to Bounce or Break? Yello, Paradisers! SUSHIUSDT is setting up an intriguing scenario after reacting to a key resistance trendline. Let’s break this down:
💎If SUSHIUSDT shows a bullish I-CHoCH (Internal Change of Character) from the key support zone—previously a resistance level—it could signal a higher probability of a bounce. However, patience is key here; we need to wait for confirmation of a bullish I-CHoCH on lower timeframes to take action.
💎On the flip side, if the price experiences further drops or shows signs of panic selling, the best approach would be to wait for it to reach a stronger support zone. At that point, we’d need to look for bullish patterns such as A W formation or An Inverse Head and Shoulders on lower timeframes to stack the odds in our favor.
💎If the price breaks down and closes a candle below the strong support zone, it will invalidate the bullish thesis entirely. In that case, it’s smarter to wait for a clearer structure to develop before considering any entries.
🎖 Remember, Paradisers, disciplined trading is the only way to achieve long-term success. Avoid impulsive decisions and always prioritize confirmation over speculation. The market rewards patience and preparation—stay sharp, stay focused.
MyCryptoParadise
iFeel the success🌴

SUSHI Token: A High-Potential Setup You Shouldn’t IgnoreHello everyone!
A huge opportunity has emerged on the BINANCE:SUSHIUSDT chart. I’ll break down the technical analysis for SUSHI using both the Daily and 4H timeframes , highlighting key levels and potential trade setups.
On 1D timeframe
- Price has swept the liquidity below the November 2024 low , forming an inverse Head and Shoulders pattern , which is a strong bullish reversal signal.
- Price recently broke did the May high after that retraced approximately 24% . This pullback aligned perfectly with a retest of the neckline from the inverse Head and Shoulders pattern, reinforcing its validity as a bullish setup.
On 4H timeframe
- If price breaks above $0.775 , it would serve as a confirmation of bullish momentum, suggesting a likely move toward the liquidity zone above $1.00 .
- In my opinion, if market conditions remain bullish and Bitcoin continues its upward trend, SUSHI is likely to break above the $1.00 level with ease and potentially reach the inverse Head and Shoulders target around $1.20+ .
In conclusion, SUSHI is currently showing strong bullish signals, and if the broader market gives altcoins room to run, this token has the potential to rally aggressively.
Note: SUSHI is a low-cap token with high volatility, so exercise proper risk management when trading or investing.

SUSHIUSDT Potentially BullishWe've seen some pretty significant move in the the crypto market in the last few days (maybe weeks) especially wiith BINANCE:BTCUSDT hitting the 104K area. It is more than expected that most coins will follow suit.
BINANCE:SUSHIUSDT is one of such coins and as it stands, it has broken a significant zone at the 0.7175 area and attempting a retest. If the zone holds as a new found support, we just might see another significant push phase targeting the 1.32 area. Until then, fingers crossed
Updates to follow!!!
Past results does not guarantee future results

XRPUSDT UPDATE
Pattern: Falling Wedge Breakout
Current Price: \$2.5398
Target Price: \$3.90
Target % Gain: 55.29%
Technical Analysis: XRP has broken out of a falling wedge on the 1D chart with strong bullish momentum. The breakout is confirmed with a daily close above resistance and increased volume.
Time Frame: 1D
Risk Management Tip: Always use proper risk management.

SUSHIUSDT 1D AnalysisSUSHI ~ 1D Analysis
#SUSHI Buy when re -testing this support block with a short -term target of at least 10%+ from here.

SUSHIUSDT Holding Strong Support — Bullish Ahead?"SUSHIUSDT Technical analysis update.
SUSHIUSDT has respected a strong horizontal support zone for several years, as shown by multiple successful retests. Every dip into this support area has triggered a notable bounce.
Currently, SUSHI is once again bouncing off this major support, and the price action suggests potential for a larger bullish move ahead. Before the big rally price could correct, if the rally continues, then the next target $2.80–$3.40 level.

SUPERUSDT UPDATESUPERUSDT is a cryptocurrency trading at $0.5519, with a target price of $1.2000. This represents a potential gain of over 170%. The technical pattern observed is a Bullish Falling Wedge, indicating a possible trend reversal. This pattern suggests that the downward trend may be coming to an end. A breakout from the wedge could lead to a significant upward movement in price. The Bullish Falling Wedge is a positive indicator, signaling a potential price surge. Investors are showing optimism about SUPERUSDT's future performance. The current price may present a buying opportunity. Reaching the target price would result in substantial returns for investors. SUPERUSDT is positioned for a potential breakout and significant gains.

SushiSwap: Your Altcoin ChoiceAnother great chart. In December 2024 SushiSwap hit its highest price since December 2020 on a bullish move. In general, December 2024 produced the highest level since April 2022. Really something, a multiple years long high.
How are you doing today my friend in the law?
I hope you are having a wonderful day and weekend.
This is another classic chart setup and price action dynamic that I am about to show and analyze. SUSHIUSDT produced a triple-bottom on a wide, long-term consolidation (sideways) channel.
It is interesting to notice that shy higher highs have been present since October 2022. The bottom portion is mixed. Last week produced the lowest price ever based on candle close. On candle wick, this week is a higher low vs early August 2024. This is pretty much irrelevant.
Seeing a lower low, higher low, perfect double-bottom, etc., wouldn't change the bigger picture.
There is a strong correction after a descent but minor bullish wave. This correction ends at support and once the low is in a new bullish impulse will develop. Now, the preceding years the action was not really strong because these are transition years. A transition from bearish to bullish.
This year, everything changes. Instead of a small "descent" bullish wave, we will have a major bullish cycle, that is what comes next. The price now is absolutely awesome, the best possible, true All-Time Low. Once we are in with great timing and pricing, a bull market becomes really fun. When you manage to catch the bottom, all that follows is to see how your capital/profits grow.
Enjoy your life! And thank you for your continued support.
This is a great Top Altcoin Choice.
Namaste.

SUSHI is Bleeding Out — Is This the Calm Before the Final Dump? Yello, Paradisers! Have you been ignoring SUSHI lately? That might be a mistake — because the price action is showing signs that a deeper drop could be just around the corner, and those not paying attention could get caught off guard. Let’s break it down.
💎#SUSHIUSDT is still trading below both the 50 EMA and the 200 EMA, a clear confirmation that the broader market structure remains decisively bearish. The 50 EMA continues to act as dynamic resistance, repeatedly rejecting price during short-lived pullbacks, while the 200 EMA sits significantly higher, further emphasizing the strength of the existing downtrend.
💎Adding to the bearish pressure, there’s a strong supply zone between $0.620 and $0.640. This zone has capped every bullish attempt, confirming heavy distribution at these levels. Until this zone is broken with volume and conviction, upside potential remains extremely limited.
💎One key level to watch in the short-term is the 50% Fibonacci retracement at $0.586, which has turned into a reliable interim rejection level. We expect the price to tap this level again before any meaningful downside continuation is likely to unfold.
💎As long as price fails to close above the $0.568 level, the structure will remain under pressure. A breakdown below the moderate support at $0.522 would likely trigger a move into the $0.485–$0.451 major support zone, where we could see more aggressive buyers or a potential reversal setup.
💎The only scenario that would invalidate this bearish outlook is a clean breakout and sustained close above $0.640, which would reclaim the supply zone and force shorts to cover. Until then, the path of least resistance remains to the downside.
Stay focused, Paradisers. Be the hunter, not the hunted.
MyCryptoParadise
iFeel the success🌴

SUSHIUSDT 1WSUSHI ~ 1W Analysis
#SUSHI Buy gradually from here with a short -term target of at least 20%+. This is the lowest support for now.

UNIUSDT UPDATEUNIUSDT is a cryptocurrency trading at $6.780. Its target price is $10.000, indicating a potential 50%+ gain. The pattern is a Bullish Falling Wedge, a reversal pattern signaling a trend change. This pattern suggests the downward trend may be ending. A breakout from the wedge could lead to a strong upward move. The Bullish Falling Wedge is a positive signal, indicating a potential price surge. Investors are optimistic about UNIUSDT's future performance. The current price may be a buying opportunity. Reaching the target price would result in significant returns. UNIUSDT is poised for a potential breakout and substantial gains.

DOTUSDT IDEADOTUSDT is a cryptocurrency trading at $4.415. Its target price is $7.500, indicating a potential 70%+ gain. The pattern is a Bullish Falling Wedge, a reversal pattern signaling a trend change. This pattern suggests the downward trend may be ending. A breakout from the wedge could lead to a strong upward move. The Bullish Falling Wedge is a positive signal, indicating a potential price surge. Investors are optimistic about DOTUSDT's future performance. The current price may be a buying opportunity. Reaching the target price would result in significant returns. DOTUSDT is poised for a potential breakout and substantial gains.

PEPEUSDT UPDATEPEPEUSDT is a cryptocurrency trading at $0.00729. Its target price is $0.01400, indicating a potential 100%+ gain. The pattern is a Bullish Falling Wedge, a reversal pattern signaling a trend change. This pattern suggests the downward trend may be ending. A breakout from the wedge could lead to a strong upward move. The Bullish Falling Wedge is a positive signal, indicating a potential price surge. Investors are optimistic about PEPEUSDT's future performance. The current price may be a buying opportunity. Reaching the target price would result in significant returns. PEPEUSDT is poised for a potential breakout and substantial gains.

ACAUSDT UPDATEACAUSDT is a cryptocurrency trading at $0.0430. Its target price is $0.0800, indicating a potential 80%+ gain. The pattern is a Bullish Falling Wedge, a reversal pattern signaling a trend change. This pattern suggests the downward trend may be ending. A breakout from the wedge could lead to a strong upward move. The Bullish Falling Wedge is a positive signal, indicating a potential price surge. Investors are optimistic about ACAUSDT's future performance. The current price may be a buying opportunity. Reaching the target price would result in significant returns. ACAUSDT is poised for a potential breakout and substantial gains.

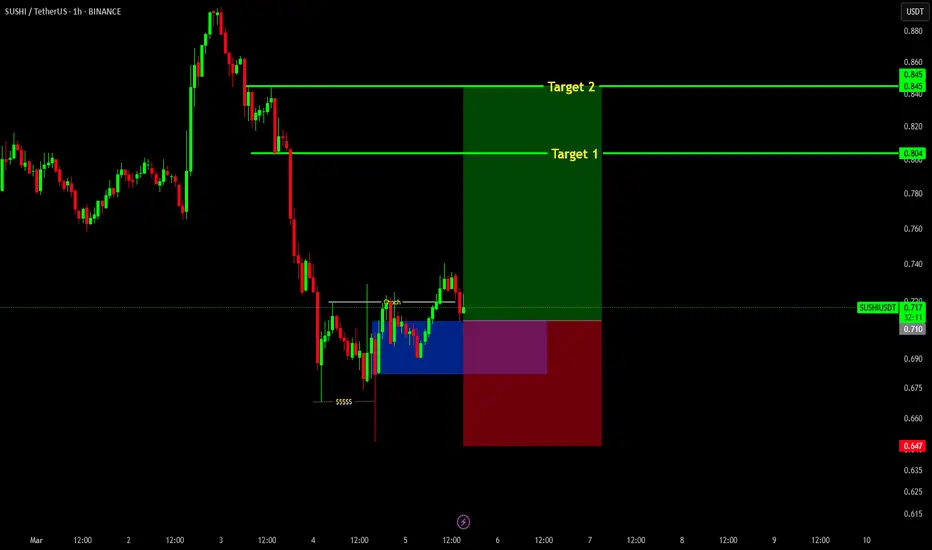
Sushi long trade setupSushi recently on 1hr time frame gave a proper ChOCh which is a bullish setup.
Entry region marked (blue box)
Stoploss at 0.647
Targets: 0.805, 0.845
UNIVERSOFSIGNALS| SUSHI: Key Levels and Market Outlook👋 Welcome to UNIVERSOFSIGNALS !
In this analysis, I want to review SUSHI for you. SushiSwap is a DeFi protocol operating in the DEX sector, with its token currently ranked 195th on CoinMarketCap and a market cap of $58 million.
📅 Weekly Timeframe
On the weekly timeframe, we can see a consolidation box between $0.534 and $1.959. Since 2022, the price has been fluctuating within this range, forming a large consolidation zone, with multiple touches to both the upper and lower boundaries of this box.
🔍 As observed, in the last bullish leg, the price broke above the box's upper boundary with a large weekly candle. However, it quickly retraced back into the range after being rejected at $2.734, resulting in a fake breakout.
🧩 Currently, the price is near the lower boundary of the range at $0.534. If this support level breaks, the price could initiate another bearish leg and move toward a new all-time low (ATL). On the other hand, if the upper boundary of the box is broken and price stabilizes above it, we could see an upward movement in SUSHI.
⚡️ The largest and most significant resistance ahead is at $20.444, which is the all-time high (ATH). Reaching this level would be extremely difficult, as it would require a significant increase in market capitalization, meaning a substantial capital inflow into the coin.
✨ Let’s now analyze the daily timeframe to gain more insight into price movement.
📅 Daily Timeframe
On the daily timeframe, as seen in the last bullish leg, the price bounced from the $0.534 support and moved upward. After breaking $0.803, strong bullish momentum entered the market. Additionally, RSI reaching the oversold zone contributed to a stronger bullish push.
🔽 Following this movement, the fake breakout at $1.855 led to the start of a corrective and bearish phase, with the price initially declining to $1.347.
📊 After breaking below $1.347 and retesting it as resistance, the price entered another bearish leg, reaching $0.803. Currently, after some range-bound movement around this level, RSI has exited the oversold zone, and the price seems to be retesting this level as resistance.
✅ If RSI re-enters the oversold zone, the price could drop further to the lower boundary of the range at $0.534, which would not be a good sign for SUSHI. As observed, buying volume has significantly decreased, and most traders in this market are sellers.
🛒 For spot buying, I recommend avoiding this coin for now and waiting for a clear bullish structure to form. At a minimum, SUSHI should start showing strength against Bitcoin.
🧲 From a USDT perspective, if the upper boundary of the range ($1.855) breaks, then $2.734 could serve as a trigger for a buying opportunity.
📝 Final Thoughts
This analysis reflects our opinions and is not financial advice.
Share your thoughts in the com

TradeCityPro | SUSHI: Key Levels and Market Outlook👋 Welcome to TradeCity Pro!
In this analysis, I want to review SUSHI for you. SushiSwap is a DeFi protocol operating in the DEX sector, with its token currently ranked 195th on CoinMarketCap and a market cap of $58 million.
📅 Weekly Timeframe
On the weekly timeframe, we can see a consolidation box between $0.534 and $1.959. Since 2022, the price has been fluctuating within this range, forming a large consolidation zone, with multiple touches to both the upper and lower boundaries of this box.
🔍 As observed, in the last bullish leg, the price broke above the box's upper boundary with a large weekly candle. However, it quickly retraced back into the range after being rejected at $2.734, resulting in a fake breakout.
🧩 Currently, the price is near the lower boundary of the range at $0.534. If this support level breaks, the price could initiate another bearish leg and move toward a new all-time low (ATL). On the other hand, if the upper boundary of the box is broken and price stabilizes above it, we could see an upward movement in SUSHI.
⚡️ The largest and most significant resistance ahead is at $20.444, which is the all-time high (ATH). Reaching this level would be extremely difficult, as it would require a significant increase in market capitalization, meaning a substantial capital inflow into the coin.
✨ Let’s now analyze the daily timeframe to gain more insight into price movement.
📅 Daily Timeframe
On the daily timeframe, as seen in the last bullish leg, the price bounced from the $0.534 support and moved upward. After breaking $0.803, strong bullish momentum entered the market. Additionally, RSI reaching the oversold zone contributed to a stronger bullish push.
🔽 Following this movement, the fake breakout at $1.855 led to the start of a corrective and bearish phase, with the price initially declining to $1.347.
📊 After breaking below $1.347 and retesting it as resistance, the price entered another bearish leg, reaching $0.803. Currently, after some range-bound movement around this level, RSI has exited the oversold zone, and the price seems to be retesting this level as resistance.
✅ If RSI re-enters the oversold zone, the price could drop further to the lower boundary of the range at $0.534, which would not be a good sign for SUSHI. As observed, buying volume has significantly decreased, and most traders in this market are sellers.
🛒 For spot buying, I recommend avoiding this coin for now and waiting for a clear bullish structure to form. At a minimum, SUSHI should start showing strength against Bitcoin.
🧲 From a USDT perspective, if the upper boundary of the range ($1.855) breaks, then $2.734 could serve as a trigger for a buying opportunity.
📝 Final Thoughts
This analysis reflects our opinions and is not financial advice.
Share your thoughts in the com

LPTUSDT UPDATELPTUSDT is a cryptocurrency trading at $7.414. Its target price is $14.000, indicating a potential 90%+ gain. The pattern is a Bullish Falling Wedge, a reversal pattern signaling a trend change. This pattern suggests the downward trend may be ending. A breakout from the wedge could lead to a strong upward move. The Bullish Falling Wedge is a positive signal, indicating a potential price surge. Investors are optimistic about LPTUSDT's future performance. The current price may be a buying opportunity. Reaching the target price would result in significant returns. LPTUSDT is poised for a potential breakout and substantial gains.
