[Deep Dive] SUSHI – Edition 3: Accumulate. Anticipate. Accelerat🧠 Cycle Anatomy: What the Chart Is Telling Us
📉 Phase 1: Markdown
The bears dominated, slicing price downward into key historical support around the $0.50 mark — the same level that anchored the previous accumulation zone.
📦 Phase 2: Accumulation
Both accumulation phases (mid-2023 and Q2 2025) occurred near identical support zones, with rounded bases and sideways chop — signaling strong hands quietly absorbing supply.
📈 Phase 3: Markup Incoming?
Following breakout point “1” and retest point “2,” the current structure aligns remarkably well with the previous markup phase — which propelled SUSHI from ~$0.50 to over $3 in just weeks. While past performance isn’t a guarantee, this fractal deserves attention.
🔥 Why Fundamentals May Support This Move
- SushiSwap v3 continues rolling out on multiple chains, optimizing capital efficiency and fee structure for LPs.
- Governance has stabilized after the rough patches of 2022–2023, with more transparent treasury and development direction.
- Cross-chain expansion and integrations with major aggregators (like 1inch, Matcha, and DeBank) are boosting SUSHI’s visibility in the broader DeFi flow.
Additionally, a surge in TVL and DEX activity on low-fee chains could redirect volume back to SushiSwap — a platform known for its cross-chain capabilities.
📍 What to Watch Next
- A confirmed breakout above $1.00 would validate the “markup” thesis.
- A dip toward the $0.65–$0.70 zone could offer a high-risk/reward entry aligned with point “2.”
- Failure to hold the $0.50 level would invalidate the structure.
For now, the rhythm is clear: markdown → accumulation → markup. And if the pattern holds, SUSHI might just be preparing for its third vertical.
💬 Do you think this is just another fakeout — or is SUSHI gearing up for a DeFi comeback?
🔔 Disclaimer: This post is for educational and informational purposes only. It does not constitute financial advice. Always do your own research and manage risk carefully.
📚 Always follow your trading plan => including entry, risk management, and trade execution.
Good luck!
All strategies are good, if managed properly.
~ Richard Nasr
SWAP

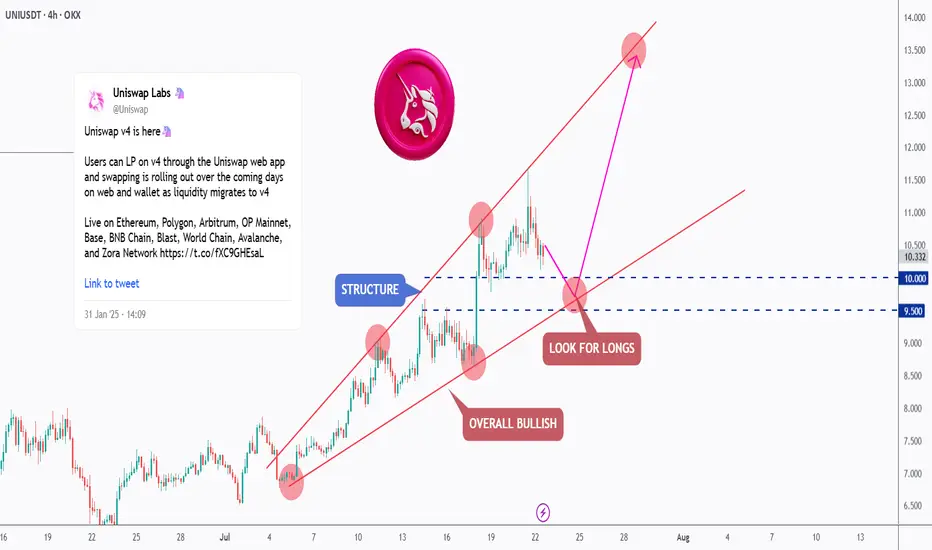
[Deep Dive] UNI – Edition 1: Retest. Reload. Rally?Uniswap (UNI) has been trading within a well-respected rising channel, showing consistent bullish structure across the 4H timeframe.
After a strong rally from the $7.50 region, price is now undergoing a healthy correction — retesting the lower boundary of the channel, which intersects with the $9.50–$10.00 demand zone.
📐 Technical Outlook
The market has printed a series of higher highs and higher lows, confirming the bullish momentum. The recent correction is testing a key support structure — previously a resistance zone — and this confluence aligns perfectly with the channel’s lower bound.
As long as this zone holds, UNI is well-positioned for a continuation toward the $13–$14 region, in line with the pink projected path.
🔥 Fundamental Boost
Uniswap has recently launched its V4 upgrade, introducing "hooks" — customizable smart contracts that allow developers to build more complex DeFi logic directly within liquidity pools. This upgrade not only enhances flexibility and capital efficiency, but also reduces gas costs — making Uniswap an even more dominant player in the DEX ecosystem.
Additionally, with Ethereum L2 adoption growing and Uniswap expanding across multiple chains (Arbitrum, Base, and Optimism), protocol usage and fees are on the rise again.
The UNI token may soon benefit from the proposed fee switch, which would redirect a portion of protocol fees to token holders — potentially adding new value accrual mechanics.
🟢 Conclusion
The technicals and fundamentals are aligning. UNI is in a bullish structure, trading at a key area of interest, and the latest upgrades may unlock new growth for the ecosystem.
Traders and investors alike should keep a close eye on this zone for long opportunities, as the next impulse could be just around the corner.
💬 What do you think — is UNI ready to break toward new highs, or will the demand zone fail? Let me know in the comments 👇
🔔 Disclaimer: This analysis is for educational and informational purposes only. It does not constitute financial advice or a recommendation to buy or sell any asset. Always do your own research and manage your risk accordingly.
📚 Always follow your trading plan => including entry, risk management, and trade execution.
Good luck!
All strategies are good, if managed properly.
~ Richard Nasr
Navigating the Complexities of Forex Swap RatesNavigating the Complexities of Forex Swap Rates
Forex swap rates, pivotal in currency trading, reflect the cost of holding a position overnight. This article unpacks swaps, offering clarity on their calculation and impact. Even seasoned traders may be confused with the complexity of swaps. It’s vital to learn about how these costs relate to effective strategy and fee management. Dive into the complexities of forex swaps and learn how they can influence decisions and overall performance in the ever-evolving trading world.
Understanding Forex Swap Rates
For traders, understanding forex market swap rates is crucial. A swap is essentially the interest differential paid or charged to a trader when they hold a position overnight. The concept hinges on the idea that when you trade currencies, you are effectively borrowing one currency to buy another. Hence, these rates come into play, reflecting the cost of the process.
The swap rate definition boils down to the interest rate difference between the two currencies involved in a trade. For instance, if you are going long in a pair like EUR/USD, the swap rate would be determined by the difference in interest rates set by the European Central Bank and the Federal Reserve. If the borrowing cost of the euro is lower than that of the dollar, holding the EUR/USD pair overnight would typically result in a charge. Conversely, if the euro has a higher borrowing cost, you might see your balance credited.
Calculating swaps involves a straightforward formula:
Swap rate = (Contract size × Interest differential) ÷ 365
This calculation takes into account the size of your position and the interest rate difference, providing a daily cost or gain for holding the position. Understanding these costs is vital when it comes to managing trading expenses and strategy in the forex market.
Key Elements Influencing Swap Rates
Several factors play pivotal roles in determining overnight swap rates in the forex market.
1. Interest Rate Differentials: The primary driver of overnight rates, interest differentials stem from the varying monetary policies of central banks. For example, if the Bank of England has a higher lending rate than the Federal Reserve, a buy trade in GBP/USD could mean earning for maintaining the position overnight.
2. Market Conditions: Economic stability, political events, and financial market volatility can significantly impact overnight charges. During periods of high volatility or geopolitical uncertainty, rates may fluctuate more dramatically, reflecting the increased market risk.
3. Liquidity: The level of liquidity in the market often influences overnight costs. In less liquid markets and less commonly traded pairs, higher swaps might be charged due to the increased cost of facilitating these trades.
4. Broker Policies: Different forex brokers might have varying policies and calculations for their own swaps. These differences usually arise from the brokers' own pricing structures, risk management strategies, and competitive positioning in the market. As such, traders should be aware that overnight charges vary from broker to broker.
Types of Forex Swaps
There are primarily two types of swaps that traders may encounter, each serving distinct purposes and offering unique implications for trading strategies.
1. Interest Swaps: These involve the exchange of interest payments between parties. In forex, it typically manifests as the fee a trader pays or receives for holding a position overnight. They directly impact the cost of maintaining open positions in different pairs.
2. Currency Swaps (Cross-Currency Swaps): Also known as a currency rate swap, this involves exchanging principal and interest payments in two different currencies. While less common in everyday retail forex activities, they are important in managing currency exposure and risk, particularly in hedging strategies. Currency swaps are used to secure a predetermined exchange rate for a specified currency amount while incorporating a benchmarked or fixed interest rate. This type is usually used by corporations or brokers.
Regarding fixed swap rates, they are less common in the forex market compared to the more prevalent floating swap rates. They’re often used in less volatile financial environments and typically find their application in long-term financial instruments or corporate finance rather than in the day-to-day trading of currencies.
Strategies for Managing Swap Rates
Management of swaps in forex involves several key strategies:
- Short-term Trading: By closing positions before the end of the trading day, traders can avoid incurring overnight fees altogether. It’s a so-called day trading since positions are typically closed by the end of the day.
- Hedging: Implementing hedging strategies may mitigate overnight fees. This involves opening opposite positions in correlated pairs, thus potentially balancing the amounts paid and received.
- Economic Calendar Awareness: Staying informed about major economic announcements and central bank decisions often helps traders anticipate changes in borrowing costs.
- Broker Selection: Choosing the right broker is critical. Selecting a broker with favourable rates might significantly reduce trading fees, especially for those holding long-term positions.
Practical Implications for Traders
Understanding and managing these charges has direct implications for traders' strategies and overall performance. Key considerations include:
- Carry Trading: A carry trade strategy entails borrowing in a currency with a lower interest rate and investing in another with a higher yield. Traders take advantage of the interest differential but must be mindful of potential fees.
- Rollover Costs: Traders holding positions overnight need to account for rollover costs, which can either erode or enhance returns, depending on the direction of the trade and the prevailing swap rates.
- Currency Exposure Management: Swap rates affect the overall cost of maintaining a position. Traders need to balance the potential advantages of holding a position against the charges incurred.
The Bottom Line
Mastering swap rates is a cornerstone of trade management. A thorough understanding may empower traders to navigate these costs and potentially improve their strategies. By carefully considering factors like interest differentials and broker policies, traders may manage their trades and overall performance more effectively.
This article represents the opinion of the Companies operating under the FXOpen brand only. It is not to be construed as an offer, solicitation, or recommendation with respect to products and services provided by the Companies operating under the FXOpen brand, nor is it to be considered financial advice.

DON'T MISS VELAS AT THIS DISCOUNT PRICES - STILL ACTIVE PROJECTTECHNICAL ANALYSIS AND TRADE PLAN FOR VELAS
Chart Overview
Timeframe: The analysis is conducted on a 4-hour chart, providing mid-term insights.
Pattern Identified: A falling wedge, a bullish reversal pattern, suggests an impending breakout to the upside.
Current Price: Approximately $0.0065564 at the time of analysis.
Volume Analysis: Declining volume indicates price compression, which typically precedes a breakout.
Key Levels
Support Zone (Discount Area): Around $0.0058–$0.0060.
Resistance Zone (Premium Area): First resistance at $0.0080 and a major zone at $0.0100–$0.0120.
Previous Highs (Targets): $0.0140, $0.0220.
Indicators:
RSI (Relative Strength Index): Showing oversold conditions, supporting a reversal.
Stochastic Oscillator: Near bottom levels, indicating a potential bullish crossover.
Volume Oscillator: Low activity with potential for volume surge on breakout.
Price Action:
A series of lower highs and lower lows confirms the falling wedge.
Breakout from the wedge is expected as the price nears the apex, combined with reduced bearish momentum.
Market Sentiment and Team Progress:
The Velas team, led by Alex Alexandrov, is working hard and smart to drive the project forward. Recent updates reveal positive developments and growing confidence in Velas 2.0, as highlighted on their official Twitter account.
According to Accumulated Finance, VLX has strong potential due to its innovative subchain technology and enhanced ecosystem.
Trading Plan
1. Entry Strategy:
Initial Entry (Aggressive): Enter around the current price ($0.0065) with a smaller position to catch the breakout early.
Confirmation Entry (Conservative): Wait for a confirmed breakout above $0.0070 with strong volume before entering a larger position.
2. Take-Profit Targets:
Short-Term Target: $0.0080 (Resistance Zone).
Medium-Term Target: $0.0100 (Major Resistance).
Long-Term Target: $0.0140 and $0.0220 (Key Fibonacci levels and previous swing highs).
3. Stop-Loss Placement:
Initial Stop-Loss: Below $0.0055 (below the wedge support).
Trailing Stop: Move the stop-loss to break-even after a breakout above $0.0080 and trail below each significant swing low.
4. Risk Management:
Allocate no more than 2% of total trading capital to the initial position.
Use position sizing to ensure the maximum loss (based on stop-loss placement) does not exceed predefined risk tolerance.
5. Monitoring Plan:
Volume: A breakout without increased volume may signal a false breakout. Wait for confirmation.
Momentum Indicators: RSI and stochastic should support the move; divergence against the price could invalidate the setup.
Market Conditions: Monitor Bitcoin and general market sentiment, as they can influence VLX price movements.
6. Scaling Strategy:
Add to Position: On a confirmed breakout with high volume above $0.0075, add to the position during retests of support.
Partial Profit-Taking: Secure 50% of profits at $0.0100 and let the rest ride towards higher targets with a trailing stop.
The falling wedge pattern and supporting indicators suggest a strong potential for bullish momentum in the short-to-medium term. The dedication and smart efforts of Alex Alexandrov and his team, combined with the positive momentum from Velas 2.0 and its latest announcements, align with a promising future for VLX.

Uniswap (UNI)UNI/USDT Analysis 📊
UNI is one of the significant assets in the cryptocurrency world, attracting considerable attention from investors due to its high trading volume and dynamic network. This analysis aims to examine UNI's price movement within an ascending channel and highlight potential trading opportunities:
⚖️ Current Status:
Recent Correction:
After hitting the top of the ascending channel, UNI has corrected towards the 0.5 Fibonacci level (between $11.5 and $11.1), which overlaps with the channel's middle line.
This overlap is significant for traders, as it confirms the strength of support and resistance in this range.
Key Supports:
Two grey zones at the bottom of the chart are considered vital support areas:
$5.2 to $6
$3.6 to $4
These zones are recognized as strong support areas due to the multiple reactions of the price in the past. In UNI's trading history, these levels have successfully prevented sharp declines and have created high demand in these ranges. Additionally, the presence of large buyers in these areas shows their credibility.
RSI and Divergences:
The RSI is currently in an ascending channel, but it recently reversed before reaching the top of the RSI channel, forming a negative divergence. In the past, such divergences have often led to temporary corrections or even trend reversals in UNI's price. These behaviors suggest that traders should pay close attention to these signals, as they could play a key role in trading decisions.
This divergence indicates that a temporary price correction may occur or even a signal for a broader trend change.
🔎 Potential Scenarios:
Bullish Scenario:
If the price manages to stabilize above the red resistance zone (weekly resistance):
Fibonacci targets become attainable:
1.618 Fibonacci: $22 to $24
2.272 Fibonacci: $37 to $41
2.618 Fibonacci: $49 to $61
Bearish Scenario:
If the price fails to stabilize above the red resistance zone:
A correction down to the 0.618 Fibonacci level (between $9.4 and $10.3) is likely.
If the Fibonacci levels break down, the price may drop towards the bottom of the ascending channel (between $7.2 and $8).
⚡️ Key Takeaways:
Price stabilization above the red resistance zone is crucial for continuing the upward trend. Factors like increasing trading volume while attempting to break this resistance and positive news regarding UNI or the crypto market could assist in breaking this level. Indicators to watch include the formation of strong bullish candlesticks, significant volume spikes, and positive divergence in technical indicators like RSI.
Pay close attention to the negative RSI divergence, as it may signal a deeper correction.
The grey support zones will act as primary price defenses.
Traders should closely monitor price behavior near the middle line of the channel.
A strong breakout above the red resistance zone with high volume could confirm an entry signal.
🔔 Summary:
In the UNI analysis, the price behavior at the red resistance zone is key. If this resistance is broken, higher targets are expected. However, if the price fails to break this resistance, a correction towards lower Fibonacci levels and even the bottom of the channel is possible. Additionally, the RSI divergence serves as a warning for traders to follow the market's behavior more cautiously.
🔴 Practical Recommendation:
Traders should enter the market with a risk management strategy, and diversifying their capital can be highly beneficial to avoid unexpected risks. Furthermore, stay updated with analysis revisions.
⏰ Stay tuned for further updates and more detailed analysis!

PanCake swap (cake)Cake usdt Daily analysis
Time frame daily
Risk rewards ratio >1.7 👈👌
Target 7.4
PancakeSwap’s “head chef” declared that the BSC-based DEX is retaining the deflationary tokenomics for its native CAKE token. The announcement comes as other DEXs are trying new incentives for staking their native assets.
The leading DEX on Binance Smart Chain is making a return amid a general DeFi recovery, and it shared that it will retain CAKE as a deflationary token to retain its value. The DEX decided against using CAKE as an incentive token, instead renewing its tokenomics based on regular burns and deflation.
CAKE has a 1-2% annual burn rate and a negative net growth in the past 12 months. PancakeSwap also has regular weekly burns, which give a glimpse into the activity and fees generated on several PancakeSwap markets, including predictions and NFTs.

WAGYUSWAP IS ON THE MOVE - EXPECT UNEXPECTEDChart Overview
Timeframe: 4-hour chart
The price is trading within a square trading channel, indicating a consolidation phase. This could signal the market is in a period of indecision, with potential for either a breakout or breakdown.
The price is currently approaching the lower boundary of the range, indicating that a bounce might be possible or further price testing may occur before any breakout.
Key Levels
Resistance: The price has been rejected multiple times near 0.0015419 and 0.0013976, creating a clear resistance zone.
Support: The price is finding support near 0.0012548, a level it has tested recently and managed to bounce from, showing some strength in the market.
Volume
Volume Trend: The trading volume is currently lower compared to previous spikes, which typically signals lower market participation. This suggests the market is waiting for a catalyst (likely a breakout or a shift in sentiment) before it can decide on the next move.
Indicators
VMC Cipher B Divergences: This indicator shows some divergence between the price and momentum, hinting that the price may be losing some strength in its current trend, which could signal a potential reversal.
RSI (Relative Strength Index): Currently at 55.5, the RSI is neutral, indicating there is no extreme overbought or oversold condition. It is waiting for more price movement to confirm whether the trend will continue or reverse.
Stochastic Oscillator: The stochastic is at 27/71, suggesting a slightly oversold condition. This could indicate a potential buying opportunity if the price tests the support again or breaks higher.
Trading Plan
Scenario 1: Breakout Above Resistance (Bullish)
Entry Point: If the price breaks above 0.0015419 and holds above it, this could indicate the start of an uptrend.
Target: The next resistance zone lies around 0.00166. This could be your first target.
Stop Loss: Place the stop just below the previous support level of 0.0012548 (around 0.0012) to limit risk if the breakout fails.
Scenario 2: Bounce from Support (Bullish Reversal)
Entry Point: A potential entry could be near the 0.0012548 support level if the price shows signs of bouncing off this zone with higher volume or confirmation from the RSI or stochastic oscillators.
Target: The target would be the 0.0013976 resistance level, with a potential continuation towards 0.0015419.
Stop Loss: Place the stop just below 0.0012 to protect from a further breakdown if the support level fails.
Scenario 3: Breakdown Below Support (Bearish)
Entry Point: If the price breaks below 0.0012548 and shows no signs of reversal, this could indicate a continuation of the downtrend.
Target: The next support level lies around 0.001166.
Stop Loss: The stop should be placed just above 0.0013976 resistance level to protect from any unexpected upward movement.
Risk Management
Position Sizing: Adjust your position size based on your risk tolerance and stop loss distance. Never risk more than 2% of your account balance on a single trade.
Monitor Volume: Ensure that any breakout or breakdown is accompanied by an increase in volume, which helps confirm the validity of the price movement.
Additional Considerations
Watch for the broader market trends as cryptocurrency markets can be highly correlated. Look for any major news or events that could affect overall market sentiment.
Keep an eye on the broader trend, using higher timeframes like the daily chart for confirmation.

(SWFTC) swft blockchain "most active in China"
data according to www.crunchbase.com, data measured monthly.
most active in China.

XAUUSD Short Opportunity: Bearish Momentum AheadGold (XAUUSD) has recently shown signs of a potential downturn. After reaching a significant resistance level, we are seeing bearish patterns indicating a possible shorting opportunity.
With the current market setup, a short position on XAUUSD appears promising. However, it's crucial to stay updated with market news and economic indicators that could affect gold prices.

Spotting a Bull Flag Pattern in Wave Coin (But Stay Cautious)Wave Coin is currently showing a promising bull flag pattern on the chart. This pattern typically indicates a continuation of the previous uptrend, suggesting potential for further gains. However, it's important to stay cautious as the price could also fall if the pattern fails to hold. The consolidation phase within the flag gives a chance to enter the market before the next breakout, but be mindful of key support and resistance levels. Always use stop-loss orders to protect your position and trade wisely!"

Trading opportunity for BONEUSDT (Long term)Based on technical factors there is a Buy position in :
📊 BONEUSDT
🔵 Buy Now
🪫Stop loss 0.440000
🔋Target 1 0.711000
🔋Target 2 0.953000
🔋Target 3 1.418000
💸RISK : 1%
We hope it is profitable for you ❤️
Please support our activity with your likes👍 and comments📝

GIFT - NIFTY AT Swap Flag LimtGIFT made a bearish swap FL and engulfed major PAZs Currently price at swap level with trendline resistance and Weekly resistance .
Most probably it will fall and make new low.
Will be invalid ONLY if make new HH

Educational: Unlocking passive income through swaps/rolloverIn this publication, we will go into a strategy for generating passive income within the forex market, irrespective of market direction. While traditional trading methods often rely on correctly predicting market directions, what if there was a way to earn without speculating on market movements? Surprisingly, such an avenue exists, and it involves capitalizing on daily swap/rollover fees through leveraging negative correlation between currency pairs.
🔷What are swaps?
In the forex market, a swap, also known as a rollover or overnight interest, refers to the interest rate differential between two currencies that are part of a currency pair. When you trade forex, you are essentially borrowing one currency to buy another. Each currency in a pair has an associated interest rate set by the central bank of its respective country.
Current interest rates.
How a forex trade works.
Swaps are incurred when a forex position is held overnight or over the weekend. Since forex trading operates 24 hours a day, except on weekends, trades held beyond the daily cutoff time (usually around 5 p.m. EST) are subject to swaps.
When you open a forex trade, you are simultaneously buying one currency and selling another. Each currency has its own interest rate. If the interest rate on the currency you are buying is higher than the interest rate on the currency you are selling, you will earn a positive swap. Conversely, if the interest rate on the currency you are selling is higher than the interest rate on the currency you are buying, you will incur a negative swap.
Swaps are calculated based on the notional value of the trade, which is the size of the position you are trading. The notional value is multiplied by the swap rate, which is the interest rate differential, and then adjusted for any applicable broker fees or commissions. The resulting amount is either added or subtracted from your trading account at the end of the trading day.
It's important to note that swaps are not always interest rate differentials. In some cases, they may also include other costs such as administrative fees or adjustments related to market conditions.
🔷How to know if your trade has positive or negative swap.
You can find this out before executing a trade in the platform you are using to execute the trade. One of the most popular platforms in the forex retail industry is MT4 and MT5 (MetaTrader 4/5) I will show you to to locate the rates in these platforms but note that this data is available regardless of the trading platform. If you are not sure how to find this in your platform simply reach out to your broker.
1: Open your MetaTrader 4/5 platform and open your market watchlist
2: Right click on the the pair you are interested in and go to "specifications"
3: An additional window should now open showing additional information on the pair. Scroll all the way down and you will find swap details. Now here you can see Swap Long and Swap Short indicating if you open a buy or sell position, if you will earn positive swap or negative swaps
Now at this point you are probably saying "Okay fine, but even if I am earning a positive swap for holding a short position on OANDA:EURUSD if the trade goes against me I will lose a lot more than I will earn" And that is true. So now for the other part of earning passively without worrying about the trade direction.
🔷Correlation in the forex market
Correlation in the forex market refers to the statistical relationship between the price movements of two or more currency pairs. It measures the degree to which the pairs move in relation to each other.
Positive correlation : A positive correlation means that two currency pairs tend to move in the same direction
Positive correlation : A positive correlation means that two currency pairs tend to move in the same direction
Zero correlation : A correlation coefficient of zero (0) indicates no significant relationship between the currency pairs. In this case, the price movements of the pairs are independent of each other.
Correlation can be measured over different time periods, such as daily, weekly, or monthly. Short-term correlations may differ from long-term correlations due to changing market conditions and events. For our purposes we care about daily and above correlation.
🔷How to check correlation of pairs
Out of respect for TradingView and their house rules I will not recommend any specific websites in order to check correlation of pairs but there are a number of websites out there that will advise on the negative or positive correlation of pairs in relation to others. There are also scripts here on TradingView that will do that calculation for you. Below is a image of pairs and there current correlation. BUT DO NOTE THAT CORRELATION CHANGES OVERTIME AS MARKET CONDITIONS SHIFT AND YOU SHOULD CHECK CORRELATIONS DAILY OR WEEKLY
The image above gives an idea as to how these correlation charts will look, where a higher percentage indicates strong correlation and lower indicating weak correlation.
🔷Setting up passive earning via swaps
Currently, our focus lies on identifying a currency pair exhibiting a positive swap and a negative correlation with another currency pair that also possesses a positive swap. This holds particular significance in our analysis. Alternatively, we can seek a currency pair with a positive swap alongside a currency pair with a negative swap, provided that the positive swap surpasses the negative swap.
Here is an example.
OANDA:NZDJPY has a positive swap if we are to open a buy position.
So what we need is a pair that is negatively correlated to OANDA:NZDJPY but has a positive swap on shorts or a lower negative swaps on the shorts
Lets look at pairs negatively correlated with OANDA:NZDJPY
We can check the correlation based on different timeframes. Remember that the more a pair is negatively correlated, the better for our strategy. For demonstration purposes we will use the daily timeframe. In this case it's OANDA:EURNZD with a 71.6% negative correlation. Note the daily timeframe for OANDA:EURCZK has a higher negative correlation of 82.7% which would be better for our strategy. ( We are not using that pair only because my broker does not offer that pairs for trading)
We can also see that OANDA:EURNZD has a positive swap for shorts :
Okay so the next thing we need to look at is the negative correlation historically overtime to see how long the pairs have remain negatively correlated in the past.
In the depicted images, we observe that the daily timeframe predominantly exhibits a negative correlation over the course of the year, with a brief period of positive correlation occurring in March and May. Conversely, the weekly timeframe has consistently demonstrated a negative correlation since 2021.
Before proceeding with our trades, I highly recommend referencing the charts of both currency pairs to visually assess their correlation on the mentioned timeframes. This will provide you with a clearer understanding of what to anticipate. Please find the illustration below showcasing the correlation between the pairs on the specified timeframes.
So as you can see in the images above the correlation is not 1-1 in terms of price movements but in general the pairs move opposite to each other and this is what we want.
Now what you need to do is simply execute your trades based on your preferred risk profile. The larger your position is on both pairs the more your will earn daily via swaps, you need to execute using the same size lot size on both pairs. For our example you would execute a buy on OANDA:NZDJPY and a sell on OANDA:EURNZD
This approach presents a method of generating passive income without relying on predicting future price movements or attempting to outperform the markets. While there may be periods when your account balance shows a negative value, the concept behind this strategy lies in the negative correlation between the selected currency pairs. Over time, these pairs are expected to offset losses on either side, resulting in minimal overall gains or losses, assuming the negative correlation remains intact.
To ensure the ongoing viability of this strategy, it is crucial to regularly monitor the correlation between the pairs on a weekly basis. When the correlation approaches zero, caution is advised. Monitoring market fundamentals, particularly interest rates, is essential as they greatly influence the correlation between markets.
Through the accumulation of swap profits over time, the goal is for the total profits from swaps to outweigh the overall risk involved in maintaining these positions.
It's important to note that while this approach emphasizes a more passive trading style, it still requires active monitoring and attention to market conditions to ensure the expected correlation and swap profits are maintained.
Positives of this investment strategy:
🔸Passive Income: By trading swaps and holding positions over time, you can potentially earn passive income through positive swap rates. This income adds to your overall trading profits without requiring active trading or predicting price movements.
🔸Diversification: Trading swaps allows you to diversify your trading portfolio and reduce risk. By selecting currency pairs with different interest rates and correlation patterns, you can offset potential losses in one position with gains from another.
🔸Potential Long-Term Profits: Over time, as swap profits accumulate, they can contribute to your overall trading profits. This can be particularly beneficial for traders with a long-term investment horizon.
🔸Reduced Focus on Short-Term Price Movements: Trading swaps shifts the focus away from constantly monitoring short-term price fluctuations. Instead, you can concentrate on macroeconomic factors, interest rate differentials, and correlation patterns that affect the swaps and overall profitability.
Negatives:
🔸Market Risk: Although trading swaps can provide passive income, it does not eliminate market risk. Currency prices can still experience significant volatility, economic events can impact interest rates and correlations, and unexpected market developments can affect swap rates and profitability.
🔸Swap Rates Fluctuations: Swap rates are subject to change based on various factors, including central bank decisions, economic data releases, and market conditions. Fluctuations in swap rates can affect your expected income and overall profitability.
🔸Potential Losses: Although the aim is to minimize losses through negative correlation, there may still be occasions when both positions experience losses simultaneously. Negative correlation does not guarantee complete protection against losses, particularly during periods of high market volatility or unexpected events.
🔸Monitoring and Administration: Trading swaps requires ongoing monitoring of correlation patterns, interest rates, and swap rates. It also involves administrative tasks, such as calculating and tracking swap income and adjusting positions as necessary.
It is important to thoroughly understand the risks and benefits of trading swaps and earning over time before implementing this strategy. Consider your risk tolerance, trading goals, and the suitability of this approach within your overall trading strategy. THIS IS NOT INVESTMENT ADVISE.

1INCHUSDT CAN BREAK UP- Daily Timeframe1INCHusdt ready for potential break up
volume increasing
RSI diversion
OVERSOLD from long time
BB squeeze
wait for the confirmaion
i will update the stop loss/entry and exit once confirmed.


US30 23 of JuneThe supply zone become a demand zone, swap happened. Price retested it and then it flew.

PancakeSwap CAKE Price Targets and Stop LossCAKE/USDT
Entry Range: $5.44 - 6.51
Price Target 1: $7.25
Price Target 2: $8.85
Price Target 3: $10.50
Stop Loss: $5.40

Pancake FlipPancake flip complete. Now it's time to stack your plate and prepare for Syrup !
- BreadCharts

Asset Classes - Part 3 - For beginnersToday we prepared for you 3rd part of our paper on asset classes for beginners. Purpose of this paper is to concisely detail futures contracts, forwards, swaps and options.
Asset Classes - Part 1 and 2 - For beginners
Feel welcome to read part 1 and part 2 if you have not yet.
Derivative
Derivative is a type of financial asset which derives its value from an underlying asset or group of assets, or benchmark. Underlying assets for derivative contracts can be, for example, stocks, commodities, currencies, bonds, etc. Derivatives are traded on a stock market exchange or over-the-counter (OTC). They can be used as investment vehicles, speculative vehicles and even as hedge against the risk. Additionally, derivatives often allow for use of leverage. Most common derivatives are futures contracts, options, forwards and swaps.
Illustration 1.01
Illustration 1.01 shows the daily graph of gold in USD.
Futures contracts
Futures contract is a standardized derivative that is publicly traded on a stock market exchange. It binds two parties together which are obligated to exchange an asset at a predetermined future date and price (without regard to current value). Expiration date is used to differentiate between particular futures contracts. For example, there may be a corn futures contract with expiration in April and then another corn futures contract with expiration in May. On a day of expiry, also called delivery, the exchange of an asset between the two parties is enforced. Underlying assets for futures contracts can be stocks, commodities, indexes, etc.
Forwards
Forward contract is a derivative contract between two parties to buy or sell an asset at a specified price on a future date. Unlike futures contracts, forward contracts are not standardized. They are customizable and traded over-the-counter rather than at a stock market exchange.
Illustration 1.02
Illustration above depicts the daily graph of continuous futures for gold. It is clearly visible that the gold chart in USD and gold continuous futures chart are resemblant.
Swaps
Swap is another form of derivative contract that binds two parties to exchange cash flows. There are currency swaps and interest rate swaps. Currency swap is defined as the exchange of an amount in one currency for the same amount in another currency. Interest rate swaps are defined by exchange of interest rate payments.
Illustration 1.03
Picture above shows daily graph of S&P500 continuous futures.
Options
Option is a type of financial asset that gives a buyer the right to buy or sell an underlying asset at a predetermined price and date. Options differ from futures contracts in that they do not oblige parties to exchange an underlying asset. There are European-style options and American-style options. European-style options can be exercised only on a date of expiry while American-style options can be exercised at any time before this date. Options that give a buyer the right to buy an underlying asset are called call options. Contrary to that, the put options give a buyer the right to sell the underlying asset. Options are very complex as they involve option risk metrics, so called greeks.
DISCLAIMER: This content serves solely educational purposes.

SUSHI is inexpensive at ~$8 *Yum (SUSHI-USDT)🍣🍣🍣🍣🍣
😲 (Sushi is very cheap right now,) currently rank #108 CMC.
Wait until price breaks structure to confirm uptrend.
For fundamentals on one of my favorite altcoins SUSHI (SushiSwap,) see ideas linked in post.
Bull targets are marked by lines of 🍣🍣 on chart.
SushiSwap gas fees are a little high 😖, don't worry though, you can avoid this by using the Polygon chain on SushiSwap.🆗👍
lower TF headed for breakout. Let's see if we can breakout and retest for good entry.
Although BTC still has main dominance in the market and is looking bullish, Sushi is correlational to ETH, which is looking strong as well.
💎
Let's go SUSHI.🏁
📈💲
Thank you
🛑🛑🛑This is not financial advice🛑🛑🛑 Above are approximate targets based on fibs etc. I always recommend looking at multiple charts when making a big investment!
Always have a stop loss ✋🛑💲 set
Any thoughts 💭💡, questions 🙋♀️🙋♂️❓, good 👍, bad👎, happy 😄 or sad 😥, in the comments always welcome.
🐶

Let them eat CAKE!Right now we could see a nice falling wedge after a bearish Crab Harmonic Pattern that after it reached the pcz, retraced to the .618 fib level from which it has been holding as support for 6 weeks now. Yes it struggled at the 200 day sma but it never dumped and created alot of support by doin so.
Rn Cake is perfect for a trade because its very easy to manage risk at these levels. A close below 17.80$ could signal more downside on CAKEUSDT but if it manages to break the supply line of the potential falling wedge it could end this consolidation/accumulation at high levels and sideways movement with a big bullish engulfing candle in the next days or even hours.
Stop losses are manual because we always want a candle close confirmation
b4 selling.
Today i learned a valuable TA Lesson i used the same chart for the last months for CAKEUSDT. I always studied the same CAKEBUSD chart which was cluttered with drawings which made me biased. i never hid all my drawing or looked at a clean chart which was a distraction from developments that happened on the Chart. From now on i will take a fresh look at stuff and also focus on the most important drawings and start hiding stuff more often while charting.

I won't miss QuickUsdtDo your own research about #Quickswap; I personally like it.
If you agree with me, I think prices around $405 would be a good point to enter.
Despite the targets on the chart, I will hold some until the end of the bull run; there are prices to be explored.
#Quick storm is coming.
Manage your risk, don't risk more than you can afford to lose. Always #dyor.
Good luck.

Holochain Pump incoming 0.019?!!I think hot is almost ready for another pump ! Be Ready for it .
i think we can go to 0.0185-0.0190 this time
trade safe
