EURUSD is very bullsih buy!
Hello,Friends!
EURUSD current trading paterns are clearly pointing in the direction of a long
That is why I am bullsih on the EURUSD pair
And I think it will go up
Like and subscribe and comment my ideas if you like them!
Swing-trading

AUDUSD is very bearish short!
Hello,Friends!
AUDUSD is bearish right now and I think the market conditions are right
for the move down
Therefore, i think it is sensible to go short
Like and subscribe and comment my ideas if you like them!

USDCAD is very bearish sell!
Hello,Friends!
In this market situation, I am looking at mutiple indicators
And I can see bearish momentum accumulating on the pair right now
This setiment makes me bearish biased and I am considering a short
Like and subscribe and comment my ideas if you like them!

CHFJPY is going down short!
Hello,Friends!
Based on the technical analysis, and the recent minor fundamental news
CHFJPY looks bearish to me overall.
I think marketmakers will be pushing the pair down
That is why we are going short
Like and subscribe and comment my ideas if you like them!

EURGBP Will grow long!
Hello,Friends!
EURGBP is bullish right now and I think the market conditions are right
for the move up
Therefore, i think it is sensible to go long
Like and subscribe and comment my ideas if you like them!

FDAX analysis: turnaround dates and important zonesCurrent analysis of the FDAX - view in the H4 chart
After reaching the all-time high on June 14th (at 15,806 points), there was a lasting break in the upward trend channel when the turnaround date arrived on June 18. Since then the FDAX has been in a correction mode, which from the point of view of the cyclical calculation around the 25th / 28th June (+/-) should end with the formation of a low.
Since we do not act purely on turning dates within our swing trading strategy, factors such as the market environment, dominant players, chart technology and the corresponding activity zones must be included.
The areas of support and possible course targets at 15,530 and 15,430 as well as 15,290 points (green zones) are to be named as activity zones.
Only with a sustained break through the upper limit level (red zone - 15.630 / 15.656) would the current short-heavy environment clearly brighten up again.
As mentioned, our cyclical calculation is trend-setting, so that after stabilization tendencies there should be a change of direction today or at the beginning of the coming week.
(Our turnaround dates have an average tolerance of 3 days. In 80% of the cases it is 2 days.)
Note:
Despite careful analysis, Global Investa does not accept any liability for the content, topicality, correctness or completeness of the information provided.

EURNZD will fall short!
Hello,Friends!
In this market situation, I am looking at mutiple indicators
And I can see bearish momentum accumulating on the pair right now
This setiment makes me bearish biased and I am considering a short
Like and subscribe and comment my ideas if you like them!

USDJPY will fall sell!
Hello,Friends!
Based on the technical analysis, and the recent minor fundamental news
USDJPY looks bearish to me overall.
I think marketmakers will be pushing the pair down
That is why we are going short
Like and subscribe and comment my ideas if you like them!

CADJPY Will go lower from resistance sell!
Hello,Friends!
Indecison on the market is changing to a clear bearish mood
And the price action on the lower timeframes is clearly supporting this narratve
Therefore, I think a short is a good idea to go short
Like and subscribe and comment my ideas if you like them!

EURJPY Will go down from resistance short!
Hello,Friends!
We can see that EURJPY is about to fall based on the current price action
Overall market sentiment is bearish right now
And I can see smart money entering shorts
So we will sell too!
Like and subscribe and comment my ideas if you like them!

GBPAUD Will go Up from support long!
Hello,Friends!
Based on the technical analysis, and the recent minor fundamental news
GBPAUD looks bullish to me overall.
I think marketmakers will be pushing the pair up
That is why we are going long
Like and subscribe and comment my ideas if you like them!

ETHEREUM in critical zoneCurrent analysis of Ethereum (ETHUSD) - viewing in the D1 chart
Starting from the all-time high of 4,381 USD marked in May, the Ethereum price has completed a crash-like sell-off down to 1,730 USD. A bounce from the 61.8% fibonacci retracement of the price surge that started in March 2020 was finally followed by a renewed test of the low, the technical significance of which has increased due to the 200-day line now also acting as a support.
On Tuesday there was a temporary shortfall that turned out to be a false outbreak and thus a bear trap. Bargain hunters took hold at the low of USD 1,700 and pushed the price up to USD 2,045. We now rate the low as critical from a technical point of view. A significant shortfall should extend the sell-off from the record high in the second downward wave towards USD 1,520, USD 1,293-1,420 and possibly even USD 911-1,041.
As long as the USD 1,700 mark holds, the bullish short-term setup of the erroneous breakout could, in our opinion, manifest itself in further temporary price increases. A break above the reaction high at USD 2,045 would be necessary to confirm this, which remains to be seen. Our primary goal, if successful, is $ 2,250 / $ 2,300. To brighten up the medium-term chart image, however, an increase above the massive resistance zone at USD 2,847-3,000 would be necessary.
If you liked the analysis, please give me a like and follow me to stay up to date. You support my work tremendously!
Always good trades!
Global Investa

XAUUSD Will go lower short!
Hello,Friends!
XAUUSD current trading paterns are clearly pointing in the direction of a short
That is why I am bearish on the Symbol pair
And I think it will go down
Like and subscribe and comment my ideas if you like them!

NZDUSD Will go higher buy!
Hello,Friends!
We can see that NZDUSD is about to go up based on the current price action
Overall market sentiment is bullish right now
And I can see smart money entering longs
So we will buy too!
Like and subscribe and comment my ideas if you like them!

USDCHF Will go lower sell!
Hello,Friends!
USDCHF is bearish right now and I think the market conditions are right
for the move down
Therefore, i think it is sensible to go short
Like and subscribe and comment my ideas if you like them!

GBPUSD ill go down short!
Hello,Friends!
In this market situation, I am looking at mutiple indicators
And I can see bearish momentum accumulating on the pair right now
This setiment makes me bearish biased and I am considering a short
Like and subscribe and comment my ideas if you like them!

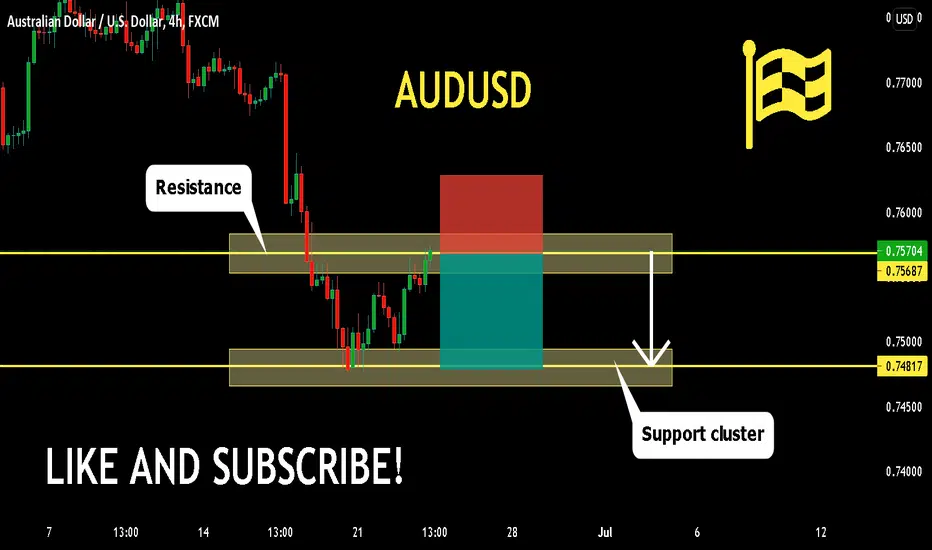
AUDUSD Will go down from resistance short!
Hello,Friends!
Based on the technical analysis, and the recent minor fundamental news
AUDUSD looks bearish to me overall.
I think marketmakers will be pushing the pair down
That is why we are going short
Like and subscribe and comment my ideas if you like them!
DAX analysis: Does the DAX follow the seasonal pattern?Current analysis of the DAX index - viewed in the H4 chart
The DAX shows an intact medium and long-term upward trend. The last time it reached a record high of 15,803 points was on June 14th. The setback that has been ongoing since then led to the successful test of the rising 50-day line on Monday and the formation of an intraday correction low at 15,309 points. Based on this, the bulls reported back impressively and were able to reach a recovery high of 15,653 points by Tuesday. Overall, there are still potential course targets at 15,900 / 16,000 and possibly around 16,200 points to be processed. In view of the typical seasonal pattern, it would be conceivable that these levels could still be reached before the weak stock market phase starts in mid / end of July and a clearer correction phase lasting several months moves onto the agenda. A corresponding confirmation would be a sustained increase of over 15,803 points at the end of the day.
With a view to the short-term chart image, however, in the event of a significant slide below the support at currently 15,498 points, we favor an immediate continuation of the corrective phase with possible goals at 15,309 points, 15,193 points and 14,816-14,961 points. Finally, below the last-mentioned zone, the overall chart image would also become significantly clouded.
If you liked the analysis, please give me a like and follow me to stay up to date. You support my work tremendously!
What do you wish for? Which underlyings do you like?
Feel free to write to me in the comments
Despite careful analysis, Global Investa accepts no liability for the content, topicality, correctness or completeness of the information provided.

EURUSD is bullsih buy!
Hello,Friends!
EURUSD current trading paterns are clearly pointing in the direction of a long
That is why I am bullsih on the EURUSD pair
And I think it will go up
Like and subscribe and comment my ideas if you like them!

USDJPY is bullsih long !
Hello,Friends!
USDJPY is bullish right now and I think the market conditions are right
for the move up
Therefore, i think it is sensible to go long
Like and subscribe and comment my ideas if you like them!

EURGBP is bearish sell!
Hello,Friends!
Indecison on the market is changing to a clear bearish mood
And the price action on the lower timeframes is clearly supporting this narratve
Therefore, I think a short is a good idea to go short
Like and subscribe and comment my ideas if you like them!

EURNZD is very bullsih long !
Hello,Friends!
In this market situation, I am looking at mutiple indicators
And I can see bullish momentum accumulating on the pair right now
This setiment makes me bullsih biased and I am considering a long
Like and subscribe and comment my ideas if you like them!

GBPCHF is very bearish sell!
Hello,Friends!
We can see that GBPCHF is about to fall based on the current price action
Overall market sentiment is bearish right now
And I can see smart money entering shorts
So we will sell too!
Like and subscribe and comment my ideas if you like them!
