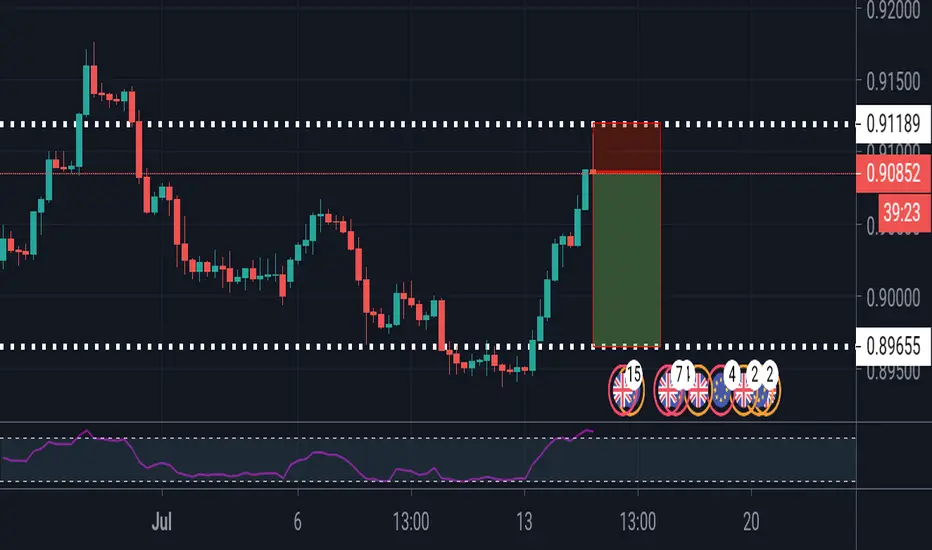
VET Dynamic Resistance|.618 Fib| Swing high|Structural supportEvening Traders,
Today’s analysis – VETUSDT- breaching dynamic resistance with an impulse move, swing high being the immediate target.
Points to consider,
- Local downtrend broken
- Retest confluence (.618 Fibonacci)
- Key dynamic resistance breached (swing high target)
- Stochastics flat
- Volume below average
VETUSDT’s down trend has been breached by taking out its dynamic resistance. This gives us a bullish bias on the immediate trend.
A structural support retest is probable; price is likely to respect this level due to high demand, currently holding the .618 Fibonacci.
The RSI is declining, remaining above 50 will allow for a bullish bias on the market. The stochastics is currently flat; this is an indication of momentum being stored to the upside. Price action must remain bullish for upside target (swing high).
The volume profile is currently below average, an influx will coincide with an impulsive move. Volume needs to be backed up by price action for follow through.
Overall, in my opinion, VETUSDT reaming above structural support will allow for a valid long with defined risk. Price action is to be used upon discretion / management of the trade.
What are your thoughts?
Thank you for following my work!
And remember,
“Trading effectively is about assessing probabilities, not certainties.”
― Yvan Byeajee
Swinghigh

Support Holds in Trend HigherWe discussed this pair. in the daily trade ideas last week because of the trend higher and the upcoming support level.
The support level has so far held and whilst the follow through as yet has not been major, it could be important.
If this level holds it could see price test the recent swing high resistance with another leg higher.
Thanks for your like and support...

2 of 3 Candlestick Patterns That Pinpoint ReversalsBearish Hammer Candlestick (AKA Inverted Hammer)
These bearish formations are simply upside down hammers, and are also known as inverted hammers.
Here's what a bearish hammer candlestick is telling us:
Price opened near the lows of the candle, and although buyers initially succeeded at pushing price higher, they lost the final battle when sellers tipped the scales in their favor again by closing price lower than the opening price.

EURJPY 15M ASIAN SESSION BEARISH REVERSALBearish Reversal Candlestick
The inverse is true with this type of formation in a bearish scenario, and the image above shows that price made the highest high before reversing and closing strongly lower off its highs.
Here's what a bearish candlestick is telling us:
Price made a new high, but buying pressure very quickly dried up as an increase of sellers entered the market resulting in the candle closing lower off its highs, signaling selling strength.
Strategy Provided by Price Action & Income by Richard Krugel

EURUSD Short Term ForecastD1 - We have a key resistance zone that has formed based on the 1.618 (1.15575) Fibonacci expansion level of the first wave and the 61.8%(1.16003) Fibonacci expansion level of the second wave.
The price is developing a big 5 leg structure and we are currently inside the 5th wave.
The price is currently breaking above the last swing high and it still has room higher towards the key resistance zone.
H4 - There is no evidence that shows the trend is over here.
Expecting the price to push higher towards the daily key resistance zone.


BTC - New Swing High Underway The 1st of June saw Bitcoin reach a swing high of $10,400, only to make a sudden U-turn and retrace in price of over $1,000 USD in one day hitting the 61.8% fib levels before recovering and slowly making its way back up. We now find Bitcoin trading around the 38.2% fib, ($9,718).
The question is: “Is a new swing high underway to break $10,500 levels?”
The answer will only be given with time, but things are looking good and an imminent break out to the upside is likely in the next few days.
We have been trading above the daily 20 MA for 13 days since crossing above it. We can see wicks hugging it and buyers stepping in as support.
Be aware that volume has dropped slightly so look out for a break of support and a break of the daily MA 20 for a drop to the downside, but my belief is that we will see price action leave this support price zone (38.2% fib level) and move UP to test a possible new swing high, or at the very least hit prior swing high/resistance of $10,400.
Good luck and safe trading.

USDJPY 4h Swing Long Buy StopAwaiting bullish pressure before entering this trade, current bearish momentum could see price break below current support.


4H XRPUSD 1-2-3 REVERSAL CANDLE PATTERNTrading Rules
1 - Preceding Uptrend
2 - New Swing High Green Candle
3 - Lower Low Red Candle
4 - Lower High Green Candle
5 - Enter: Break of #3 Low
6 - 1st TP Take measured distance
from #2 High to #3 Low
7 - You determine SL & 2nd TP

BITCOIN PUMPING - New swing high!Hey there,
Soooooo, well.
Guess we can negate the bearish/healthy scenario for now as we see Bitcoin pumping over its
prior high for 2020 and even wicking above the last swing high on Bitstamp to
create a new swing high.
This is quite a huge factor and once more signals the strength and deeper bullish
bias of this ralley. This also could now be further confirmation, that we see the start
of a strong bullmarket later this year and going into 2021.
Reaching above 14k could still be some sort of a challenge, since I do think that
11k will be of some resistance where price will a least need to consolidate imo.
Of course Bitcoin can go too ATH the next month, I do not doubt that, but it is not
the most likely scenario imo. Not a lot has changed besides that I am now looking
for scenario A to play out over the next days.
We have a daily 7 on the TI Sequential, so we will get a 9 the day after tomorrow,
maybe coinciding with a top at channel resistance and 11k.
Look at prior posts for clearance.
Check me out on
YouTube: Enlightened Trading
and Instagram: enlightened_trading_
so you don't miss out on key information and trading oportunities.
Cheers,
Konrad

Bitcoin screams bullishness - 1 more stop to goHey there,
So there is stilll one more target to go.
As I already said in my latest post, the 200Day EMA is one of the last major stops and resistances
which bitcoin has to break to finally confirm a trendchange on broader timeframes.
Sitting now at 8900 USD, the 200Day EMA acted as resistance multiple times in the past and
seems to be of high significance when it comes to trendchanges.
Another retest and breakdown off the 200 EMA would be a warning sign.
Luckily not only does to imminent closeness of the price to the 200 EMA signal bullishness,
also many other indicators tell us to be long.
The weekly TI /TD indicator @tonevays still tells us to be long and keep sitting in postions from
the green 2 above a green 1. We now further have a green 4 barely reaching above a green 3,
which continues the bullish count and its anticipated outlook on price.
The further we consolidate below the 200EMA and the recent high of 9200, the more we tend to break that level.c
-->Line of least resistance; Look it up on my YoutTube channel if you want to know more.
If all these levels get taken out by breaking to the upside, we will look at 10000 USD and the last swing high on
the daily and weekly chart.
There is still much more to say, so if you are curious, check out my YouTube channel: Enlightened Trading
See back next time,
Cheers
Konrad

EUR/JPY SELLSince last week, been saying since last week, EUR/JPY is going down and i was right.
My account management clients have profited and my signal packages have also profited.
Swing high and lows identified
Previous fib still in existence
trend channel identified: Strong as three shadows have touched and bounced back down significantly.
Cross lines which have confirmed another drop which is in the process.

EURAUD breakout of resistance and new bullish setupEURAUD is breaking an important swing high that we had in the past and the setup with the moving averages is turning bullish.
With a risk to reward slightly better than 1:2, it is worth to try to trade this breakout.

GBPUSD - Next Swing-HighThe market is moving about the 200 MA, so we're looking for buy opportunities.
Propably the market will bounce at the resistance (1.26600) where it is now.
We recommend to buy at the resistance with a risk-to-reward ratio of 1 to 4:
Thanks and good luck!

Dax daily: 14 Jun 2019 Thursday’s session has been considerably more active compared to the previous day. Dax first headed straight up without stopping at our first resistance zone. The second level of resistance laying at 12 194 functioned perfectly and the price even formed an intra-day high there. Following was a bounce back to our first level, now being a support zone where we found some buyers taking the price slightly up again. Today we open with the gap being already closed.
Important zones
Resistance: 12 264
Support: 12 121, 12 054
Statistics for today
Detailed statistics in the Statistical Application
Macroeconomic releases
NIL
Today’s session hypothesis
Today, we hope to descend towards 12 121 just to get buyers to take the price higher. In case Dax gets below 12 121, it is more likely the price will slow down in the consolidation area from Wednesday. If bulls are strong, then the first target is the swing high from 11 Jun, followed by a retest of the resistance level at 12 264.

USDCAD long term Short 1WUSDCAD forming a ascending triangle, price action entered on a negative trend suggesting a bearish exit, breakout looks imminent if correct, my stops are set just above 1.38 with a long term take profit traget at 1.25. Entry suggested closest to strong weekly resistance line


BTCUSD 15min/4H charts (4/1/2019)Good morning, traders. Price has continued to grind higher, finding a high of $4139.99 so far, much to the chagrin of the bearish out there. We completed six green weekly candles in a row, the previous high being five during April, and two monthly green candles in a row which hasn't happened at all during this correction. I continue to see an increasing number of really terrible analysis relating to volume. Yes, volume is low, but this is to be necessarily expected as price nears resistance and the apex of a triangle. So there is nothing overtly bearish about volume at this time. Stop listening to people who say "volume is low" or "volume is high." Without context it means absolutely nothing because volume does not live alone on its own little island.
Weekly 21 EMA is around $4250 and, as I've been mentioning for quite a while now, a close above that level should signal a bullish push toward $5000 as it notches a higher high for the first time since the ATH. Failure to surpass that level will likely have price targeting the ascending triangle support at $3600/$3700, depending on how quickly it drops. Weekly Stoch RSI has been topped out for the past month. Weekly RSI isn't bullish yet, though, sitting at 44 so it would make the most sense to see price target that ~$4200 level and then retrace to set up a proper break through that resistance. But trading isn't about what we "think" should happen; it's about what does happen.
As I have warned before, there is the potential for a sudden push above $4250/$4300 to ignite cascading liquidations of the cluster of shorts sitting in that area and resulting in a bit of a short squeeze propelling price upward before a retracement. With that said, the 15 minute TF shows a potential flag printing at this time which would have a target of around $4215, based on the height of the flagpole, if price follows through on a bullish break above $4130. A target of $4155 is based on the height of the descending channel/flag pattern. There are also some gaps on that short TF that lack filling down toward $4000.
The 4H RSI is showing possible bearish divergence and a recent bearish Stoch RSI cross just below overbought, but the time until a reactionary price movement down may be prolonged as the shallower TFs are attempting to flex a bit of muscle. For now, the 1H price continues to find support on the 21 EMA and Stoch RSI is printing a bullish cross just above oversold. The question is, will there be enough demand showing up quick enough to negate that 4H bearish divergence? Most likely not, but we need to be aware that the possibility exists at this time. Interestingly, Bitmex is showing a lot more orderbook supply in relation to demand than Deribit, though they are both perpetual swaps. As such, traders should be careful if attempting to get into a position early based on these orderbooks. Spot orderbooks are showing supply around $4150 and then $4200.
The 3D Stoch RSI has a bit more room before topping out, which also increases the chances of a prolonged move up before retracement. RSI on this TF is bullish at 57 as well. Monthly Stoch RSI remains oversold as it has been since March 2018, however it has been rising since January 2019 suggesting the bottom may very well likely be in. In other words, entering short of long right now is more gambling than trading, depending on your TF, unless of course your are entering long to hold for an extended period of time. There are too many variables at play right now that could keep what it appears "should" happen from happening. I am still long for a push toward that 4H R1 pivot at the top of the ascending black channel. The two dotted blue horizontal lines are the swing highs that we need to see price close above.
Every day, we have a choice to act positively or negatively, so if you get a chance, do something decent for someone today which could be as simple as sharing a nice word with them. You just might change their day, or even their life.
Remember, you can always click on the "share" button in the lower right hand of the screen, under the chart, and then click on "Make it mine" from the popup menu in order to get a live version of the chart that you can explore on your own.

BTCUSD D1/M1 charts (2/4/2019)Good morning, traders. Bitcoin continues to trade sideways with no significant increase in visible supply or demand on the order books. While Bitmex has continued to show stronger supply, spot exchanges are showing stronger demand. Traders should consider both but give more credence to spot exchanges as Bitmex's swap system and 100x leverage draw to it the gamblers (those with a stronger "casino" mindset) which means they are generally short-profit driven which leads to constantly jumping between buying and selling. Spot exchange traders tend to have a more definitive outlook and as such aren't prone to as much flip-flopping. Again, this is speaking in generalities.
At this point, price has printed a perfect descending channel on the daily. The daily RSI has printed a descending wedge whose apex it is nearing, and volume has continued to drop as price has consolidated, which means that we should see a strong push by price in either direction sooner rather than later. Price is also treading along, just under, the steeper red resistance. I have outlined the horizontal resistance levels in blue as well. Currently, my expectation is for price to target the supply EQ around $4500 as noted once it moves through the channel's resistance. Traders must watch for price to target the channel's EQ and then its resistance before thinking of the supply EQ, however. These more local levels give shorter-term traders ideas of where to watch if going long or short in the near term. Yesterday's candle was very low in terms of volume and today's candle is already almost even, yet the candle spread is very small so far. This is something traders should watch through the end of the day. Based on the steep red resistance line, a successful move beyond it should have price targeting the January 19th swing high around $3760/80. We would need to see the candle closing above that swing high to protect price from a bearish SFP and signal further advancement. A successful close below the January 29th swing low at $3322 would have price likely targeting the $3200 area and failure for that level to hold puts $3000 on guard.
The monthly chart is interesting. We can note the large drop from the $6000s in November, however we saw even greater volume in December but a very small candle spread and good lower wick. January saw volume comparable to this past summer, but again small candle spread. This appears to be suggesting that demand continues to show up and while it hasn't been enough to send price higher just yet, if it holds then supply will continue to get eaten up and we could see price moving higher and catching most traders off guard. The wedge is the dominant pattern at this time and based on prior movement suggests that price should be moving sideways/up to challenge the pattern's resistance. This would give price another alternating touch of support and resistance thereby confirming the pattern. If that were to happen, then my expectation continues to be what it has been in that we would see price test that resistance, retrace a bit, and then push through the resistance. Looking at the daily chart, the move toward resistance isn't unthinkable.
Every day, we have a choice to act positively or negatively, so if you get a chance, do something decent for someone today which could be as simple as sharing a nice word with them. You just might change their day, or even their life.
Remember, you can always click on the "share" button in the lower right hand of the screen, under the chart, and then click on "Make it mine" from the popup menu in order to get a live version of the chart that you can explore on your own.

