CBOT further bearish?Price at 38.2% of current Fibonacci retracement range, momentum still unclear at the moment.
However the bearish momentum from previous candles (from the significant level and reversal zone above) may continue.
Swinghigh

Selling September DOW E-mini Futures ON A Test Of 25500Fundamentals are going to control the DOW for the remainder of the week. With Friday’s Q2 GDP release looming, we may be in for choppy price action in the next 48 hours. Until Friday's GDP release, selling the first test of 25,500 is not a bad way to fade today’s breakout.
Here is the trade in the September E-mini DOW:
Entry: Short from 25491
Stop Loss: 25526
Profit Target: 25456
Risk Vs Reward Ratio: 1/1

Swing Highs & Lows, Support, Resistance & Confluence ZonesHello. Welcome to some random guy's educational post on Tradingview - who thinks he knows enough about trading to teach other beginners. Whether you are a beginner at trading or investing, these tutorials will help you tremendously in gathering a basis for your interest in this game. Because in fact, this is a game. A game of wins and losses, how we manage them, and how we profit over time. The most important piece to this game is 'Risk Management'. However, I need to make sure that at least the basics of swing lows/highs, supports and resistances are covered before I can go into a higher detail of what I want to cover in Risk Management.
Well. What the hell is this? What in the living hell are swing highs and lows? Why do they matter? What is the point? Doesn't the price just go about randomly?
Ahah! No. The misconception that many people have is that TA (technical analysis) is completely bogus. And that there isn't any correlation between where the price goes in comparison to where it's been. That my friend, is a lie. Though, predicting very far into the future using TA is extraordinarily hard, and I've learned that its just best to keep things short-term (most of the time), TA is a grounds to price action and the POSSIBILITIES and PROBABILITIES of the market. With TA, you are just accounting for what the market CAN do based on what it already HAS done. TA is never 100% accurate all the time, and is always likely to fail at some point because the probabilities in the market are never 100% probable and are never guaranteed.
The only probability that is guaranteed is that the price will go "up, down or sideways." If you say that, you will always be right :).
So let's get to it! What is a swing high? A swing high/low is a price point in the market before a reversal. Swing highs happen at the peak of the trend, swing lows happen at the valley/bottom of the trend. On the chart above, you will see the major swing highs in white, and swing lows in blue.
What is a confluence zone? Confluence zones are areas where there is a lot of activity, multiple supports and resistances. Typically either areas of indecision, consolidation OR areas of accumulation or distribution.
Consolidation: Areas where price volatility settles down, volume decreases, and the market is getting ready for a choice of a direction in price.
Accumulation: Typically referred to as an "accumulation phase," this is an area where traders begin to slowly accumulate (purchase) the stock, while shuffling out short orders. This typically is low volume, and reflects a level of consolidation. This happens before an uptrend.
Distribution: Typically referred to as a "distribution phase," this is an area where traders begin to slowly distribute (sell/short) the stock, while shuffling out long orders. This typically is low volume, and reflects a level consolidation. This happens before a downtrend.
Accumulation and Distribution levels are a part of the Wyckoff Theory. It's a pretty simple diagram that can be googled.
Now why are these even important? These levels can be used as points for a target on your trade, or even stop losses. Updates to come with examples of how these would be useful tools in trading.

XRPUSD 1H GANN FAN TRADING STRATEGY This trading strategy is a complex support and resistance trading strategy that uses diagonal support and resistance levels. Unlike the traditional horizontal support and resistance levels, the Gann fan angles are mathematically calculated based on the price, time and the price range of the market.
The Gann fan trading strategy can be applied to all markets and 1H+ time frames because the financial markets move as a result of human behavior which makes them cyclical in nature. In other words, history is a good predictor of future price action.
One of the main reasons why Gann fan angles are superior to the horizontal support and resistance levels is that financial markets are geometric in their movements. This means that if you can spot a pattern or or any other geometric shape in a chart, then there is a high probability you can spot them at the Gann fan angles.
Gann Fan Indicator is notable unique because it draws diagonal support and resistance levels at different angles.
The most important angle is the 45-degree angle or the 1/1 line. For every Gann angle, there is a line that is derived from that angle. We can distinguish 4 different Gann angles above the 45-degree angle and 4 other Gann angles below.
Gann believed that when price and time move in sync, then that’s the ideal balance of the market. The biggest part of the Gann theory revolves around the fact that prices above the 1/1 line, the 45-degree line will determine a bull market and prices below the 1/1 line determine a bear market.
How to Draw Gann Fan Angle - You first need to draw a perfect 45-degree angle and most sophisticated trading platforms should have incorporated such tools. On the Tradingview platform, you can locate the Trend Angle tool on the left-hand side panel.
Next step is to select any major swing high/swing low on the chart from where you want to draw the Gann fan angles. Once you’ve chosen your swing low point simply utilize the trend Angle tool and draw a perfect 45 degree angle.
Once you’re done, you need now to learn how to draw the Gann fan angles. On this step you need to use the Gann Fan indicator which again is located on the left hand side panel.
Now, all you have to do is to simply place the Gann fan indicator on the chart and make sure it overlays on top of the 45-degree line you previously have drawn. This is the correct way to draw the Gann fan angles and if you have been following all these steps all the other Gann fan angles should comply with the Gann rules.
Step #1: Pick a significant High, Draw Gann Fan Angles (White lines) and Wait For the 1/1 Line to Break to the Upside.
Step #2: Wait for a Break Above 2/1 Gann angle (Green line) before buying at the market. This step is significantly important because a reversal of the previous trend is only confirmed once the 2/1 Gann angle is broken to the upside.
Step #3: Apply again the Gann Fan Indicator (Yellow lines) on the Swing low prior to the breakout above 2/1 Gann Fan Angle (Green line).
One of the reasons why this is the best Gann fan strategy is because we use the Gann fan indicator to track every swing in the market.
Step #4: Place Your Protective Stop Loss below the Most Recent Swing Low Which Should Align With the Point from Where You Draw the Second Set of Gann Fan Angles.
Step #5: Take Profit once we Break and Close Below the 1/1 line (I close at 8/1 line).
New bearish move setup - We Need a Close Below 1/1 line to be by at least 20 pips to consider it a Valid Bearish Breakout. We want to ride the new trend for as long as possible and with the help of the 2nd Gann fan indicator, we can pinpoint the ideal time to enter and to take profits.
We also want to add a buffer of 20 pips to the 1/1 Gann angle breakout just to annihilate possible false breakouts.

aud/usdwe do see a strong swing low was formed and is about to be reached again, so a bounce from this level is likely to happen. The target is the swing high which will be the 0.78975.

XRPUSD 2H Lower Highs Lower LowsPair has failed to make a new swing high
Price is making lower highs lower lows
Price can bounce bullish off 50 sma or break below it
Price can consolidate between 50 and 100 sma
As price falls from 50 to 100 sma it can go half way and return back to 50 sma
If that happens price can move above 50 sma and rise to swing high target
Or price can bounce short off 50 sma and fall to 100 sma
If price breaks below 100 sma it may fall to swing low target
Watch Macd in relation to Macd red line, 0 level line, Stoch blue dotted lines

BTCUSD 1H Triangle Long TradePair has broken out long from triangle pattern.
Break-Hook-Go completed to confirm bullish move.
1st take profit is swing high resistance.
2nd target price from projected equal distance arrow from triangle

BTCUSD 1H RANGE TRADESPrice between 50sma & 100sma
Price will breakout from sma's
Long Trade
Breakout above 50 sma
1st Take Profit Range Top @11712.3
2nd Take Profit Swing High @ 12909.3
Short Trade
Breakout below 100 sma
1st Take Profit Range Bottom @ 10457.4
2nd Take Profit Swing Low @ 9518.1

LTCUSD 2H RANGE TRADESLTCUSD 2H RANGE TRADES
Long Trade
Entry breakout above 50 sma
1st Take Profit Range Top @ 184.78
2nd Take Profit Swing High @ 211.65
Short Trade - My Bias
Enter on 15m chart
1st Take Profit Range Bottom @ 167.58
2nd Take Profit Swing Low @ 143.35
Short Bias - Macd is below both 0 level and Red Line

XTRUSD 2H DESCENDING TRIANGLE BREAKOUTPair had a bearish breakout.
Price has hooked back into triangle pattern
Price will either break to the top or break to the bottom and GO

Momentum Buy : Ramco Systems, CBSL 448, Targets 505-515-525* Cup and Handle breakout
* Volume breakout
* Resistance breakout
* Yearly Price breakout
* Swing highs breakout

Marico Ltd Short term Positional callWww.techno-funda.com
CMP 318.9, Closingbased SL 312.9, Targets 323, 326, 331
* Consolidation Breakout
* Swing high Breakout
* Trend line breakout
* Swing Retracement
* Mini Morning Star pattern formation
Disclaimer: All levels are for education purpose only.

AHLUCONT Short term Positional Call Www.techno-funda.com
Ahluwalia Contracts (india) Limited CMP 390, Closing based SL 369, Targets 405, 415
* Volume Breakout
* Morning Star pattern
* Swing high Breakout
* Pre Breakout Trading (so involves little risk)
Disclaimer: All levels are for learning purpose only.

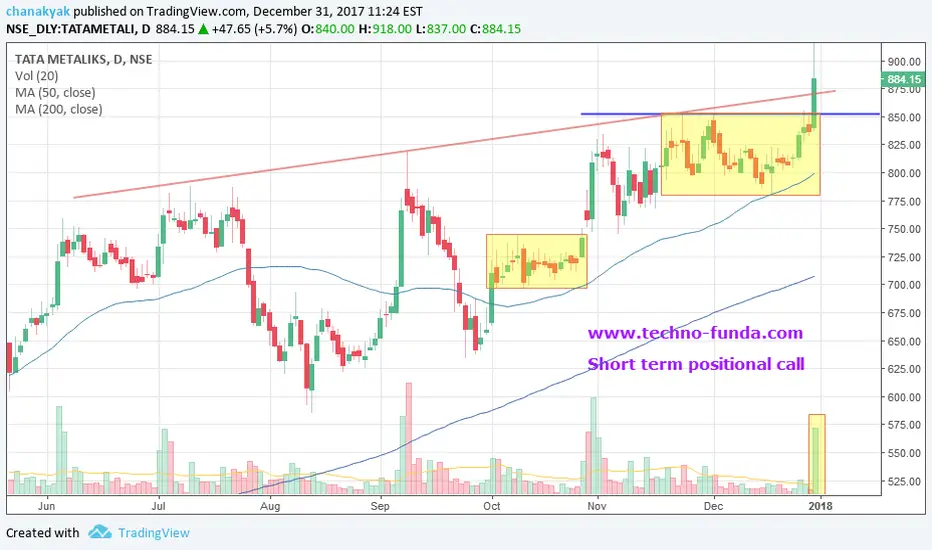
Tata Metalicks Medium Term positional CallTata Metaliks Limited Trading technical call for medium term
NSE: TATAMETALI
CMP: 884, Closing based SL 829, Targets: 920 945 959
Technicals:
* All time high and Close breakout
* Consolidation Breakout
* Trend Line Resistance Breakout
* Volume Breakout
* Swing high breakout
* Good Fundamentals
Discliamer: All levels are for Educational Purpose Only.
DISHTV Short term Positional Call Dish TV India Ltd Trading technical call for short term
CMP: 86.2, Closing Based SL 82.9, Targets 88.6 89.5 90.5
For educational purpose only

EURUSD 1H LONG TRADEThis is a follow up on the EURUSD 4H Flapjack Trade
Pair broke long at 1st up green arrow.
Price continued to 1st Take Profit at 161.8% fib and previous swing high
Price may continue to 2nd take profit at 261.8% fib
IF Macd doesn't fall below 80 level line

ETHUSD 2H CHANNEL TRADESBull Trade
1st target swing high
2nd target channel top
Bear Trade
1st target 50 sma
2nd target 100 sma
3rd target swing low

TRXUSD 4H 50 SMA BREAKOUTPair has strong support zone
Macd over extended below 20 line
Bull Trade
Enter with Buy Stop just above 50 sma
1st target fractal high @ .00001300
2nd target swing high @ .00002040

DASHUSD 4H RANGE TRADESRange Top 1245.75
Range Bottom 954.00
Swing High Take Profit 1592.50
Swing Low Take Profit 777.00
15m chart for Range Breakouts
15m chart for Entry with Break-Hook-Go

Tata Elxsi Medium Term positional call Tata Elxsi Limited Medium Term Techno-Funda call
NSE: TATAELXSI
CMP: 977, Closing based SL 879, Targets 1050 1080 1125
Technicals:
* Swing High Breakout
* Cup and Handle Breakout
* Volume breakout
* Trading above important Moving averages
* Resistance breakout
GOOD FUNDAMENTALS TOO
Disclaimer: All the levels are for education purpose only.

BTCUSD 1H Bullish ContinuationPrice dropped to 50% fib retracement then reversed long. First Entry would have been after 1 candle pullback @ 8010.00. Original buy stop was 8110.00. First take profit would be swing high. Price hit swing high and broke above it. Nice to watch and learn how this pair reacts to fast drops in price.


Sellers, time is up... Price broke back above head & shoulders neckline, & broke out of downtrend channel.. Failed to break daily support & the bulls have kicked back in. Dollar broke its uptrend line (DXY) & is pointing to the downside.. Important inflation news on USD tomorrow something to watch, these next news events will determine if there will be a rate hike next month still or not.. Looking to go long on the retest!
