VSA vs BTC: Into a Bearish Scenario or Not?Predicting the market requires skill.
Most traders fail at one crucial point: they don’t see the market as a living, breathing organism—a structure where one move leads to another, like cause and effect in motion.
That’s what we often call reading the psychology of the market. When you begin to grasp the fundamental principles behind that, you step into the realm of elite traders.
And yes—Volume Spread Analysis (VSA) is a powerful tool, but only if you know how to read it properly.
I’m not a certified trader or financial advisor, and I don’t give signals, entries, or exits. I’m simply a solo observer, sharing a slice of what true technical and fundamental analysis looks like.
And yes—it takes time. It takes skills. Now, if we want to even attempt predicting the future of price action, we must understand something: A chart is not a single truth. It’s a battlefield of conflicting signals.
Patterns, marks, levels—some suggest bullish continuation, others hint at sharp reversals. Confusion is inevitable if you don’t learn to distinguish which signs matter.
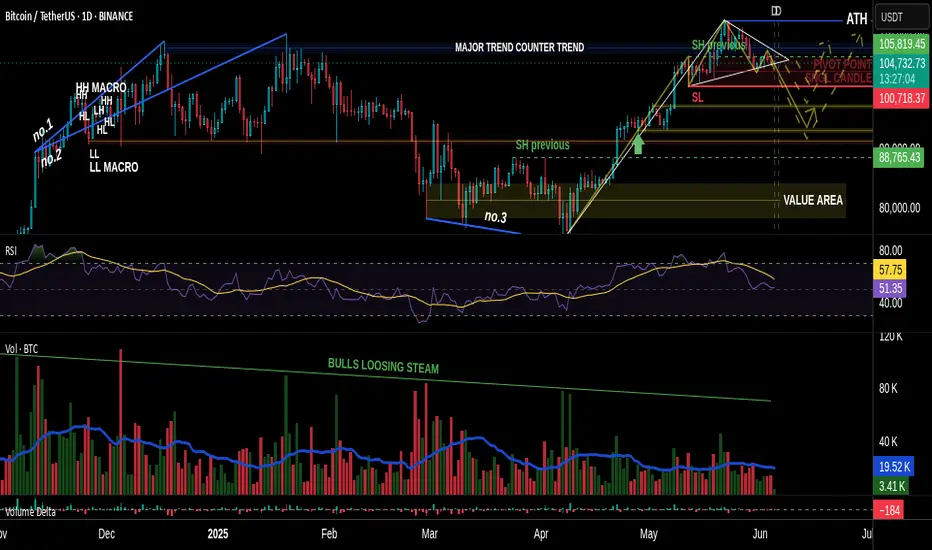
In our current BTC chart, we’re witnessing this contradiction unfold clearly:
• A bullish flag formation...
• Yet within it, the emerging completion of a Head & Shoulders pattern!
How arrogant can the market be! 😄
A moment to laugh—but also a moment to observe how cleverly the crowd is misled.
This is classic manipulation, wrapped in a textbook setup.
But what’s most telling isn’t the pattern on the surface—it’s the volume beneath the structure.
It’s always the quiet details that speak the loudest.
Before price shows its true face, volume often leaves footprints. In our case, those footprints were already leading toward a bearish path—long before the structure began to shape itself clearly.
So while retail eyes focused on the bullish flag, the underlying volume had already begun withdrawing support.
Not aggressively—no. Subtly, almost elegantly, in that familiar way institutions mask intention:
• Spikes that don’t hold
• Buying that doesn’t follow through
• And a steady fade in commitment as price climbs into weakness
It’s in those quiet inconsistencies where VSA earns its value.
It tells us: the move isn’t about what’s obvious.
It’s about what never fully materialized.
So yes, the pattern may still remain incomplete. The Head & Shoulders may yet fail to validate.
But for those who were watching volume first—not structure—the script was already being written.
✒️ From now on, professionally speaking, we must still wait:
• For the Head & Shoulders to confirm or dissolve. So eyes targeted at the swing low level near 107k
• And for volume to either legitimize or invalidate the entire setup
Only then does the chart grant us permission to speak in certainties.
🐾 But so far…
• The clues have favored the bears.
• Sell opportunities appeared early and often—for those who know what to look for.
• Bullish spikes in volume? They were met with silence.
• Momentum fizzled under a macro backdrop of fading demand.
If you were in the right mindset, and aligned even the lower timeframes to basic structural zones,
you already saw the path ahead wasn’t being carved by the bulls.
Let them finish the patterns.
Let the candles paint the story.
But for those trained in volume, the ink has already dried.
And if you're still reading, maybe you already sense it—
real insight doesn’t shout, and it never floats in abundance.
Value has never been about noise. It’s about what’s rare, quiet, and overlooked by the crowd.
Just like in the markets—the true signals aren’t loud, and they’re never free in the economic sense.
Just as price rises where supply thins, the same applies here:
what’s scarce... holds weight.
PS For last A little exercise, something to grasp on. Have you noticed how Volume & RSI behaves in lower time frames? 4Hour or 1Hour for example. Can you identify how volume confirms a bearish move. Do you discover the correct correlation and combined use between VSA & RSI. Remember my previous insight
See you next time!
Swings
Looking for a break and retest of ATH's for XOM!🔉Sound on!🔉
Thank you as always for watching my videos. I hope that you learned something very educational! Please feel free to like, share, and comment on this post. Remember only risk what you are willing to lose. Trading is very risky but it can change your life!

GWAV IS THERE SOME ROCKET FUEL LEFT?Not a ton to say as I feel most of this is labeled on the chart.
If you're trading this stock, just go in with the mindset, "because it can"
Why can the stock hit 3.49 next week..
Because it can.
It doesn't have to make sense.
But it does actually make sense.
Anyway,
Something tells me you're going to need a new chart fairly quickly.
Why?
This is going to be a fast move back up to at least .14
Every step up is just over another breakout point.
It will retrace gains as fast as they come.
Expect a lot of movement to occur after hours.
Take profits and buy dips if support and volume is still there.
Good luck!!
Sorry for the lack of charts.
I've been trading a lot of these types of stocks (ffie, snla, sint akan...)
Keeping up and posting charts for those moves would be far too difficult.
However, this move setup nicely for chart idea.
Can't promise moon, downside is to .045 to .039
However, it is at trend support and at the very least, you're looking at a good probability it returns to over .1

EURUSD, wedge patternEURUSD / 4H
Hello traders, welcome back to another market breakdown.
EURUSD has been trading inside a trading range, the price is now trying to breakout. Until there is a clean breakout, bears will be shorting new highs for a deviation.
I'll be watching this wedge pattern.
Trade safely,
Trader Leo.

Potential Swing idea on NZDCHF.. Longs above .56000Banks hedge buys and close sells above .56000 Looking for longs on weekly chart at this level
FX:NZDCHF

XAUUSD POTENTIAL FORECAST | TUESDAY | 20/12/2022A break of bearish trendline signify a shift in direction for gold. A minor retest whereby we can see another BOS in line with a minor fib retracement with entries taken on the lower timeframe. Looking at intraday high to be taken out. Potential intraday / swing trade on gold to the upside.

But Long-term, Something else. Hey Everyone,
DOTUSDT still looks bearish to me, in the short term mostly as I explained in my last post about ETHUSDT. (link down below)
In the last few days, the market has been consolidating without any swings that we used to see before. The mid-term trend is bearish, and we are in a symmetrical triangle right now. At its support precisely. We are most likely going to reach the next major Support (in white).
However, looking at the long-term chart here and the MA plotted on the RSI, I saw that the RSI reading had crossed the RSI MA, and it is now retesting it. Usually, RSI MA works as the usual moving average but on a momentum indicator. This is a super-bullish factor for me, but still, this is in the long term. So, until we see an opportunity to enter a bullish market, this might take from week(s), to month(s) but probably before the end of this year.
I have also noticed this pattern on multiple big-cap coins like VETUSDT and ETHUSDT.

GBP/USD Futures Continued BehaviourPrice is making Minor Mountains and new highs.
Identified a continuation in the current behaviour in price.
Minor mountain area = yellow box

AUD/USD Long FuturesWhen price changes we need to change with it and tune ourselves in to what are they doing?
In this case, buyers are making HH/HL's. In my previous post i was anticipating an expansion of price into the major.
Order moved into the swap of the minor pivot

US OIL FORECASTExpecting US OIL
Fundamentals pointing towards OIL long on DAILY chart. Expected projections and levels already respect of the various fib levels, We've seen price respect the underside of the trend channel for a pullback into the 104.92 area.
Looking for confirmation of a long into the 112.34 initial zone.

Micro Gold Futures (45)Price pulls back into the major reaction leg out of a low. Runs down tests the low and pulls back into a minor.
Sellers step down to the outside bar down structure out of the high and make a relative LL confirming a minor reaction leg.
At the low buyers try to hold, sellers step down and press price off the cliff, through the low and confirm the press structure.
Buyers try to hold and pull back into the relative minor reaction leg at the press structure. Entry at the re-test of the multi pivot line out of the gap

CRYPTO: ETH swing trade 4HSetup:
Flow is up
Major and Minor swings
Swing expansion
Pivot component takes out controlling sellers
Entry:
Re-test 50% of the gap
Stop:
Under 3 bars hard
Target:
3:1 RR higher high

FX: AUDJPY swing trade 30mSet up:
Flow is down
Swing expansion
Pivot component met
WRB takes out controlling buyer
Entry:
Retest 50% of the gap (82.973)
Stop:
Above the pivot (83.267)
Target:
3:1 RR lower low (82.093)

STOCK: MNST Swing trade dailySetup:
Flow is up, making measured swings
1.5 swing expansion
Pivot component - contraction & gaps
Single line broken
Entry:
Rest test after gap into contraction area
Stop:
Below the pivot
Target:
2.5:1 Risk Reward

STOCK: ROST Swing trade dailySet up:
Last confirmed swing high broken
Price is making balanced swings down
Pivot component gaps up and down
Last controlling buyers zoomed
Entry:
Re-test in zoomed area of last controlling buyers
Stop:
Above Pivot
Target:
2.5:1 RR

SWING IDEA #17: WISHWatching WISH tommorow for a bounce off the support. Bullish flow+Oversold looking for a reversal here, if it breaks I can see $7-$8.

SWING IDEA #9: ROKU Looks like ROKU broke the $466 resistance level as I expected. I can see it run to the $485 level but a pull back is definitley due, RSI indicates it is way overbought.
This is not financial advice just my opinion.


BTC course plotted for this fall then rise then fall BITCONI think from this weekly pivot test and L3 it will rise and reach weekly H3 around 60 (coincides with monthly targets) . Now that the Pivot magnet is fufilled can soon be longed. Once monthly closes there will be a steeper fall and magnet retracement to the upper 40k areas
using weekly and monthly Camarilla and CPR
Ignore the time scale. I expect the bounce in the coming week. and the fall on or around monthly close


Waiting for the Swings: WKHS and SHLLRight now, two stocks that I am keeping a close watch on include WKHS and SHLL. I think that WKHS and SHLL should both have a positive swing pattern very soon, and overall I'm bullish. I think resistance and the short sellers are about to pop. That being said, proceed in your own risk. As always, everything I say is on an opinion based basis. Please do your own due diligence.

Euro scalp +40 pips possible hereAfter a two legged double drive down ( Gann) that 100% match, time for a possible bounce from
oversold levels on %BB.
I estimate that from volume profile node ( POC) above that much volume is 40 pips above which could
be a magnet.
Below the next lower volume node is where stop loss is placed below.

