Small trade opportunity in MRO_TEKSmall trade opportunity in MRO_TEK. As the market is highly volatile. Make sure to have the correct stop loss as the trade might get reversed immediately. It's breakout trade and retest happen on friday.
Target 1: 95
Stoploss: 75
Happy Trading!
Swingtrade

Two potential swing trades for goldGold futures saw a false break of $2060 on Wednesday, before momentum turned lower and sent prices back beneath the weekly and monthly pivot points. Those pivots have since turned into resistance, before gold saw a trendline break.
As RSI (2) is oversold and prices have found support at the 10-dy EMA and daily S1 pivot, bulls could seek a near-term swing long trade with a stop below 2045 and a target back near the pivots.
At which point, we see the potential for another leg lower, so bears could seek evidence of a swing high and for a move back down to $2040, or the swing lows near the daily S pivot.

EURNZD I Bearish flag on weekly and potential continuationWelcome back! Let me know your thoughts in the comments!
** EURNZD Analysis - Listen to video!
We recommend that you keep this pair on your watchlist and enter when the entry criteria of your strategy is met.
Please support this idea with a LIKE and COMMENT if you find it useful and Click "Follow" on our profile if you'd like these trade ideas delivered straight to your email in the future.
Thanks for your continued support!

USDJPY sell (swing trade)This trade is considered being more risky as it does not really follow my strategy.. I am just testing something to potentially improve my strategy.
It rejected off a resistance on the 4hr and Daily timeframe. So I enter this long term swing tade... might scale in and out along the way, but the core pos will be held for potentially days or even weeks.

EURUSD Bullish Trade SetupSL: 1.06500
ENTRY: 1.07626
TP: 1.0
After an initial bearish move price found support at the monthly demand zone and also respected the 1.05 quarter point & monthly trend line.
This ultimately formed a higher low and a continuation of the overall bullish trend.
Price then began a bullish move until it met resistance at a weekly supply zone and created a lower high.
A huge sell-off followed until it met and found support at the monthly trendline, support at the 1.075 quarter point & support at a weekly demand zone.
The sell-off also served as a retracement and price ultimately ended up respecting the 61.8 fib level.
The weekly candlestick also appears to potentially close as a bullish hammer.
I am expecting price to continue bullish and test the resistance of 1.0 major point/weekly supply zone.

WTI stalls around resistanceThe core bias remains for a move up to $77, but as price action during the current rally on the 1-hour chart is choppy and has stalled near resistance, we're looking for a dip lower to around $73.
Also note that the weekly and monthly pivot points are hovering above the 10/20-day EMAs, which adds conviction that an interim top may be about to form.

JIO FIN SERVICESThis stock breakout 5 month consolidation level with high volume and only for educational purpose

MMTCMMTC is hovering around it's multi-year breakout zone. Above 72 it can bring another milestone of 100-120. Other scenario, it can consolidate for a week or two after breakout.

INFIBEAM Infibeam is in pure strength and break it's 52wk high. Enter with a small stop loss and accumulate till 15-16 price.

CDSL for Swing/Positional CDSL Prediction for Swing/ Posional Trading
First breakout at Entry 1 level and this entry 1 retested. You can entry now . There is a resistance 1545-1670 level. You can enter in trade at Entry 2 level above 1360 or above Entry 3 above 2045 close weekly basis or you can entry at any of the above levels according to your experience.
SLs- 1100,1050 ( according to your entry and RRR)
Targets- 1360,1545,1670,1695,2045,2340,2535,2590,3030,… .
According to your “STOMACH” book your profit. Always maintain your risk management.
Watch Carefully – The Chart Explains For Itself.
Can anyone tell me which chat patterns are shown up here?
Disclaimer:
I am not a SEBI Registered Analyst. Anything posted here is my own analysis and views. This is created for educational purposes only. Always consult your Financial Advisor before taking any decision or trade.
Request: Please support by Like, follow, comment, share and boost.
Happy trading.
About CDSL –
Central Depository Services (India) Ltd. engages in the provision of depository services. It operates through the following segments: Depository Services, Data Processing Services, and Others. The company was founded in February 1999 and is headquartered in Mumbai, India.
You can follow me in social media through links given below-

bullish shark harmonic pattern trade Live trade idea #EURJPYAnother round at this looking at the YEN INDEX to gain opportunities on FX

KECLThis stock breakout 12 years level and W pattern if strong candle closed i am considered good breakout
and this is only for educational purpose only

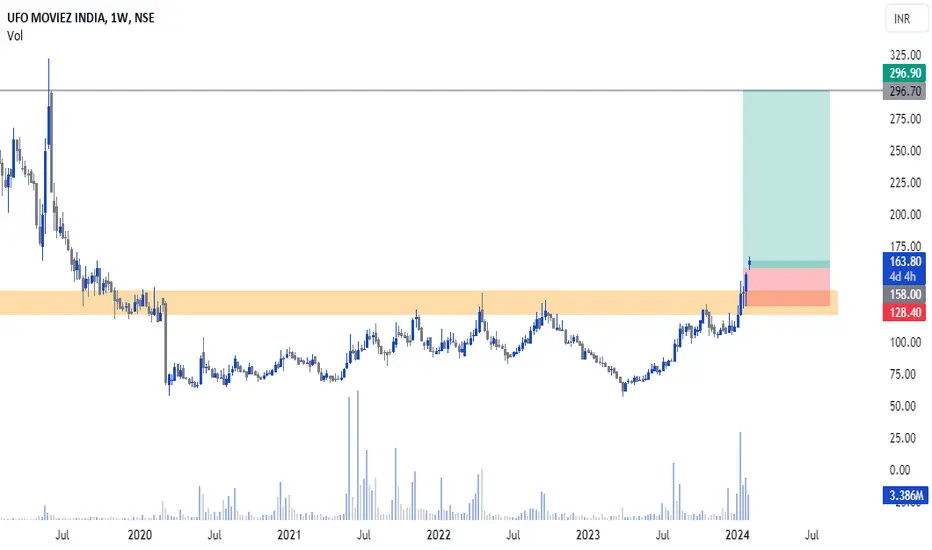
UFOThis stock breakout 2 year consolidation level and major resistance level TGT will be 296
this is only for educational purpose only

BHELBHEL breakout major resistance level and 13years level breakout TGT will be 344 This is only for educational purpose only


The USD index look set to trade to and through 104We have remained bullish the US dollar the past few weeks, and continue to suspect there are plenty of shorts to be covered as markets finally concede that fewer Fed cuts are coming this year and already priced in.
The dollar has posted a strong rally YTD, and after a brief consolidation momentum is trying to turn higher with a bullish outside candle. It's not major surprise to see it is holding beneath the 200-day EMA, but it did close above the 200-day MA. And if the US delivers a strong set of flash PMI figures or PCE inflation data, we suspect the US dollar can travel to and through 105 on its way to 105.

Potential swing trade long on AUD/USDLike NZD/USD, the Aussie is refusing to roll over despite a strong US inflation report. That is in itself a sign of strength.
The daily chart is yet to see a close beneath the Q3 open, and the lows are holding above the 50-day EMA and 38.2% Fibonacci level. A bullish RSI divergence also formed from the oversold zone to suggest a swing low has formed or is near.
The bias remains bullish above last week's low ad for an initial move to 0.6750 - a break above which assumes a move for 0.6800.

The DAX could be at (or near) a swing lowIndex futures held their ground overnight, and the US dollar's rally is showing signs of near-term exhaustion. And that indicates a subtle change in sentiment ahead of today's open.
The DAX found support at its 50day EMA on Wednesday, which is just above the 2021 high. Given a small-ranged bullish hammer formed alongside higher volume suggests a 'change in hands' between sellers to buyers, so we're on guard for a bounce.
Bulls could seek to enter within yesterday's range with a stop beneath the 2021 high and initially target gap resistance around 16,490 - a break above which brings 16,600 into focus for bulls.
However, as we suspect the US dollar is set to extend its gains after a pause in its rally and that equities are yet to make a decent retracement, we're anticipating another leg lower towards the support zone just above 16,000.

EURAUD - Look for Continuation Short 1:5! Building upon the previous analysis of EURAUD as shared in the link:
The recent price action indicates a ranging phase before a potential break of the previously identified Monthly Support Level. Considering the principle that larger time frames involve longer accumulation phases before transitioning into trending phases, it seems plausible that a downtrend may be in the making. The two strong rejections and the formation of a Double Top Chart Pattern, a reversal pattern, support this observation.
In navigating this scenario, exercise patience and adopt a waiting approach for the price to convincingly break the monthly support. Seek confirmation through a strong breakout with a closed body and be vigilant for the crucial retest phase before considering any moves.
Given the onset of a new Yearly Candle, it's advisable to allow the price to establish its own structures, especially after most investors have positioned their orders. Stay tuned for further developments.

AUDCHF: Trend-Following Opportunity 🇦🇺🇨🇭
AUDCHF is trading in a bearish trend.
After a strong selling wave, the pair was consolidating for 2 weeks
within a narrow range on a daily.
Yesterday, the support of the range was broken.
We see its retest now.
I expect a bearish movement lower.
At least to 0.5636 level.
❤️Please, support my work with like, thank you!❤️

ITI for Swing/Positional ViewITI Prediction for Swing/ Posional Trading
First trendline breakout at Entry 1 level. You can entry at Entry 1 level above 125.5 but there is a resistance 132-134 level. You can enter in trade at Entry 2 level above 134 close daily basis or you can entry at any of the above levels according to your experience.
SLs- 122,118,112( according to your entry and RRR)
Targets- 144,165,197,250,…
Intermediate Targets- 140,155,176,187,208,219,229,240,260,…
According to your “STOMACH” book your profit. Always maintain your risk management.
Watch Carefully – The Chart Explains For Itself.
Can anyone tell me which chat patterns are shown up here?
Disclaimer:
I am not a SEBI Registered Analyst. Anything posted here is my own analysis and views. This is created for educational purposes only. Always consult your Financial Advisor before taking any decision or trade.
Request: Please support by Like, follow, comment, share and boost.
Happy trading.
About ITI -
ITI Ltd. engages in the business of manufacturing, trading, and servicing of telecommunications equipment and rendering other associated and ancillary services. It offers telecom products and total solutions covering the whole spectrum of switching, transmission, access, and subscriber premises equipment. The company was founded in 1948 and is headquartered in Bangalore, India.
You can follow me in social media through links given below-

Bearish potential detected for UUP & DXY (ie --> USD weakness)Following US dollar strength looking at DXY during the final hour of trade this morning on the US markets, both DXY and UUP represent a potential bearish opportunity should momentum continue and lower highs and lower lows be made past the current position, aligning with technical indicators of RSI and DMI. Personal stop loss for the trade would be the high of the chart formation on 03-Oct (i.e.: above the high of $30.07 for UUP and $107.348 for DXY).
