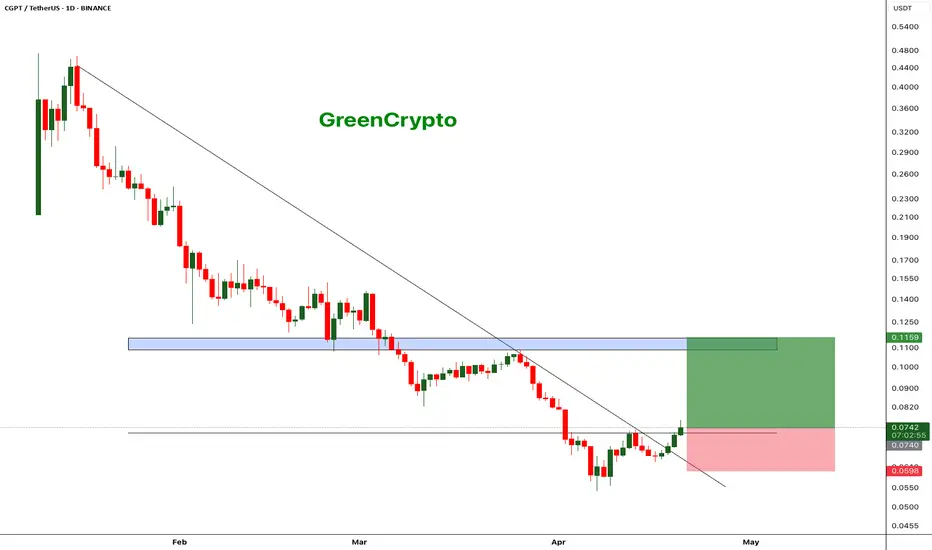
CGPT - Decent Swing Trade Opportunity $BINANCELCGPTUSDT (1D CHART) Technical Analysis Update
CGPT is currently trading at $0.0740 and successfully broke out from the local resistance and heading towards the next resistance. This gives a good opportunity for a quick swing trade with tight stoploss.
Entry level: $ 0.0740
Stop Loss Level: $ 0.0599
TakeProfit 1: $ 0.0818
TakeProfit 2: $ 0.0952
TakeProfit 3: $ 0.1114
Max Leverage: 2x
Position Size: 1% of capital
Remember to set your stop loss.
Follow our TradingView account for more technical analysis updates. | Like, share, and comment your thoughts.
Cheers
GreenCrypto
Swingtrade
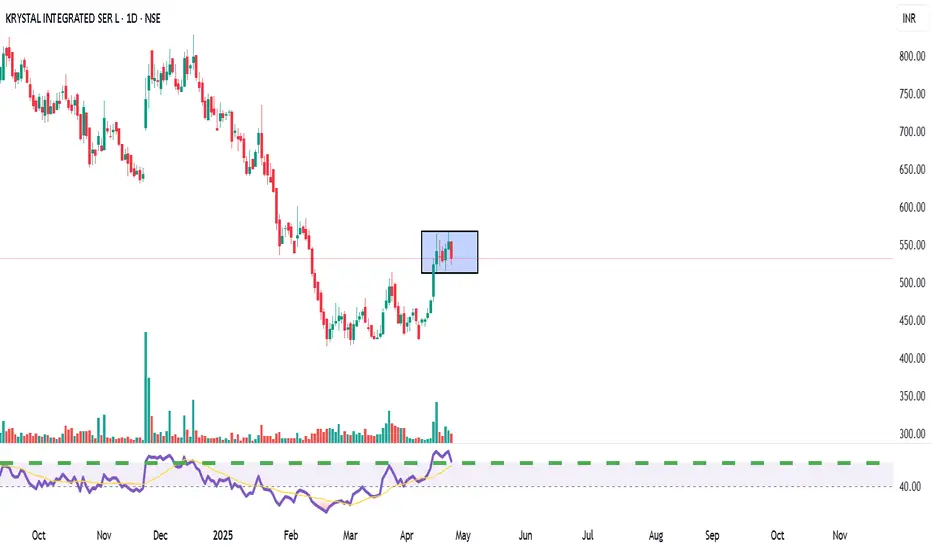
KRYSTAL Integrated Services LtdTechnical View: KRYSTAL is consolidating between ₹520–₹550 after a rally from March lows. A breakout above ₹560 could target ₹600+, while a dip below ₹500 may weaken momentum. RSI shows moderate bullishness.
Fundamental View: FY24 revenue grew ~44% YoY to ₹981 Cr; net profit rose ~26% to ₹48 Cr. ROE ~18%, ROCE ~20%. Recently secured a ₹349 Cr 3-year contract from Tamil Nadu Medical Services.
Action Plan:
Short-term: Buy above ₹560, target ₹600.
Long-term: Attractive valuation; accumulate on dips ₹450–₹500 zone.
GBPJPY 4h Long Setup Clear bullish structure with clean higher highs and higher lows intact
Price formed a bull flag after a strong impulse leg showing continuation potential
Breakout of the flag confirms momentum with aggressive bullish candle and volume
Entry : 192.459
SL : 188.167
TP : Trail 195.898
RR 1 : 3.1
Market is flowing with bullish pressure and breakout indicates wave extension
No counter structure in sight, trend continuation expected
Let the market breathe and move

MANORAMA Industries Breakout Above Resistance | Short-Term Rally🧾 Financial Content for Client (Performance FY25)
Revenue Growth:
Strong topline growth as per latest quarterly results (Q4FY25), showing consistent demand recovery and margin stability.
Profitability:
Net profit margins have improved on the back of better operational efficiencies and strong demand for specialty fats and oils.
Balance Sheet Strength:
Debt levels remain manageable; focus continues on maintaining a healthy asset-light model.
Future Outlook FY26:
Expanding international orders, coupled with premium product segment focus, is expected to drive double-digit revenue growth.
Management Commentary: Positive tone about expansion and demand pickup in domestic + export markets.
Learning Content
Price Action: Manorama Industries is at a crucial horizontal resistance (~₹1200), a major previous supply zone.
Volume: Recent breakout attempt supported by a significant spike in volume, which is a strong bullish signal.
RSI: RSI is near the overbought zone (>70), indicating strong momentum but also a caution for possible pullback if not sustained.
📊 Recommendations
Intraday Recommendation:
Bias: Bullish
Entry: Above ₹1215
Intraday Target: ₹1245 – ₹1265
Stop Loss: ₹1185
Short-Term Recommendation (1–3 weeks):
Bias: Bullish
Entry: Above ₹1215–₹1230
Target 1: ₹1300
Target 2: ₹1370
Stop Loss: ₹1160
for educational purpose only

Russell 2000 - Sell till late May & Buy in Early June?
Wave (ii) is still in progress. Slight update to the primary wave count from the previous one below.
200 & 100 SMA's are sloping firmly to the downside therefore I will continue to keep selling at technical levels. Late May or early June would be a good time to go long...
Support levels are shown in green.

ONE POINT ONE SOL LTD bullish reversal pattern✅ Trade Setup (Swing Trade)
📌 CMP: ₹62.21
🟢 Entry (Buy Zone): ₹60–₹63
🎯 Targets:
Target 1: ₹69.80 (Fibo 0.382)
Target 2: ₹78.50 (Fibo 0.5)
Target 3: ₹87.30 (Fibo 0.618)
🛑 Stoploss: ₹55 (below wedge breakout and recent support)
⚖️ Risk-Reward Ratio:
Entry: ₹62 | SL: ₹55 | Target 1: ₹70 → ~1:1
For higher targets, risk-reward improves to 2:1 or more.
for educational purposes only

U.S. Stock Swing TradeBRK.B
This stock remains one of the few in the U.S. market that continues to exhibit technical strength, maintaining a well-defined uptrend.
Current price action suggests a potential buy-on-dip opportunity near key support levels.
Entry Zone: 494 – 501
Take-Profit Target: 518 – 530
Stop Loss: 488
That said, it remains essential to closely monitor the S&P 500 index, along with prevailing macroeconomic developments, which continue to exert significant influence on market sentiment.

Sanathan Textiles | Breakout After Rounded Bottom Setup Overview:
The stock has formed a rounded bottom pattern, indicating accumulation and a potential breakout.
Strong bullish weekly candle with a 10% gain and breakout above resistance box.
RSI showing an upward breakout from oversold zone = bullish momentum building.
Recommendation
Buy Zone: ₹410–₹420 (current market price ₹417.60)
Stoploss: ₹378 (below last higher low and box bottom)
Target 1: ₹480
Target 2: ₹525
Target 3 (swing): ₹600+
⏳ Ideal for swing to medium-term traders (1–8 weeks holding time).
for educational purposes only

Russell 2000 - one more drop to complete the correction?Looking for the double zig zag correction to complete (Y) leg in the blue zone. Will be looking for five waves to the downside for the target.
Updated the wave count from my previous chart below...
This drop from the 25th November 2024 to the expected target zone would be more or less similar to the Covid drop in terms of percentage.

Russell 2000 - 5th wave of Y leg may already be in progress... The rejection at 2100 price level also happens to be the 38.2% Fib of the decline from the 14th of February 2025. The decline from 6th of February 2025 counts beautifully as waves 1, 2, 3 & 4. If this wave count is correct, then the Russell is currently in wave 1 of 5 of Y of (ii).
This is my primary wave count as long as the 2100 resistance is not breached.
This changes my initial wave count from a complex WXYXZ to a simple WXY.
Click on the link to see the previous wave count which is still valid and is now an alternate wave count if the 2100 resistance is breached:
Only updating the wave count. My bias and direction remain the same.
Wave Y is possibly in progress. Looks like we are going to have a bearish April & possibly May as well. Selling corrective rally is still the way to trade for now. Take profit at 1905/1900, which is where technically, the Russell 2000 will possibly turn up for wave (iii).
Stop Loss can be placed above wave 4, well out of the way in case of any wild swing on this PCE Friday.

Russell 2000 - time to Buy pullbacks...Shorts were good while it lasted... looks like a good time to buy pullbacks.
It would be wise to wait for a clear 3 wave correction though.
Elliot Wave Analysis shows a larger degree wave IV was completed in March 2020.
Since then, the Russell 2000 has been nesting within a bullish rectangle chart pattern, possibly working its way up to the larger degree wave V.
Seasonality Chart shows a bullish April with a possible correction in May.
Nevertheless, I will not commit to long trades till the chart clearly shows that we are out of the woods. A clear 3 waves move down closer to 1800 in the hourly/4 hourly time frame would be a good setup.

Swing Trading: Unique Features and StrategiesSwing Trading: Unique Features and Strategies
Swing trading stands out as a dynamic approach in the trading world, blending elements of both short-term and long-term strategies. In this article, we will explore the unique features of swing trading, including its reliance on technical analysis, the use of chart patterns, and the strategic timing of entries and exits. Whether you're new to trading or seeking to refine your approach, understanding the nuances of swing trading can provide valuable insights into navigating the financial markets.
The Basics of Swing Trading
Swing trading meaning refers to a style that involves holding short- and medium-term positions - usually from a couple of days to a few weeks - with the aim of capitalising on the “swings” in the market.
What is a swing trader? A swing trader’s definition is simple: swing traders are those who typically enter and exit markets at significant support and resistance levels, hoping to capture the bulk of expected moves.
These traders tend to look at hourly to weekly charts to guide their entries, although the timeframe used will depend on the swing trader’s individual approach and the asset being traded. Swing trading can be used across all asset classes, from stocks and forex to cryptocurrencies* and commodities. In the stock market, swing trading can be especially effective, as stocks tend to experience high volatility and are subject to frequent news and events that can drive prices.
Swing traders predominantly use technical analysis to determine their entries and exits, but fundamental analysis, like comparing the interest rates of two economies, can also play a significant role. It can help determine a price direction over the course of days or weeks.
Swing Trading vs Other Styles
To better understand the unique features of swing trading, let’s compare it with our styles.
Position trading involves holding trades for weeks and months, focusing on capturing long-term trends. Position traders are less concerned with short-term fluctuations and are more likely to use fundamental analysis, such as economic data and company earnings, to make their decisions. This style requires patience and a long-term perspective, with fewer trades but potentially larger returns per trade.
Swing trading involves holding trades for several days to a few weeks, aiming to capture short- and medium-term price movements within a larger trend. This style balances the need for active market participation with the flexibility to not monitor trades constantly. Swing traders primarily rely on technical analysis to identify entry and exit points, focusing on chart patterns and indicators.
Day trading requires traders to buy and sell assets within the same trading day, often holding positions for just minutes or hours. The goal is to capitalise on intraday price movements, and traders close all positions before the market closes to avoid overnight risk. This style demands constant market monitoring and quick decision-making, with a strong reliance on real-time technical analysis.
Scalping is an ultra-short-term trading style where positions are held for seconds to minutes, aiming to make small profits on numerous trades throughout the day. Scalpers rely almost entirely on technical analysis and need to act quickly, often executing dozens or hundreds of trades daily. The focus is on high-frequency trading with very tight stop-losses, requiring intense concentration.
Swing Trading: Benefits and Challenges
Although swing trading provides numerous opportunities which makes it popular among traders, it comes with a few challenges traders should be aware of.
Benefits:
- Lower Time Commitment. One of the most significant benefits for swing traders is the reduced time commitment. This style can be adapted to suit a trader’s individual schedule.
- Flexibility. It is often more flexible than other styles. Not only does it offer time flexibility, but it allows for a wider range of tools to be used to determine price swings. Also, it can be applied to many assets. The most common is swing trading in forex and swing trading in stocks.
- Technical Analysis Focus: Utilises technical indicators and chart patterns to identify entry and exit points, providing clear criteria for decision-making.
- More Opportunities Compared to Long-Term Techniques. Because swing traders usually hold positions for a few days to a few weeks, they have the ability to take advantage of shorter-term market movements that might not be reflected in longer-term price trends.
Challenges:
- Exposure to Overnight Risk. Positions held overnight or over weekends can be affected by unexpected news or events, leading to potential gaps or adverse price movements.
- Requires Patience: Effective swing trading requires waiting for trades to develop over days or weeks, which may test a trader's patience.
- Market Volatility: Performance can be impacted by periods of low volatility or choppy markets, where price movements may not align with your expectations.
Popular Tools to Use When Swing Trading
The effectiveness of a swing traders’ strategies will ultimately depend on their ability to correctly identify price movements. For this, traders use different chart patterns and technical indicators. Here are three common tools that can be used as part of a swing trading strategy.
Channels
Traders can use channels to take advantage of well-identified price trends that play out over days and weeks. To plot a channel, you first need to identify a trending asset that’s moving in a relative zig-zag pattern rather than one with large jumps in price. Traders will often use the channel to open a swing trade in the direction of the trend; in the example above, they might look to buy when the price tests the lower line and take profit when the price touches the upper line of the channel.
Moving Averages
Moving averages (MAs) are one of the commonly used indicators and they can help swing traders determine the direction of the trend at a glance. The options here are endless:
- You could pair fast and slow moving averages and wait for the two to cross; this is known as a moving average crossover. When a shorter MA crosses above a longer one, the price is expected to rise. Conversely, when a shorter MA breaks below a longer one, the price is supposed to decline.
- You could stick with one and observe whether the price is above or below its average to gauge the trend. When the price is above the MA, it’s an uptrend; when it’s below the MA, it’s a downtrend.
- You could use an MA as a support or resistance level, placing a buy order when the price falls to the MA in an uptrend and a sell order when it rises to the MA in a downtrend.
Fibonacci Retracements
Lastly, many swing traders look to enter pullbacks in a larger trend. One of the most popular ways to identify entry levels during these pullbacks is the Fibonacci Retracement tool. Traders typically wait for a shift in price direction, then apply the tool to a swing high and swing low. Then, they enter at a pullback, usually to the 0.5 or 0.618 levels, to take advantage of the continuation of the trend. As seen above, this strategy can offer entry points for those looking to get in early before a trend continues.
The Bottom Line
Swing trading stands out for its ability to balance the demands of active trading with the flexibility of longer-term investing. The unique features of swing trading, such as its moderate holding periods and strategic use of technical indicators, allow traders to potentially manage risk and adapt to various market conditions. Embracing swing trading strategies can help traders refine their approach. As with any trading style, continued learning and disciplined execution are key to achieving consistent results.
FAQ
What Is Swing Trading?
Swing trading is a style that involves holding positions over a period of several days to weeks to take advantage of price movements within a trend. Swing traders use technical analysis, including chart patterns and indicators, to identify potential entry and exit points, balancing the need for active participation with a longer-term perspective.
What Is Swing Trading vs Day Trading?
Swing trading and day trading are distinct methods. The former focuses on capturing price movements over several days to weeks, allowing for less frequent trading and requiring less constant market monitoring. In contrast, the latter involves buying and selling assets within the same trading day, often holding positions for minutes or hours, and requires continuous market observation and quick decision-making.
What Is the Downside of Swing Trading?
The downsides of swing trading include exposure to overnight and weekend risks, as positions held outside market hours can be affected by unexpected news or events. Additionally, this method requires patience and discipline, as trades may take time to develop, and performance can be impacted by periods of low volatility or choppy markets.
*Important: At FXOpen UK, Cryptocurrency trading via CFDs is only available to our Professional clients. They are not available for trading by Retail clients. To find out more information about how this may affect you, please get in touch with our team.
This article represents the opinion of the Companies operating under the FXOpen brand only. It is not to be construed as an offer, solicitation, or recommendation with respect to products and services provided by the Companies operating under the FXOpen brand, nor is it to be considered financial advice.

Can EURUSD Take Out the Major High 1.12000?EURUSD Major Forex Pair
Following Trump’s tariff policies announced on Friday, the price of the EURUSD forex pair broke the daily higher high structure and is now returning to retest that level. This morning, the price bounced off the 0.618 daily Fibonacci level, suggesting that it may move upward again, potentially reaching the major high around 1.12000 or hitting one of the Fibonacci extension levels.
Price Action on the 4-Hour Chart
I have shifted down to the 4-hour chart to analyze the price action in more detail. While it appears somewhat chaotic due to Friday's news and the aggressive bullish impulse, it’s encouraging that the price broke through the higher high structure and is now retesting it.
At this point, I would like to see the price remain above the 0.618 daily Fibonacci level and stay within the upward trendline. Additionally, the price is forming a symmetric triangle. Once it breaks out of this pattern, I plan to enter a buy position with a risk-to-reward ratio of 1:2, targeting the supply area near the major high.
I will provide an update as more price action develops later in the week, so stay tuned!

A few scenarios for the SPY! 🔉Sound on!🔉
📣Make sure to watch fullscreen!📣
Thank you as always for watching my videos. I hope that you learned something very educational! Please feel free to like, share, and comment on this post. Remember only risk what you are willing to lose. Trading is very risky but it can change your life!

Castrol India - Swing trading setup!Castrol India - Swing trading setup!
Note: This is not a trading recommendation. This analysis is for educational purposes only. We'll know in few days if the price moved as per the study.
It is not advisable to go long when the general market is trending low.

XAUUSD – Bullish Breakout from Triangle | 3,090+ in SightGold (XAUUSD) has broken out of a symmetrical triangle consolidation on the 1H chart, signaling bullish continuation. With solid technical structure and momentum building, the path toward 3,093+ remains firmly in play.
📊 Technical Breakdown
1. Symmetrical Triangle Formation
Price coiled within a classic symmetrical triangle, forming higher lows and lower highs—typically a continuation pattern in trending markets.
A breakout has now occurred to the upside, confirming bullish bias.
2. Breakout Projection
The measured move from the triangle projects a 2.62% upside, targeting the 3,093 zone.
3. Clean Market Structure
Bullish impulse followed by healthy consolidation reflects market strength.
Expectation: Price will print higher highs and higher lows on its way to upper targets.
🎯 Bullish Targets
TP1: 3,047.652
TP2: 3,058.038
TP3: 3,093.957
These levels are based on recent structure highs and the measured move from the breakout.
📌 Trade Plan
Entry Idea: On triangle breakout retest or momentum continuation above 3,025
Stop Loss: Below triangle support (~3,000)
Risk-to-Reward: Favorable on breakout continuation setups
🔎 Confluences
✅ Symmetrical Triangle Breakout
✅ Strong Bullish Trend
✅ Measured Move & Clear Targets
✅ Consistent Market Structure
Gold bulls are stepping in with strength. As long as price holds above the breakout zone, expect further upside toward 3,090+.
Want a version with SL-to-BE logic or trailing TP adjustments? Just let me know!

ETHUSD – Bullish Quasimodo + iH&S Breakout | Upside Targets!Ethereum (ETHUSD) has completed a textbook bullish Quasimodo pattern in confluence with an Inverse Head & Shoulders (iH&S) on the 15-minute timeframe. Price has broken out with strong bullish momentum, and the structure suggests more upside ahead.
📊 Technical Breakdown
1. Quasimodo Pattern
A well-defined Quasimodo reversal formed at the swing low, providing early signs of a bullish trend shift.
This pattern combines a higher low and reclaimed structure—offering an excellent base for trend continuation.
2. Inverse Head & Shoulders
Left Shoulder, Head, and Right Shoulder clearly structured with neckline breakout confirmed.
Breakout above neckline resulted in a 5.38% rally into minor resistance.
3. Bull Flag Formation
A short consolidation just below the recent highs resembles a bull flag, typically a continuation signal.
Breakout from the flag would trigger the next leg toward the final target.
🎯 Targets
Minimum Target: 2,121.41 — aligns with neckline projection.
Final Target: 2,229.90 — 6.27% projected move based on iH&S measured move.
📌 Trade Idea
Entry Zone: On bull flag breakout above 2,093
Stop Loss: Below 2,060 (flag low support)
TP1: 2,121
TP2: 2,229
🔎 Key Confluences
Pattern Breakouts ✅
Strong Momentum ✅
Clean Structure & Price Geometry ✅
ETH bulls have reclaimed short-term control. If momentum sustains, the upside targets are well within reach.

BTCUSD – Rising Wedge Breakdown Setup | Short OpportunityBitcoin (BTCUSD) is trading inside a rising wedge pattern on the 4H chart—typically a bearish reversal structure. Price is currently hovering near the wedge resistance and a previous supply zone, presenting a clean short opportunity with solid risk-to-reward.
📊 Technical Breakdown
1. Rising Wedge Formation
The price action has formed a clear rising wedge, a pattern often associated with a bearish breakout.
Current price action shows momentum fading near the wedge top, aligning with historical resistance.
2. Key Sell Zone
The 88,600–89,000 region marks an ideal short-entry zone.
This overlaps with a prior consolidation/supply block and wedge resistance—making it a high confluence zone.
3. Bearish Target & Projection
Breakdown of wedge support could drive price down toward the target zone near 78,000, a potential -8.89% move.
This target zone acted as a strong demand area in mid-March and is likely to attract buy interest again.
📌 Trade Plan
Sell Entry: Around 88,600–89,000
Stop Loss: Above 92,923 (beyond wedge + supply zone)
Target: 78,000 zone, prior demand and technical projection
Risk-to-Reward: High conviction R:R setup with structured invalidation
⚠️ Watch for Confirmation
Ideal confirmation would be a strong bearish 4H candle below wedge support or bearish divergence on RSI/MACD.

EUR/USD | Bearish Breakdown & Retest | Short Setup EUR/USD VIP Short Setup | Smart Money Move 🔥📉"
Chart Analysis:
Ascending Channel Breakdown: EUR/USD broke below a well-respected bullish channel, signaling a potential downtrend.
Retest & Resistance: Price is currently retesting the broken structure near 1.08565, a key resistance zone.
Sell Confirmation: The rejection at this level suggests bearish momentum.
Target: The next major support lies at 1.06513, aligning with previous price action levels.
Trading Plan:
✅ Entry: Around 1.08155 - 1.08565 (after rejection confirmation)
✅ Take Profit: 1.06513
✅ Stop-Loss: Above resistance for risk management
Summary: Smart money is eyeing this short trade after a strong bearish breakout. A retest of resistance gives a prime entry for sellers. 📉🔥

EURUSD – Rising Wedge Breakdown | FVG in PlayEURUSD has broken down from a Rising Wedge pattern on the 1H timeframe, suggesting a bearish momentum shift after a strong rally. The current price action indicates a likely continuation lower, targeting the Fair Value Gap (FVG) zone and major support near 1.07047.
📊 Technical Breakdown
1. Rising Wedge Pattern
A clean bearish rising wedge formed during the uptrend, with price contracting upward and volatility drying.
The breakdown from this wedge came with strong bearish momentum, confirming the pattern's bearish bias.
2. Fair Value Gaps (FVGs) as Draws on Liquidity
Two unmitigated FVGs lie below current price:
First zone near 1.0780
Second deeper zone near 1.07047, aligning with the projected measured move of the wedge breakdown.
These zones act as magnetic targets for price to fill inefficiencies and collect liquidity.
3. Bearish Retest Structure
Price is currently forming a potential retest of the broken wedge structure, which could provide an ideal short entry opportunity.
Expected continuation downward upon rejection from this retest zone.
🧠 Trade Idea
Entry Zone: After confirmation of rejection near 1.0850 (retest of wedge)
Target: 1.07047 (FVG & measured move confluence)
Stop Loss: Above 1.0885 (above wedge structure)
Risk-Reward: Solid setup with FVG and structure confluence
⚠️ Key Levels to Watch
Resistance: 1.0850–1.0880 (wedge retest)
Support/Target: 1.07047 (FVG fill + structure)
Break back above 1.0900 invalidates the short setup.

GBPUSD – Bearish Setup Forming | Fair Value Gap Rejection PlayThe 4H chart on GBP/USD shows a clean bearish market structure, with price currently in a corrective phase after recent downside momentum. A Fair Value Gap (FVG) has been identified between the 1.29700–1.30000 range, which acts as a key supply zone for potential short setups.
📊 Technical Breakdown
1. Fair Value Gap (FVG)
A visible imbalance was left after an aggressive bearish move—marked in the yellow zone.
Price is expected to retrace into this inefficient zone to fill orders before continuing downward.
The anticipated entry for shorts is around 1.29798, near the midpoint of the FVG.
2. Bearish Market Structure
Lower highs and lower lows dominate the current structure.
The bounce is corrective in nature and lacks momentum, indicating a potential bull trap.
Expecting a short-term retracement up to the FVG zone, followed by a continuation to the downside.
3. Target Zone
Target: 1.28042 — this level sits just above a previous demand zone, making it a natural TP1.
This area also overlaps with previous price reactions, giving it high confluence.
🧠 Trade Idea
Entry: ~1.29798 (within the FVG)
Target: 1.28042
Risk Management : A stop loss above 1.30000 or above the upper boundary of the FVG to account for false breaks.
Rationale: Risk-reward is favorable due to tight invalidation zone and strong downside continuation probability.
⚠️ Key Notes
Watch for confirmation at the FVG zone such as bearish engulfing or lower timeframe break of structure.
If price breaks above 1.3000 and holds, the idea will be invalidated.

+170% made from 2 swing picks this week $TNXP and $RGC+170% made from 2 swing picks this week 🚀
$13 to $19+ or 45% gain in 5 days NASDAQ:TNXP
$13.10 to $29.80 or +127% in 1 day NASDAQ:RGC

Breakout on DIS! 🔉Sound on!🔉
📣Make sure to watch fullscreen!📣
Thank you as always for watching my videos. I hope that you learned something very educational! Please feel free to like, share, and comment on this post. Remember only risk what you are willing to lose. Trading is very risky but it can change your life!
