GJ moved up 990 pips since wednesday reversal entry at 155.250GJ moved up 990 pips since Wednesday reversal entry at 155.250. We are at a resistance now, and possibly at the 3rd leg, so we could see a further push-up today with news, or have a strong retrace on the 4hr tf. If we go up to the next zone as marked, we could see a reversal or continuation tomorrow during New York session. Be cautious with news, don't be hasty
Swingtrade

SPAL LOW RISK HIGH REWORD TRADE >It has been made IHnS Pattern
>Making HH n HL formation
>PnF Pattern
>Given a BO

GBPNZD: Important Breakout 🇬🇧🇳🇿
GBPNZD broke and closed above a major supply area last week.
The broken structure turned into a demand zone now.
I believe that it will trigger a bullish continuation to 2.02 / 2.04 levels.
❤️If you have any questions, please, ask me in the comment section.
Please, support my work with like, thank you!❤️

BHARTIAIRTEL It has given small pop out, it has the potential to move higher.
DISCLIMER: This chart is just for educational purpose.

EURCAD: Very Bullish Outlook 🇪🇺🇨🇦
One more breakout that I spotted today is a bullish violation of a horizontal supply zone and a major falling trend line on EURCAD.
Forming a high momentum bullish candle, the market successfully closed above them both.
I think that it will trigger a further bullish continuation.
Next resistances: 1.358 / 1.368
❤️If you have any questions, please, ask me in the comment section.
Please, support my work with like, thank you!❤️

Bitcoin Day Trading Setups, Scalping Entries🖥️ We have determined there is a 72.5% chance Bitcoin will Rise from our current entry point.
📉 LONG - BTC : $19,075📉
💵 Length of trade: we are expecting BTC to hit a $700 scalp, with a high end of $1,100, and a minimum expectation of $450.
🕰️ Duration of trade: we are expecting the Min. Profit Target to occur in 4.5-6 hours of this signal.
- Then we see a longer duration of 14 hours for the Excepted Target. We are thinking possibly a longer term to 2 days for a continued recovery bounce.
📊🖥️ Indicator Shown on Chart : Scot Signal Indicator

RIVN - LONG SWING TRADE IDEARIVN could be a potential long trade for a few reasons:
First, it is forming a Buy Setup on the daily chart and it just put it a new higher low at an area of strong support
On entry, RIVN would be breaking out over three major daily moving averages (9 SMA (Purple), 21 SMA (Blue), 50 SMA (Yellow)) with room to correct to the 200 MA (Orange)
In support of the trade, RIVN has been stronger than the market during this recent move lower and it setting up to bounce with the market
Additionally, the 2:1 reward to risk is quite reasonable and could be exceeded if RIVN makes a strong move and breaks out of the double top at 41
A trailing stop loss is recommended as this is still a bear market and RIVN does have the double top as resistance. I would expect some price action around 37 as well due to retracement levels and previous areas of minor support/resistance

TATA ELXSI CAN MOVE 7% TO 21%It has taken multiple times support from a trendline at this time it can take support again, here we can enter with small SL and we can aim for higher targets.

AUDJPY 4H Swing4H RSI ready for the reversal! Inside a minor Demand Zone as well, lets look to take it to previous highs!

NZDJPY: Breakout & Bearish Forecast 🇳🇿🇯🇵
Update for NZDJPY pair.
It turned out, that the price managed to break and close below a key daily support.
82.1 - 83.28 is a solid supply zone now.
The pair will most likely keep falling to 80.0 support.
❤️If you have any questions, please, ask me in the comment section.
Please, support my work with like, thank you!❤️

EURUSD: Detailed Structure Analysis 🇪🇺🇺🇸
A lot of questions about EURUSD.
Here is my latest structure analysis and key levels to watch for you:
Analyzing a monthly time frame, I spotted 0.94 - 0.96 historical support
based on a price action of 2001 and 2002.
On a daily time frame, a bit lower, we have a support line of a major falling parallel channel.
The trend line and a monthly horizontal structure compose a solid demand zone from where the pair may bounce.
Concerning the resistances, I see 0.986 - 0.99 horizontal resistance and a resistance line of a channel.
They compose a supply area.
Consider these structures for pullback / breakout trading.
❤️If you have any questions, please, ask me in the comment section.
Please, support my work with like, thank you!❤️

Short CADJPYSince there are formation of compression of price with a bearish pole, it is high chance for price to drop until nearby resistance zone at 102.374. Use demand zone as a entry point and set stop loss (SL) beyond 106.384

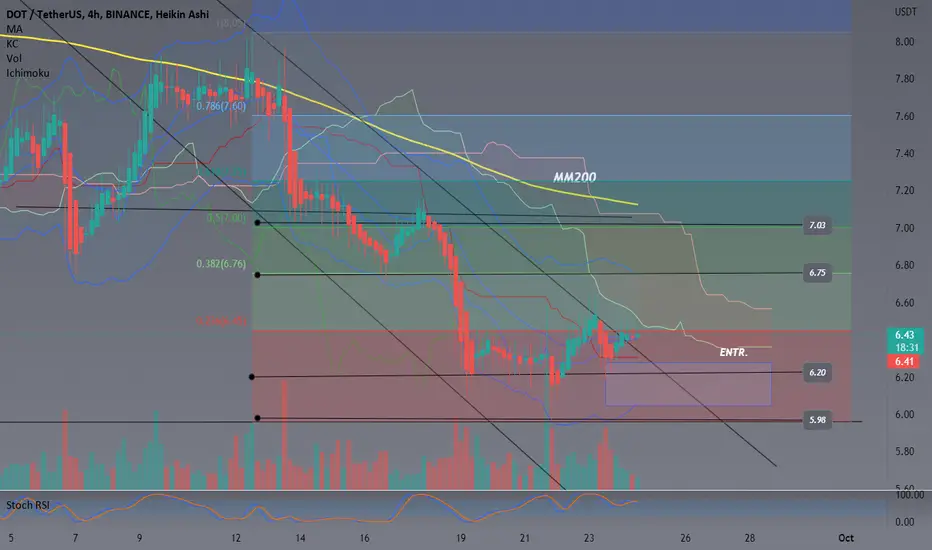
DOT USDT 4H - SWING TRADEDOTUSDT 4H – technical factors such as the 200-period moving average, coinciding with the monthly VWAP, points to an asset appreciation, it may experience resistance when passing through the ichimoku cloud, but it will quickly reach MM200. we can expect an advance to the $7.0 target however, let's wait for the DOT to reach $6.20 to make an entry. So from the limit order to the proposed target, we would have an average profit of 12% in the spot.
Operation to last around 7 days.
Entry price: $6.20
Exit Price: $7.00
Stop Loss: $5.98
****IMPORTANT NOT TO LEVERAGE FOR THE SUCCESS OF THE OPERATION***
In fundamental terms DOT, the very high octane coin, is a governance token, meaning that token holders have control over the Polkadot protocol through voting. It is also used to validate transactions through staking and to link Polkadot parachains (parallel blockchains).
If in doubt, call one of the administrators.
** Not an investment tip.
EURJPY - 240 MINS TIMEFRAMEThe Structure looks good to us, waiting for this instrument to correct and then give us these opportunities as shown on this instrument (Price Chart).
Note: its my view only and its for educational purpose only. only who has got knowledge about this strategy, will understand what to be done on this setup. its purely based on my technical analysis only (strategies). we don't focus on the short term moves, we look for only for Bullish or Bearish Impulsive moves on the setups after a good price action is formed as per the strategy. we never get into corrective moves. because it will test our patience and also it will be a bullish or a bearish trap. and try trade the big moves.
we do not get into bullish or bearish traps. we anticipate and get into only big bullish or bearish moves (Impulsive Moves).
Just ride the Bullish or Bearish Impulsive Move. Learn & Know the Complete Market Cycle.
buy low and sell high concept. buy at cheaper price and sell at expensive price.
Keep it simple, keep it Unique.
please keep your comments useful & respectful.
Thanks for your support....
Tradelikemee Academy

EURAUD 4H Chart, bearish direction55 pip SL, targeting 1:3RR. I am trading a continuation on this downtrend based off S-Zone, Support broken/turned Resistance, and some EMA crossovers for the retailers.

GBPNZD 4H Chart, Bearish Direction45 pip SL, targeting 1:3RR. After securing the win on previous GN short, i am going in on a continuation trade here off of an S-Zone.

Are you bullish on Short ETFs? $SQQQ $SPXUWhat do you see when looking aty these charts? I see higher highs and higher lows.
The NASDAQ:SQQQ broke a short-term trendline to the upside and then, the AMEX:SPXU followed.
Now the next test is the last week's high, which it seems that it will break today. If it does, the next resistance is at the June highs. Thats +34% for SQQQ and +25% for SPXU, it could be a really good swing trade.
You could also say that both ETFs are making a head & shoulders but until the neckline is broken is not a head & shoulders.

ARVIND FASION LTD SWING TRADELooks good for swing trade, market is to much volatile take trade accordingly.
in this trade Stop loss is big but rewords are also big, it has made a beautiful pattern and today it has given BO.
A swing trade can be taken.
DISCLIMER: This chart is just for educational purpose.

USDCAD 1H chart, Bearish Direction25pip SL targeting 1:3RR. USDCAD is in a massive 4H Supply Zone currently, and it has just created 1H RSI Divergence for entry. Just a simple easy analysis!

KIMS - Swing TRADENot a great pattern but its ok to give a try though its risk and Less and Reward will be high. Do your own analysis before trading

S&P500 Index (SPY) Detailed Video Analysis 📈
Multiple time frame analysis for S&P500 Index.
Price action, key levels.
Bearish scenario explained.
❤️Please, support this video with like and comment!❤️


Swing Trade - GSCL CEMENT A breakout with good volume. Swing Trade recommended. Expected TGT 60+ and will hold until Reversal is formed. Am not SEBI registered. Do your own analysis before taking the trade.
