Swingtrader

AUDUSD: Bearish Outlook For Next Week 🇦🇺🇺🇸
Hey traders,
We have spotted earlier a HUGE head and shoulders pattern on AUDUSD on a daily.
The price broke and closed below its neckline, turning that into a strong resistance.
Now a further decline is expected.
Next goal for sellers - 0.6735
❤️If you have any questions, please, ask me in the comment section.
Please, support my work with like, thank you!❤️

USDJPY: The Long-Term Goal 🇺🇸🇯🇵
This August was very bullish for USDJPY.
The monthly candle closes in just 13 hours, and we see a very cute bullish engulfing candle on the chart.
I want to remind you, traders, that we spotted earlier a confirmed violation of 20 years' high.
We concluded that such a violation will push the pair much higher.
I believe that the next long-term goal for buyers is 146.0 - 147.6 resistance, based on 25 years' high.
❤️If you have any questions, please, ask me in the comment section.
Please, support my work with like, thank you!❤️

EURGBP Swing, ShortEG is approaching an excellent Supply Zone on the 4H. We should see a very nice reaction here and a large drop to follow!

EURUSD: Detailed Technical Outlook For This Week 🇪🇺🇺🇸
Watch & learn what to look at on EURUSD this week.
Important structures identified.
Trading plan explained.
❤️Please, support this video with like and comment!❤️

AUDNZD: Important Structure Breakout 🇦🇺🇳🇿
Important thing happened this night on AUDNZD pair:
the price broke and closed above a wide daily supply area.
The broken structure turned into a support now.
The next goal for buyers is the narrow area around 1.128 level.
It is based on a key monthly structure and 5 years' high.
I will be patiently waiting for an occasional retest of the broken structure to buy AUDNZD.
❤️If you have any questions, please, ask me in the comment section.
Please, support my work with like, thank you!❤️

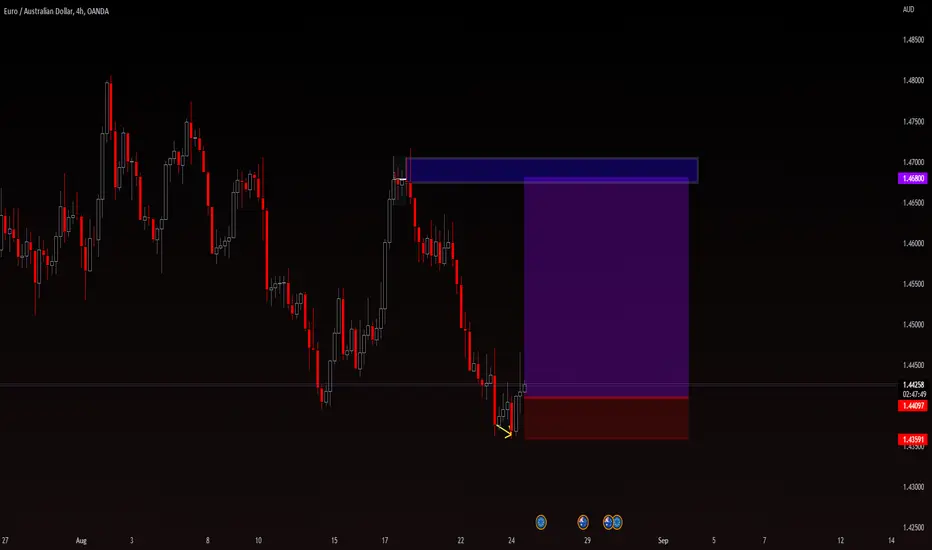
EURAUD 4H LongHere we have beautiufl 4H RSI Divergence into previous Demand, nice and easy gets the job done!
GBPCAD 4H LongMy oh my... GC has entered a huge Daily Demand Zone, and has presented us with 4H RSI Divergence!! You simply cant miss an opportunity like this!!

EURCAD: Important Breakout 🇪🇺🇨🇦
EURCAD broke and closed below a key daily structure support.
The broken structure turned into a strong supply area now.
Taking into consideration that the pair is trading in a long-term bearish trend,
that breakout may trigger a bearish trend continuation.
Next support - 1.282
❤️If you have any questions, please, ask me in the comment section.
Please, support my work with like, thank you!❤️

USDCHF Swing sellMy oh my! Look how 4H Supply is almost getting tapped into. Currently, iot is grabbing up orders for shorts from all retail "liquidity" traders who are targeting those previous wicks as entries. This should blast through all their stops and tap into Supply, which will activate all institutional orders and send this chart falling off a cliff.

NZDCAD: Bearish Outlook 🇳🇿🇨🇦
NZDCAD is trading in a global bearish trend.
Setting a new low in July, the market started a correctional movement within a bearish flag pattern.
The price finally broke its support on Friday and closed below that.
I assume that the pair may drop to a current low soon.
Goal - 0.795
❤️If you have any questions, please, ask me in the comment section.
Please, support my work with like, thank you!❤️

TTITechnical only :
Adding to my watch list in order to get a direction from the market.
There is a positive and a negative scenario.
Positive scenario - W pattern - Our first entry will be above 4.20 and our second entry will be above 4.50 with potential target of 5.75$.
The negative scenario - Below 3.76$ we will jump in to short position and even increase my holding if we will break the important 3.55$ level.
Our potential target will be 2.7 and than 2.35.
DYOR 🙊🍒
Manage your own risks

EURAUD 4H ShortBeautiful 4H Supply has been tapped into, creating a pinbar on the 4H as entry. This should be a very nice trade!

EURAUD 4H LongBeautiful beautiful beautiful Long opportunity is brewing for EURAUD. Demand has been tapped into, and we will soon see the 4H form RSI Divergence as our setup!

$LUCE - Beaten down reversal play with +50% to +100% upsideTechnical Analysis (TA)
On the weekly chart the momentum indicators are oversold. There are early signs over of a potential reversal.
On the daily chart the price is flat and there is a small wedge formed. We need price break above 115 and then we could potentially see LUCE reach 145 and 170.
Price Target
Entry: 115
Target 1: 145 (+26%)
Target 2: 170 (+48%)

GBPUSD BULL MOVEHere we can see a nice cup and handle pattern formed on the 4HR and 1HR chart which is more confirmation of my earlier analysis on the WEEKLY time frame. I personally use the 15M time frame for execution and entry and use the 1HR for perspective of momentum throughout the day. As you can see I have lined up entry point and TP points on the 15M time frame. The expectation from my point of view is that smart money will do a liquidity sweep and take SL from retail traders that bought the price at the low before the price enters into a strong bullish trend. So that is why my entry is at a low price in expectation of this but as traders we all know its a game of probabilities not certainty so I will be monitoring the market open tonight closely to see how the market is reacting. If price moves and hits both TP then I would then wait for the breakout of the cup and handle line and enter the trade again.

GBPAUD: Bearish Breakout & Bearish Continuation 🇬🇧🇦🇺
Bearish rally on GBPAUD continues.
The price is currently violating a major weekly demand cluster.
If this week's weekly candle closes below the underlined blue zone,
a breakout will be confirmed and a further decline will be expected.
Next support will be 1.69
❤️If you have any questions, please, ask me in the comment section.
Please, support my work with like, thank you!❤️

GBPCHF: Important Breakout & Bearish Continuation 🇬🇧🇨🇭
Hey traders,
GBPCHF is trading in a global bearish trend.
The pair started to consolidate in July and was stuck within a narrow range for 6 weeks.
Yesterday, bears finally managed to break and close the range's support.
I believe that the price will keep falling now.
Next goal - 1.141
❤️If you have any questions, please, ask me in the comment section.
Please, support my work with like, thank you!❤️

AUDUSD: Important Breakout & Bullish Continuation 🇦🇺🇺🇸
AUDUSD broke and closed above a key daily structure resistance.
That structure turned into support now.
I will expect a bullish continuation from that.
Goals:
0.7135
0.723
❤️If you have any questions, please, ask me in the comment section.
Please, support my work with like, thank you!❤️

US30 SHort, massive swing inboundWhere to start.. economy is shit, and the FED keeps printing money leading to an artificial bullish market. what could go wrong right?
*4H Supply Zone tapped into
*4H RSI Divergence is about to finish forming
*4H Pinbar to form showing insane rejection and candlestick confirmation
*15min RSI Divergence for entry.
This could be a killer

BTC Trend Weakening BTC price action has shown the first signs of weaknesses on bullish direction. First off, previous high/resistance of $24670 has not been broken neither tested weakening the weekly bullish set up over last month for the first time. Secondly we can notice bearish RSI Divergence highlighted by the white trendlines. Furthermore, MACD shows a bearish crossover in which indeed the MACD line passes below the Signal line. However, we are getting closer to 200EMA resistance and to the trend line which will work as strong support. For this reasons, if such a structure were to be invalidated we suggest to take a short position as the following:
Entry price: $22700
Target price: $22400
*30X Leverage

EURCHF: How to Catch The Next Bullish Move 🇪🇺🇨🇭
I have nicely predicted a pullback from a key weekly structure on EURCHF.
Ahead is a strong daily supply area.
To catch a further bullish continuation, wait for a bullish breakout (daily candle close above) of 0.9786 - 0.982 area.
After a breakout, a bullish continuation will be expected to 0.987 / 0.9915
❤️If you have any questions, please, ask me in the comment section.
Please, support my work with like, thank you!❤️

GBPUSD: Detailed Technical Outlook 🇬🇧🇺🇸
I received a lot of questions from you this morning about GBPUSD.
Even though the pair is very bullish from the middle of July.
I want to remind you that we are trading in a global bearish trend
and I would consider a current bullish move to be a correctional wave.
Analyzing a price action, I spotted a nice little bearish flag pattern.
I assume that the market will keep growing within than till it reaches some significant supply zone.
The closest such an area that I see is 1.233 - 1.2483 zone.
I will expect a bearish reaction to that zone and the trigger that I will look for to short the pair will be a bearish breakout of a flag's support.
Then a bearish continuation will be expected at least to 1.206
Alternatively, bullish violation of the underlined yellow structure may push the market to higher structure levels.
❤️If you have any questions, please, ask me in the comment section.
Please, support my work with like, thank you!❤️
