GOLD ANALYSIS FOR COMMING WEEKWE still have bearish movement on XAUUSD next week i will be expecting a short trade after small pull back to 1D invalidation level...
currently am looking to short till we reach our hidden level and see what we will get at that area if we manage to get a good rejection we will secure our profit and wait for price action of the following month..
Swingtrader

GBPNZD: Structure Trading With Confirmation 🇬🇧🇳🇿
GBPNZD is trading on a key daily structure support.
On 4H time frame the pair is ranging.
1.9425 - 1.945 is the resistance of the range
1.9335 - 1.9355 is the support of the range.
To buy wisely, I will look for a bullish breakout of the range's resistance. (4h candle close above the underlined area)
They open your trade aggressively or on a retest.
Goals will be 1.9545 / 1.9645
In case of a bearish breakout of the range, the setup will be invalid.
❤️Please, support this idea with a like and comment!❤️

EURJPY: Inside Bar & Complete Indecision 🇪🇺🇯🇵
EURJPY is trading on a strong daily key level.
The price formed an inside bar formation on that signifying complete indecision.
On 6H time frame we can see in detail how the price acts:
the pair is stuck within a narrow horizontal trading range.
130.75 is its resistance
130.15 is its support
From a current perspective I see two potential scenarios:
Bullish
In case of a bullish breakout of resistance of the range,
bullish continuation will be expected
Next daily resistance will be 131.07
Bearish
In case of a bearish breakout of support of the range,
bearish move will be expected
Next support will be 129.675
I am on a bearish side and will trade only in case of a bearish breakout,
but who knows.
❤️Please, support this idea with a like and comment!❤️

GBPUSD: Market Breakdown & Multiple Time Frame Analysis 🇬🇧🇺🇸
Top-down analysis on GBPUSD.
Price action & key levels.
Trading recommendations & thoughts.
❤️Please, support this idea with a like and comment!❤️

An Introduction To Trading Inside Bar SignalsToday’s lesson is an introduction to the inside bar signal and how to trade it. It’s really one of my favorite patterns to trade, especially on the daily chart time frame. Why, you ask?
It’s simple. The inside bar pattern shows a pause or indecision in the market, and depending on the surrounding price context it formed within, this provides us with an extremely valuable clue about what a market is about to do next.
The inside bar is yet another “tool” in your price action toolbox that will add to your trading strategy which when mastered will help improve your chances of long-term trading success.
Let’s get started with some introductory concepts and theory on inside bars…
What is An Inside Bar?
An inside bar pattern is a multi-bar pattern that consists of a “mother bar” which is the first bar in the pattern, followed by the inside bar. An inside bar pattern can sometimes have multiple inside bars within the same mother bar.
Here is what standard inside bars look like:
As you can see by the image below, inside bars can form exactly in the middle of the mother bar or close to either the high or low, there is not an EXACT way they have to look, just as long as they are contained within high to low distance of the mother bar
4 Variations of Standard Inside Bars
1. Double (multi) inside bar
The “double inside bar” consists of two inside bars within the structure of the mother bar. They are pretty common and often times you will even see 3, 4 or sometimes (rarer) even more inside bars within the same mother bar structure. These patterns signify a prolonged period of indecision in the market and they can come before very powerful breakout moves…
2. Coiling Inside Bars
Coiling inside bar patterns occur when 2 or more inside bars are “coiling” up tighter and tighter like a spring, within one another. Pay special attention when you see these because they mean the market is contracting and just like a spring wound up tighter and tighter, eventually it’s going to “release” and explode into a powerful move (in many cases).
3. Fakey Pattern (inside bar false-break )
The fakey trading pattern is very important in regards to inside bars because there is an inside bar pattern within a fakey. As you can see below, a fakey is actually a false break out from an inside bar pattern. It’s literally where price initially breaks one way from an inside bar pattern, but then quickly reverses, sucking everyone out who was wrong and then charging back the other direction. Obviously, these are giving us VERY intelligent clues as to the next potential direction in price.
4. Inside Bar Pin Bar Combo Pattern
As we all know, pin bars are one of the best price patterns you can trade and when it’s when you get a pin bar that is also an inside bar, that you have an inside bar pin bar combo pattern.
When you combine a pin bar into an inside bar, you are getting both a “wind-up” that is going to be released and a pin bar with a tail / shadow that indicates the next potential direction of the market. Hence, an inside bar is not just a pause in the market, it’s a pause with an extra piece of confluence behind it, and as a result, a more powerful price action signal.
Trading Inside Bar Patterns
There are essentially two main ways we can look to trade inside bars, as with most other patterns; as a continuation signal or as a reversal pattern.
Now, I prefer to trade them as continuation signals in trending markets on the daily chart, because that’s the easiest way to trade them quite frankly. However, inside bars CAN indeed be very powerful at major support and resistance levels as reversals. Let’s look at some examples:
1. Trading Inside Bars as Continuation Move s
The “classic” way to trade an inside bar pattern, and the way that I love trading them the most, is within a trending market, as a continuation move.
An inside bar is much easier to take in a trending market because the odds are already in your favor for trading with the trend. The inside bar will many times lead to a breakout or continuation in-line with the existing trend direction. They can provide a good structure to try to pyramid your trade into a huge win.
Tip : Avoid trading inside bars at major levels until the level has cleared, because many times such inside bars will create a false break at the major level.
2. Trading Inside Bars as “Stall Patterns” / Reversals
Sometimes, you can trade an inside bar as a reversal / stall pattern where price “stalls” out at a level and that leads to a reversal back the other direction.
In the chart below, we can see an example of a good inside bar reversal signal. Notice that the inside bar formed at a key chart level, indicating the market was hesitating and “unsure” if it wanted to move any higher. We can see a strong downside move occurred as price broke down past the inside bar’s mother bar low..
Please note that trading inside bars as reversal patterns should ONLY be tried after you have successfully mastered trading them in-line with the daily chart trend as continuation / breakout plays, as we discussed above.
Special Inside Bar Trading Tip s
Here are some of my tips and tricks when trading inside bars. These are things that I learned over the years that will improve your chances of success when trading this pattern:
1. Tighter inside bar patterns and coiling inside bar patterns often lead to explosive large break out moves. This is because of the “stored energy” that took place as the market “coiled”, that energy typically gets released in the form of a strong breakout move…
2. Patterns containing smaller inside bar patterns allow tighter stop losses and great risk reward, these are the ideal candidates.
3. Be wary of patterns with both very large mother bars and large inside bars, these can often be difficult to trade due to lots of false signals and they make it more difficult to manage risk.
4. My favorite 2 patterns are – Fakey signals and – Inside bar pin bar combos.
5. We must learn to filter inside bars because the one bad thing about them is that a lot of them form across all time frames. However, with proper training and experience on the charts, you will learn to differentiate.
CONCLUSION
This was a basic introduction to the inside bar signal and how I trade it, I cover this pattern and much more in my advanced price action trading courses. Upon joining, some of what you will learn is:
1. More inside bar variations and how to trade them.
2. More example charts.
3. Members trading discussion forum, including inside bar discussion
4. Daily members on-going daily and weekly market commentary where we discuss potential inside bar trade setups as they form.
5. Members trading videos and articles library that includes more in-depth inside bar trading training.
6. Email coaching & Support line.
7. On-going updates for free
I hope you found today’s lesson helpful and inspiring. Inside bars are truly one of the most interesting and powerful price action signals so I hope you enjoyed learning about them and that you’ll continue to do so.
Please Leave A Comment Below With Your Thoughts On This Lesson…
If You Have Any Questions, You can drop your question as comment or message me privately.

How to place stop loss like a Pro TraderStop loss placement is perhaps not the most glamorous of trading topics to discuss, but it is a critically important one. If you do not know how to properly place your stop loss, you will be in for a very, very rough ride as you trade the markets. Essentially, for a trader, everything hinges on proper stop loss placement and risk management. If you understand these two aspects of trading and how to approach them properly, making consistent money in the market will become much, much easier for you.
Note : This lesson is based on higher time frame charts and the concepts are not applicable to very low time frames which is a different world of trading and not something I do or recommend so I can’t comment on it.
The theory behind placing stop losses like a pro trader
The first thing to understand and drill into your head about stop loss placement is that you should NEVER place a stop loss based on some random amount of pips. I know a lot of traders do this because I get emails from traders telling me they use “20 pip stops” or “50 pip stops”, etc. etc. This is NOT proper stop loss placement and it is definitely NOT how professional traders place their stop losses…
A stop loss should typically be based on a level in the market. Price should have to breach a level to ‘prove’ your trade wrong. You want to see price invalidate your view by giving you fact-based evidence you are wrong, that evidence comes in the form of the most logical nearby level of support or resistance being breached.
You need to take into account the context of the market you are trading and determine what level price would have to break through before your original view doesn’t make technical sense anymore. Let’s take a look at two examples to make this clearer…
The first example below shows a random pip amount stop loss placement, the second example shows a stop loss placed within the context of the market and nearby levels. Make note of the end results of both trades…
Notice in the chart below the trader placed his stop loss at an arbitrary 50 pip distance from entry. Traders typically do this because they don’t understand how to place stops properly and also because they want to trade a bigger position size. This is wrong. You need a logic / chart-based reason to place a stop loss, not just a random pip distance or a pip distance that will allow you to trade the size you want. Notice this trader would have been stopped out for a loss just before the market shot higher, without them on board…
In the next chart, we can see how this trade worked out for the trader who knew how to place stops properly / like a pro and who wasn’t placing his stop arbitrarily or based on greed (to trade a bigger size). Notice the stop loss was placed beyond the key support level and beyond the pin bar low, giving the trade good space to work out but also being placed at a point that would logically invalidate the trade if price moved beyond it….
Let’s briefly go over typical stop loss placement on two price action setups I teach; the pin bar signal and the inside bar signal . You will notice, I used a risk reward ratio of 2 to 1 on each trade, this is my ‘default’ risk reward. In other words, I always start any trade by seeing if a 2 to 1 (or more) risk reward is realistically possible given the market structure and context the pattern formed within. For expanded examples, you can reach out to me for my lesson on how to place stops and targets like a pro .
Note: Be aware of the average volatility over the last 7 to 10 days of the market you’re trading. You want your stop at least half of ATR (average true range) if not more or you will get stopped out due to noise.
The Average True Range is a tool we can use to see average market volatility over XYZ days. It is a good tool to utilize for stop loss placement when no nearby key levels are present. To learn how to apply and use the ATR tool more in-depth, you can reach out to me for my article on the average true range.
The example below shows how to use the ATR for stop loss placement and how it can keep you in a trade despite initial choppy conditions after the pattern…
IMPORTANT STOP LOSS PLACEMENT TIPS
It’s important to consider reward or target potential before taking any trade. You base the potential target of a trade on the stop loss distance. If the stop has to be too wide in order for the trade to have enough space to potentially work out, and the risk reward potential doesn’t stack up, then it’s usually not the best idea to take the trade.
Risk reward and position sizing are intimately related to stop loss placement obviously, and crucial topics in their own right. But, we are focusing here in this lesson just on stops, be aware that stops are paramount and take precedence over targets, in a way, stops are a qualifier for the target and overall risk reward and will effectively help you filter trades you should take and should not.
It is important to note that stops should always remain constant and can’t be widened, however targets can be widened, stops should only ever be tightened and moved into break even and trailed, make sure that’s concrete in your trading plan.
Stops are crucial to managing risk because once we find the stop loss placement we can then determine our position size on the trade and then we know ahead of time the cost and risks of the trade. As part of our trading business plan, stops are a cost of doing business as a trader, they are also there to force us to get out if we are wrong on a trade, despite our emotional bias towards staying in a trade, which in the end can cost us dearly if we were to hang onto a loser until we blew out our account balance.
CONCLUSION
A properly placed stop loss is truly the starting point of a successful trade. It allows us to proceed with calculating reward targets on trades and position size, effectively allowing us to execute our predetermined trading edge with a clear mental state and discipline. Traders who do not focus on stop loss placement first or put a lot of importance on doing it right, are doomed to fail and blow out their accounts.
I hope today’s lesson has given you a little ‘snapshot’ into how I approach stop loss placement. My trading course and members’ area will further educate you on how I place stop losses and how I incorporate stop loss placement into my overall trading strategy. To learn more, you can reach out to me privately.

HDFC 30MIN SWING NSE:HDFC
HDFC is ready for BreakOut at the 2760 BUY at This Level and hod until 2810
if broken 2710 Then SELL at te 2710 final support is 2660

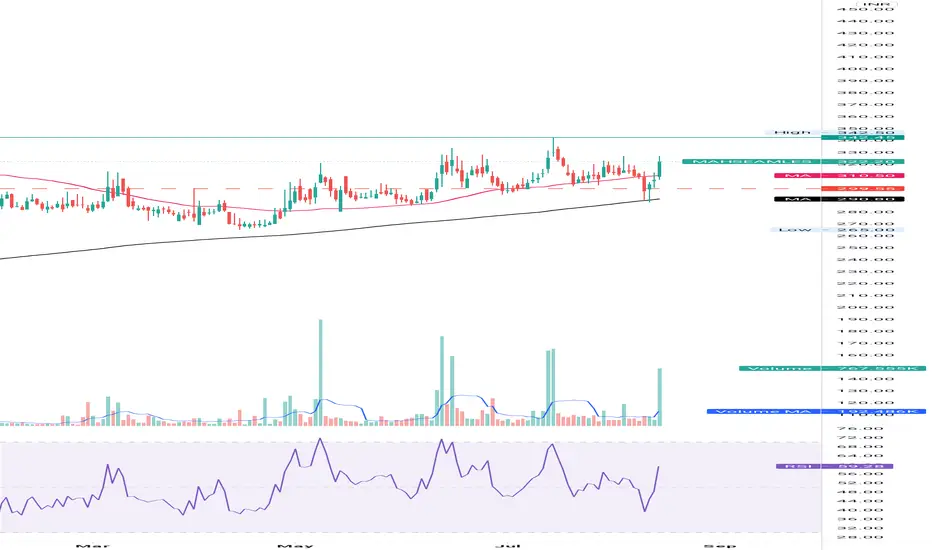
Long Maharashtra SeamlThis is looking very good on chart for swing.
This is my personal view and not reco.
NSE:MAHSEAMLES
Education purpose only.

BTC/USDT - LongBINANCE:BTCUSDT
I can see a real good movement on BTC, even though there might be some pullbacks along the movement...
(Using Fibonacci retracement) We can see a strong support (@ $29,700 - $30,000), since the very beginning of this year... and a near support/resistance (@ $40,500).... retracing the movement with fibonacci level, we can see the market projecting towards the 50% level ($44,120)... and with a big momentum move, it can make a way through the 50% level and project higher and then have a breathing space at the near support/resistance.. before completing its full movement
Also, for dynamic resistance and support, we can see both the EMA 12-period and 10-period acting as support now.. this proof the bullish direction of the market
Don't forget, there will be some pullbacks during the bullish movement
Trade carefully, and make sure you give the market enough time to play out any ways it want to
Like and share your thoughts as comment, if you agree with me or otherwise... lets trade and win together
Don't forget to follow me to have quick update of my further analysis, i will follow back as well.

Set and Forget TradingThe Psychological Advantages of Set and Forget Trading Regimes
Set and forget trading is a phrase that I coined in about a year back while taking classes with my students. It’s a trading approach that works if you follow it, to put it simply. For this reason, I write about it often, and my students no doubt understand the main benefits of the set and forget trading approach.
However, in today’s lesson, I want to focus on the psychological aspects and benefits of the set and forget approach and why it will help your trading performance, based on my personal experiences.
I get many of my students who email me regularly with success stories after they have adopted the set and forget approach. Hopefully, more of you will start trialing this concept because there is nothing that makes me happier than hearing my students’ success stories.
Set and forget trading works partially because of the way it helps you to systemize the entry, stop and target of your trades. By allowing the edge to play out uninterrupted, without you fiddling with it for arbitrary reasons, your long-term trading performance will improve simply as a ‘side-effect’.
However, there are also some very important mental benefits of set and forget trading which I don’t often discuss.
In this lesson, I want to focus on the psychological benefits of set and forget trading to help more of you make the mental transition to this style of trading. By committing to the trade completely before you even place it, it means you’re identifying the trade, placing the orders and walking away with very little monitoring. It also means being at peace and avoiding the emotional ups and downs that come with watching your trades as they are live. It means walking away and letting the market ‘do the work’ whilst you go do something more productive or fun. It means removing yourself from the temptations of chart-watching and getting influenced by chart whipsaws from news releases, short-term volatility and so on. In short, it means setting and forgetting!
Mental advantages…
By understanding the mental advantages of set and forget trading, perhaps you will gain a deeper understanding of its power and begin trading this way sooner.
Significantly Reduce Stress & Emotional Ups & Downs
Trading can be as stressful or as stress-free as you want it to be, it all depends on what you do. If you sit there staring at the charts all night when you should be asleep, you are doing to drive-up your body’s stress response and your cortisol (stress hormone) levels will sky-rocket both from the lack of sleep and from over-thinking about your trades .
Now, as if the stress wasn’t bad enough, it’s going to get worse. You’re also going to hurt your trading performance by doing what I described above, this will work to further increase your stress levels. Eventually, you will be tired, angry, frustrated, on the verge of tears and left with an empty trading account.
By employing my set and forget trading approach , you can eliminate all this stress, worry and losing! Show me a set and forget trader and I will show you a stress-free trader who is on the path to trading success. There have been studies done on investors / traders and their trading performance in relation to their trading frequency, and they always show that less-involved traders do better over the long-run. Similarly, even though trading is a male-dominated arena, when women do step into it they tend to do much better on average than men. Why? Simple; they do not over-trade as much and they do not risk too much like many men do. The reason has to do with men having higher testosterone levels (a hormone that makes men take more risks and feel over-confident, things that can hurt you in trading). I have an article in which I discuss this female vs. male trading phenomena more in-depth, you can write to me to send you the article if you would like to get it: What is The Weakest Link in Your Trading? Suffice it to say, us men are not always right, and we can and should learn from women sometimes and trading seems to be one area where we can benefit from their seemingly innate ability to set and forget their trades.
Help Cure Your Obsessive Chart-Watching
Have you ever heard of positive reinforcement? It’s when you get a reward from doing the right thing, this will then reinforce whatever the ‘right thing’ was that you did so that hopefully you keep doing it. It works on kids and it can work on adults too, especially in trading.
When you watch charts all the time, you are probably going to lose money, so the chart-watching is a negative behavior. The tricky part here is that the act of chart-watching can feel very good while you’re doing it (dopamine – the chemical in your brain that gives you the rush you get from the ‘hope’ of making money), so you are essentially getting a mental reward from committing a negative behavior and you are reinforcing a negative behavior by continuing to do this. Therefore, traders get stuck in an addictive cycle of watching charts, making the same mistakes over and over and losing money.
But, YOU CAN STOP THIS and YOU CAN REVERSE IT! By utilizing set and forget trading you can literally begin to reinforce positive behavior rather than negative. This will work like a positive feedback loop in which the improved performance you see from behaving properly in the markets works to make you want to continue that positive behavior. It’s no different than someone who sticks to a regime of exercise over a period of months; soon enough the endorphins and improved strength and energy-levels begin to reinforce the behavior of working out consistently. Yes, in the beginning it may seem like a ‘boring’ chore you don’t want to do and it may even hurt a little, but rest assured, that pain is good for you.
Setting and forgetting your trades is truly the key to eliminating almost every negative trading behavior that traders have. You need to implement this sooner than later.
A man smarter than me once said; “Suffer the pain of discipline or suffer the pain of regret”. That means, pay your dues, be disciplined now and it will pay off later, or you can continue to act lazy and undisciplined and you will suffer the pain of regret later.
Sleep at Night – Know What You Stand to Lose or Make
Sleep is critical to all physical and mental process in the human body. There are thousands of studies on this. I can tell you for a 100% iron-clad fact that IF you are losing sleep from watching charts and worrying about losing too much or not winning enough, you are hurting your trading performance and you are starting down the road to reinforcing negative trading habits as we discussed in point 2.
When you are using set and forget trading, your stop loss and profit targets are pre-defined, so you know what you stand to lose and what you stand to win on any given trade. I can tell you from experience, this makes it a lot easier to get and stay asleep at night so don’t under-estimate this benefit!
This brings up another point: When you know what you stand to lose or win on a trade it goes a long way towards eliminating greedy behavior. Greed is a huge reason traders fail. It causes them to hold trades too long whether the trade is moving in their favor or against them. How many times have you been in a big winning trade and you didn’t take the profit because you had no profit target or because you moved your profit target from its initial setting? This is greed. Being greedy inevitably causes traders to end up with no money.
Bulls make money, bears make money, Pigs? Pigs get slaughtered! That is one of the oldest Wall Street sayings and it rings louder than perhaps any other, still to this day.
When you set a profit target and stick to it, you aren’t being greedy, so over-time you should end up making money. When you set a stop loss and stick to it, you can pre-define your risk to a dollar amount you’re mentally OK with (potentially) losing. When you adjust your risk properly and you know what you can lose, you should have no problem setting your trade and walking away.
Disclaimer : There is never a 100% certain outcome for any trade and losses can sometimes exceed stop losses due to slippage.
Exercise the Mental Muscles of Routine & Discipline
When you make the commitment to start set and forget trading, you are kicking off a process that is self-reinforcing and will continue to strengthen the longer you use it. The power of routine and discipline, of repeating an effective system or process and staying accountable to THAT, will help you accelerate your development of the proper trading habits .
Once you have the proper trading habits in place you will see improved trading performance which gives rise to a huge surge of trading confidence in both yourself and what you’re doing. This reinforces the routine you started with and it all stems from committing to the set and forget trading approach.
Here is what this looks like in the diagram below. Notice that set and forget is in the center, because it really all starts with that idea – once you commit you will quickly figure out the proper trading routine from the help of my articles and trading courses , then it really starts to almost ‘take care of itself’ as long as you stay disciplined and stick to the set and forget plan.
The set and forget ‘wheel’ of trading success:
Confidence Through Achieving Better Trading Results
Confidence in business, trading or even in your personal life is something that truly is so important that it has no dollar value; it is invaluable. Confidence breeds more confidence and it works to reinforce those positive trading habits we discussed earlier. By trading properly not only are you reinforcing positive trading habits but you’re breeding confidence in yourself and your ability to stick to a plan, this confidence helps you stick to what was working. It’s all a positive feedback loop as I said before.
Confidence is spawned by the momentum of winning trades or at the very least, having better trading experiences and having more control over the capital in your account; the strategic planning that set and forget allows, that results in improved results. It’s not going to happen all at once, but over time, when you master this style of trading , you will start to feel more in control because you’re controlling the things you can and not trying to control the things you can’t (the market’s movement is uncontrollable).
Being more confident will spawn more motivation to continue mastering the act of finding the trade and placing the trade. It’s just like the earlier example I gave of exercise; when you get over the initial ‘pain’ of it or the initial ‘I don’t want to do this feeling’ and you start seeing positive results, it’s going to inject you with a whole boat-load of motivation and confidence that will work to fuel your on-going progress and quest for being the best. This will give you the willpower and discipline you need to make it as a trader.
Conclusion
I focus on the set and forget approach and 95% of the time I will resign to the fact I’m about to lose XYZ or make XYZ on a trade; this works to eliminate the potential of making emotional mistakes. The expectancy of my trading method combined with the set and forget money management approach has helped me, as well as many of my students improve their trading. It’s not an exact science, and of course there will be times trades are adjusted and there are times that no amount of mechanical money management can override the natural human emotion of trading, but we are not after perfection, we are after training and exercising the mind to be able to let go of the need to control the outcomes and control the market, after all the market is going to do what it’s going to do with or without us watching it or trading it. All we can do is control ourselves and our own behaviors in the market and that is what set and forget trading is all about.
Happy trading, CryptoKings!
Do well to follow for more lessons and trading analysis....

Why the Quality of your trades matters more than the QuantityMost traders simply want to trade. They fear missing out on the next big move and they forget that the market is still going to be there tomorrow and the next day and 10, 20, 50 years into the future. Everything in the market repeats and that means there will be another opportunity right around the corner, so stop worrying.
Today is not the last day you will have to trade and yet many people trade and think like it is! Over-trading is the number one reason that most traders don’t succeed; it’s a ‘cancer’ to your trading account and to your dreams.
What would be considering "over-trading?"
If you find you are almost always in a trade, you’re over-trading. If you find that you are preoccupied with the markets and your trades, you’re over-trading or you’re about to over-trade. If you are in more than one trade at a time you’re probably over-trading unless you have carefully divided up your overall 1R risk amongst all the trades.
There are many other examples of over-trading, but the basic fact of the matter is that you know if you’re trading too much because you won’t be able to sleep at night and you will be hemorrhaging money.
I personally only trade 1 to 6 times per month approximately, which all my students clearly know about that, and I very carefully select my trades and filter out the signals I don’t like.
A. Here’s what over-trading does to your trading results and account…
1. Too many trades dilute your edges
The more trades you take, the more diluted your trading edge becomes. A trading edge increases your chances of success, but the simple fact is, there are only going to be so many high-probability trade signals each week, month, year etc. no matter what your edge is.
So, once you start breaking away from your trading edge and start taking lower-quality trades that don’t meet your criteria, you start lowering your chances of success. You are basically diluting your trading edge down to where eventually it will be no better than random or worse.
basically diluting your trading edge down to where eventually it will be no better than
random or worse.
Market Noise vs Quality Trades – There is market noise, and then there are actual high-probability price events, you must know the difference. I wrote an article that touches on this titled how to trade sideways markets and I suggest you check it out to learn more and see some chart examples. The point here is that when you don’t know the difference between market noise and actual price action signals worth risking money on, you will naturally end up taking trades that are just noise and not actual signals, further diluting any edge you may have. The verdict is clear: Before you start risking your hard-earned money in the markets, make damn sure you know EXACTLY what your trading edge looks like and how to trade it so that you don’t ACCIDENTALLY end up over trading.
2. The spread and commission eats your profit
How do you think casinos make sooooo much money? Frequency. The high-frequency of games played means that their edge is going to play out to their advantage over and over again. The house always wins. In trading, the broker is the house, and they always win because not only are there a lot of people trading but probably 90% of them are trading WAY TOO MUCH. Hence, your only REAL “edge” as a retail trader or investor is to simply TRADE LESS!
Consider this : Every 100 trades you give back at least 100 to 150 pips equivalent in spread or commissions, so the more you trade the more you cost yourself simply due to the “churn” of your account.You want to avoid trading like you’re the casino player and premeditate, filter, and carefully select your trades. In a nutshell, to maintain your edge you want to avoid giving the market or broker the spread constantly.
Doing too much of anything is a bad idea
If you take a look at most endeavors, trading included, often times doing them too much or thinking too much / worrying too much about XYZ endeavor has a direct and negative relationship to how well you do at that thing.
For example : Drinking too much coke, eating too much Mcdonald’s, even working out too much or drinking too much water – all of these things can be bad for you. Being too worried about your significant other will end up pushing them away as it becomes unattractive and “needy”. One thing is true – too much of anything can hurt or even kill you and too many trades WILL kill your trading account for sure!
Your brain is wired to get addicted…
Drugs, sugar, video games, gambling, blue light from your smartphone, trading, what do all of these things have in common? They can all become insanely, dangerously addictive.
Our brains are wired and designed to become addicted to things, this is an evolutionary trait that served us well thousands of years ago as hunter-gatherers, but in modern-day society with all of its unhealthy vices and temptations, it tends to work against us and in certain cases, even kills us.
Our brains work on a reward system; when something feels good we get a little “shot” of “feel-good chemicals” such as dopamine and others. Hence, we become addicted to whatever gave us that dopamine rush, whether it was bad or good for us. For example, drugs are obviously bad for you but they can make you feel really good and we can become addicted to that good feeling even though we know the dire consequences it brings. Certain drugs like heroin are extremely addictive and can kill you very quickly, so they are especially dangerous. On the contrary, exercise also releases “feel-good” chemicals and you can become addicted to that feeling and you will be more likely to continue working out, obviously that is not a bad thing.
Knowing this basic information about how your brain works, it should be obvious that you need to be very careful and train yourself to get addicted to positive thoughts and processes so that you don’t become addicted to the negative ones.
When it comes to trading, we have a laptop in front of us with flashing colors and prices moving up or down that we can use to enter trades at the push of a button. Once we do that and hit a few winners, the brain says “hey that feels pretty damn good, do it again”, and so the trading addiction begins, if we aren’t careful.
If you do not create a trading plan where you plan out your trading edge and how you will behave in the market, you will naturally end up over-trading as you will get addicted to the feeling of “chasing” that winner. If you do not objectively plan our your trades in the beginning of your career, you will end up losing a lot of money due to trading addiction before you finally learn the lesson enough times that you either quit or have no money or desire left to trade with.
B . A CURE FOR OVER-TRADING
I’ve been trading the markets for about 2 years, teaching traders for over half that time, and without a doubt I have learned every lesson there is to learn in the markets many times over. So, the plan I am going to lay out for you below is born out of my experience and it is my opinion that if you follow it, you will be “cured” of the over-trading “cancer” that is probably destroying your trading account right now.
1. Set a max 10 to 12 trades a month, ideally less.
You must have some rigid rules built into your trading plan. Think of it like this: some of your trading strategy is rigid and then within that rigid structure there is some flexibility such as how much you risk, how you enter, where you place your stop loss, etc. But, when it comes to trade frequency, it really is necessary to say, “I am not going to take more than 10 trades a month” or 5 trades or whatever. Ideally, I would not trade more than 5 – 7 times a month. If you’re trading more than 10 times a month you’re probably over-trading.
2. Wait for setups matching your plan and apply a filter
When we talk about “applying a filter”, I am talking about a set of criteria that you use to check if a trade is worth taking or not. I like to use a T.L.S. filter wherein I am checking for a trade that has multiple pieces of confluence in its favor, at least 2 of 3: Trend, Level, Signal, etc.
Your goal is to trade like a sniper and wait patiently like a crocodile hunting its prey. You are not going to go after “every” target or the prey that looks strong and difficult to “kill”. Instead, you want to improve your odds of success by saving your “ammo” (trading capital) for the weaker / easier to get prey / trades. You only have so much money to risk just like a sniper only has so many bullets and a crocodile only has so much energy. Use it wisely or you’ll run out / blow out your account.
3. Set and forget approach
One of the big reasons traders trade too much is because they don’t give their trades enough time to play out and then they jump into another trade right away. Remember, good trades take time to play out and if you want to catch big market moves you have to be patient, this means you also have to not trade a lot. This is one reason why you need to set and forget your trades. Doing so not only improves your chances of making big gains but prevents you from trading too much and “chasing” trades.
4. Limit yourself to markets clearly moving in one direction with technical evidence
Traders often make the mistake of trading in choppy market conditions, this causes them to get in a trade and it immediately starts going against them, then they want to enter another one. The dopamine chase is underway at that point. Jumping from trade to trade is very dangerous. If you stick to markets that are clearly trending and moving in one direction aggressively, you are much less likely to over-trade.
CONCLUSION
One of the hard truths of trading is that there simply are not a large amount of highprobability price events in the market each week, month or year. So, it goes to reason that the more you trade the less impactful your trading edge becomes. Despite these facts, most traders continuously trade far too frequently each week, and they end up losing money.
My strategy is built on a low frequency trading approach so that I am basically trading as infrequently as possible whilst not passing up the most obvious trade setups. Obviously, there is some learning and skill required to know what constitutes the “best” and “obvious trade setups”, you aren’t going to just wake up one morning and magically know what to look for. With the help of my professional trading classes and the set and forget approach that I teach, you will begin to learn what a “high-quality” price action event looks like and you’ll learn to filter out the lower-quality ones from them. My end of day trading approach is inherently low-frequency FOR A REASON; it results in a selffulfilling type of function that works to systematically prevent over-trading which naturally increases your chances of long-term trading success. Which is what we all want, right?
Happy trading, CryptoKings!
Do well to follow for more lessons and trading analysis.... Love you all.

What Is Swing Trading and what are its advantages ?📊 What Is Swing Trading? 📊
━━━━━━━━━━━━━
Swing trading is a style of trading that attempts to capture short- to medium-term gains in a stock (or any financial instrument) over a period of a few days to several weeks. Swing traders primarily use technical analysis to look for trading opportunities. These traders may utilize fundamental analysis in addition to analyzing price trends and patterns.
━━━━━━━━━━━━━
📊 Advantages of Swing Trading 📊
━━━━━━━━━━━━━
🔴 It allows you to take advantage of the natural ebb and flow of markets. Financial markets never go in one direction forever, and by being able to take advantage of that, you can increase your returns as you in theory are going to be making money when the market rises over the next few days, and then make some when the market pulls back, as it will certainly do sooner or later.
🔴 By being in and out of the markets, you can identify more opportunities. If you look at any financial chart, you can see that there is almost always a definite long-term trend, but the market might not always be at a support or resistance area. By being in and out of the market in a matter of a few days, (typically) you can collect profits, and identify other markets that are setting up for other trades. This allows you to spread the risk around, and ties up a lot less capital instead of constantly having to come up with margin for new positions as you find new trades. By closing your first position, you will not have to deposit more money in your account to cover the second one.
🔴 Stop losses are typically smaller than longer term trades. The stop losses on a swing trade might be 100 pips based upon a 4 hour chart, while a stop loss on a weekly chart that is based upon the overall trend might have to be 400 pips. This allows for you to place larger sized positions instead of extremely low leveraged ones via the longer-term trends.


GOLD SPOT (daily time frame) - ShortFOREXCOM:XAUUSD
There has been a strong support level since April 17, after the breakout that occurred on April 13.
Also in the meantime, we can see a near resistance/ support level
I confirmed these strong and near level by circling each testing that occurred on the level
Also EMA 10 & 20 period tends to become the dynamic resistance
Also have same view on 4hr timeframe, check it below
After the turn around on the near support, the market went bullish till the near resistance. And from there, we can see a fake bullish breakout there which i alighted with rectangle , and afterward, the market movement turn downward, towards the near support level ... c
Conclusively, I am having a sell signal on XAUUSD
Trade Setup
Call Type: Short (Sell)
Entry: 1810.00
T.p: 1750.00 (on the near-support)
S.l: 1825.00 (just above the near-resistance)
profit in pips: 60 pips
loss in pips: 15 pips
Risk-reward-ratio: 1:4
Like and drop your thoughts as comment if you agree with me, or otherwise.. lets trade and win together
Please, follow me..i will follow back as well

GBPUSD Swing*Disclaimer*
This is not financial advice. Forex Trading is risky. Trade at your own risk.
#Trade_Like_A_Magnate

Visa Earnings Trade!!Sitting above the 200 Ma w a MACD cross and a parabolic Sar. I could see this continue to the upside. This week and last week companies have been getting massively rewarded for good earnings. American Express ran $10!! Visa is gonna smoke American Express too so I can only imagine. Risky trade but if my thesis is correct tomorrow after hours this thing should pump and we should have plenty the following day to close our contracts in a nice profit.
$522.50 call for august 6th. Grab em up early during market open 7-27 we’re gonna ride this one thru earnings and sell off 7-28

HUGE opportunity on MATIC/USDTI understand that we are in a moment of uncertainty, so I'm gonna introduce two points of view, for the ones that are Bullish or Bearish on MATIC and I will explain why I am "long" on this trade no matter the trend (bullish or bearish).
For my Bullish friends:
- I traced Fibonacci from the lowest point in April at $0.25 right before the bullish momentum that took MATIC to $2.70.
- I took the EMA 200 in consideration to determine the trend (slightly up).
- The 0.786 Fibonacci Retracement ($0.25 to $2.70) is at $0.78.
- Using previous Supports & Resistances I determined my buying zone between $0.68 to $0.78
- The RSI indicator is at one of the lowest areas in months.
- The last reason is that MATIC is an amazing project and still has a lot to bring to the "crypto world"!!
For my Bearish friends:
- I used the EMA 200 and a previous area of Support ($0.74 and $0.68) as a prediction of where the price will fall.
- Based on that I traced our Fibonacci from $1.71 to $0.74, if we were to keep a down trend the Retracement would probably take us to something between $1.10 to $1.33
___________
Conclusion:
If the market shows itself on a Bearish trend and we have a "common" retracement to the Fibo 0.382 zone (around $1.10) we will be looking in a 50% increase on the price from $0.74 to $1.10 and if it the market tried the 0.618 we would be looking on a 80% increase on the price.
If the market shows itself on a Bullish trend we could easily be looking to more than 100% increase in the price of MATIC.
This will be a long trade doesn't matter if it will be Bullish or Bearish, it can take several days or weeks, but I'm confident on massive gains on this one!
Personally I see this moment as a huge opportunity to buy MATIC, both as a trader and as a holder.
___________
Disclaimer:
This is not financial advice. The only purpose of this post is to share an idea and to talk about it.
Always remember do your own research!

BTC/USDT is testing the "2020 HIGH" as support.Bitcoin has tested the high of 2020 as support for the third time in the past 3 months.
I know that many of you guys already know it but for the ones that don't, Bitcoin have never tested the high of 2017 ($19K - $20K) as support, the price just went straight "to the moon", and that's why you always hear people on the internet saying that Bitcoin is going to 20K.
That's one of the reasons why I believe that Bitcoin will test the $19K - $20K zone and another reason is that Bitcoin doesn't seems to like the $29K area, the 200 EMA is still pointing down, and at this moment we have a lot more sellers than buyers.
Buy and Hold:
If you are a true believer of Bitcoin and wants to buy and hold some of it I believe that the zone between $19K - $24K is a good area to buy and hold.
Trade (Short):
On a trader perspective I would wait Bitcoin to break the "2020 support" and wait for a confirmation then I would wait for a pullback and then I would Short it (if the EMAs are still pointing down as well), but that could be a really risky trade because we have a lot of buying orders for Bitcoin on the $28K area, so do your own research and trade at your own risk.
________________________
Disclaimer:
None of what was shared here or in my profile in general constitute as financial advice, the purpose of this post is only to discuss ideas.
REMEMBER TO ALWAYS DO YOUR OWN RESEARCH.

GBPCHF: Bearish Accumulation & Breakout 🇬🇧🇨🇭
From the end of July, we saw a very nice bearish accumulation on GBPCHF.
The price was setting lower highs respecting the same low.
Yesterday, the price managed to break the previous low, setting a new lower low lower close on a daily.
Now the broken contracting area serves as a sell zone.
From that, I will expect a bearish swing.
Next goal - 1.24
❤️Please, support this idea with a like and comment!❤️

GOLD - Our Calculation Shows Next Target 1880Gold has broken through the resistance 1815. Our mathematical model shows a calculation of the next target at 1880.
Considers going longs when gold retests the sideways channel.
Stay tuned for more updates !

USDJPY Bear Market?USDJPY (Daily) - Last week the Yen finally broke out of the 12 week consolidation zone with a strong impulsive move that came on Thursday. We saw the move violate both the 110.500 and 110.000 levels which are important numbers followed by a retracement move which came on Friday to retest the zone. As long as price remains outside the channel, we can expect more weakness to follow as the market sentiment has now shifted from bullish to bearish at least for the forseable future. As the market opens, we can expect price to test this zone further into Monday and early this week before a potential continuation to the downside. 108.000 looks like an attractive liquidity zone for targets and take profit.

AUD-JPY - Bear MarketAUDJPY (H4) - Earier in the week we saw price impuse to the downside before it hit support and pulled back. It now looks like the correction move may be coming to an end and we may see another impuse which could potentiay break support and sink the pair lower.
