CADJPY short; if price reaches 82.465Stop loss 82.985
Take profit: 80.705
The pair is very squeezed on the intraday timeframes & the weekly is showing exhaustion backing up the confluence for the short.
Swingtrader

USDJPYShort entry If prices manages to break 109.550 could bring the market back down to 108.375 taking out the higher low which was made at the end of January at 108.494,
Scaling down to the 4hour timeframe can see the HL which bulls would of kicked in to push the usdjpy back up in price which was correlating with the usdoller(dxy) and many other usdoller pairs this week. we are now looking to take this pair back down potentially to 107.770.

Trade Setup .... EURGBPCurrency Pair: EURGBP
Time Frame: 30min
Trend: Bullish
Momentum: Sideway
Structure Waves: The market is located in a correction Waves.
Strategy: Swing strategy . Long
R/R:~ 3
Entry & Exit points on the chart

EURCHF - 2a - 190207 - LONG - OANDA - AT - 4H - (RRR 3.66)EURCHF - 2a - 190207 - LONG - OANDA - AT - 4H - (RRR 3.66)

EURNZD - 3a - 190204 - SHORT - OANDA - ATx3 - 4H - (RRR 6.58)EURNZD - 3a - 190204 - SHORT - OANDA - ATx3 - 4H - (RRR 6.58)

The trend is strong on OSTKOSTK in a strong bullish trend and looks to continue upwards toward the $88 per share area.
I will be looking for a retest (pullback) in either of these green boxes to enter with some shares and/or options. Trade the trend until the trend reverses ;).
Cheers!


Long Entry, H4 AUDUSDDaily engulfing candlestick pattern, possible price swing higher. H4 Swing point break, wait for pullback for better risk to reward ratio.

Looking for a retest on CGC to go longDue to the upgrade on CGC from $40 to $60 PT here: www.marketwatch.com , the stock gapped above the November 7, 2018 candle. Might not get filled on this one and that's okay, but looking for a retest of that area with a wide $7 stop to buy some shares.
If this doesn't fill, I will see how the price action behaves and potentially enter on a retest of $48.19 once the share price goes a bit higher.
Let's see what happens :).

CLDR looks good to hit $15 per share after receiving an upgradeLooking to get into Feb $12.5 calls at $1.00 so that the trade is absolute zero trade meaning, no stop is needed. Just let the trade play out. CLDR was moving a bit after hours on Friday so might gap up tomorrow. Let's see if she fills our order. IF not, we find the next trade.
Target is ~$15 first.

An aggressive swing on NVDAFriday's candle is very bullish and with decent volume retesting the 50 day sma. 158 should be solid support and that's the retest I plan on entering with $170 March calls for $6.50 to give it time. Will give it a $4.25 stop, which should align with below that wick of Friday's bullish candle.
My target on NVDA is $170, or extreme $176 to close out the swing.
Let's see what she does next week :).
Cheers.


Late to the party to post, but SQ swing trade worked very wellEver since SQ broke its downtrend from the all-time high at the beginning of 2019, our team at PLT has been watching for great intra-day and swing trade setups. SQ is one of our favorite companies to always remain bullish on due to the products and services they offer in the Fin-tech industry.
This trade was planned on January 18, 2019 over the weekend to enter February $65 call options on the retest of the close of January 17, 2019. You can see SQ's price broke above the daily 200 day sma, which is typically very strong support. Our stop was placed below all the bullish candles and the 1/3 back fib just under $63.50.
Result was a nice 56.7% gain on the calls almost the next day after hitting target 1. Target 2 was also hit which was the 1.618% extension from the most recent move. The calls return went well above 100% at that point since they were deep in the money.
SQ most likely goes higher, but may reset and retest a bit before earnings.
Look out for more day and swing trade ideas in the very near future now that we are all settled in to our Trading View account :-).
Cheers!

Swing High, H4 AUDJPYH4 Swing point break and engulfing candlestick pattern, price possible to move higher.

Short Entry, H4 GoldDaily dominant candle break down, possible downtrend. H4 swing point break entry.


EUR/AUD Buy/Long Trade Here we can see EUR AUD has been in a strong downtrend making lower highs and lower lows at bottom resistance level we can see price cannot break below it any further and make any new lows. So now descending trendline has been broken and currently on the break and retest where it lines up with our favourable fib zone. Great R:R as well.

Double Bottom & Double Top In Daily BTC/USD Chart,What's Next?hello guys,
if you see in this daily btc/usd chart, the pattern was forming well in both double bottom & top in the last 2 month.
i guess, it will breakout soon to around $3800 - $4000 resistance area rather than breakdown depends on the Rsi indictors which steadily upward & the daily candles which defending the 0.618 fibonacci ratio.
but you must cautiously set the stop loss if the support breaking, if so,it will drown to the next support area around $3200.
educational purpose only, not financial advice.
like & share if this helpful :)

Short Entry, H4 AUDCADDaily dominant candle break down. H4 engulfing candlestick pattern, high risk/rewards ratio.

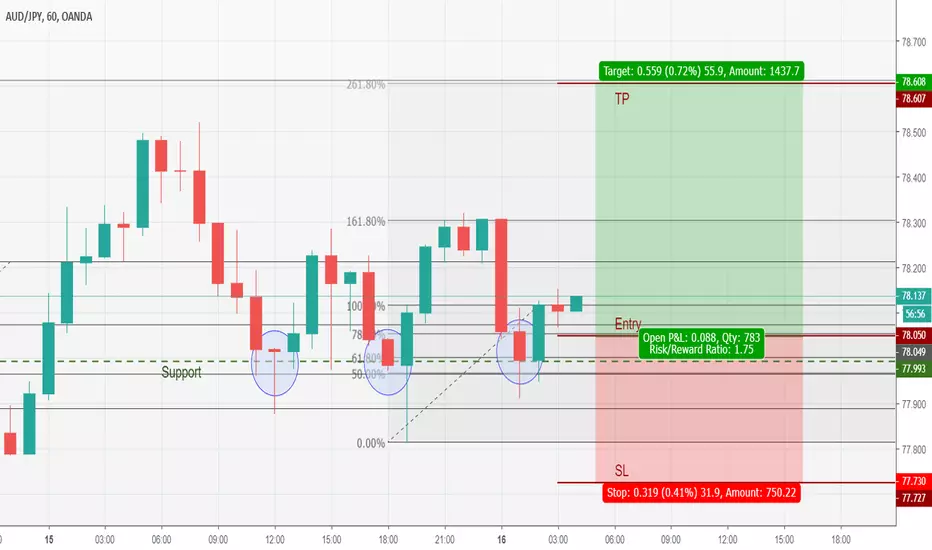
Buy Entry, H1 AUDJPYH4 Dominant candle break up. Multiple bullish candlestick patterns in H1 chart (blue circled).

Long Entry, Daily USDCHFDaily swing point 1 broken, engulfing candlestick pattern on daily support level.
Entry on daily or wait for buy setup on lower time-frame.

Long on calls off previous supportPYPL looks relatively strong compared to the rest of the market. I think a retest of the $89 area is a good entry for a possible U turn back up to new ATHs. Giving it a wide stop.
