Short Entry, H4 EURAUDDaily swing point 1 break, downtrend candlestick pattern (long tail pin bar).
H4 engulfing short entry.
Swingtrader

IQ long swing with some callsIQ finally breaking up out of its consolidation just below the previous IPO all-time low. A lot of volume coming in on Friday. Any retest I expect to be bought. IQ might gap up tomorrow with the after-hours activity.


NZDCAD - Swing Trading Set UpPrice is currently in a descending channel testing the channel support and resistance multiple times. However, price is now testing channel resistance as well as a resistance level (which was previously support but now is a key resistance in the market). Price action is stating three rejections and now has formed three 'Shooting Star' Japanese candlesticks which is a strong indicator of bearish pressure holding price below this resistance level. This set up is providing strong evidence of a reversal in the market to go short.

POSSIBLE LONG-TERM BULLISH TRAD IDEA ON USDNOKPrice broke out of the ABC correction counter trend line which is also the neckline of a double bottom pattern.
.
Price has the potential to move towards the resistance level after it broken out of the correction with an impulsive wave 1-5 and retested the broken structure with an ABC zigzag pattern.
.
Considering that the price has broken out if the ABC zigzag CTL, we will just have to let the market decide it's move.
.
Best of luck on the chart!

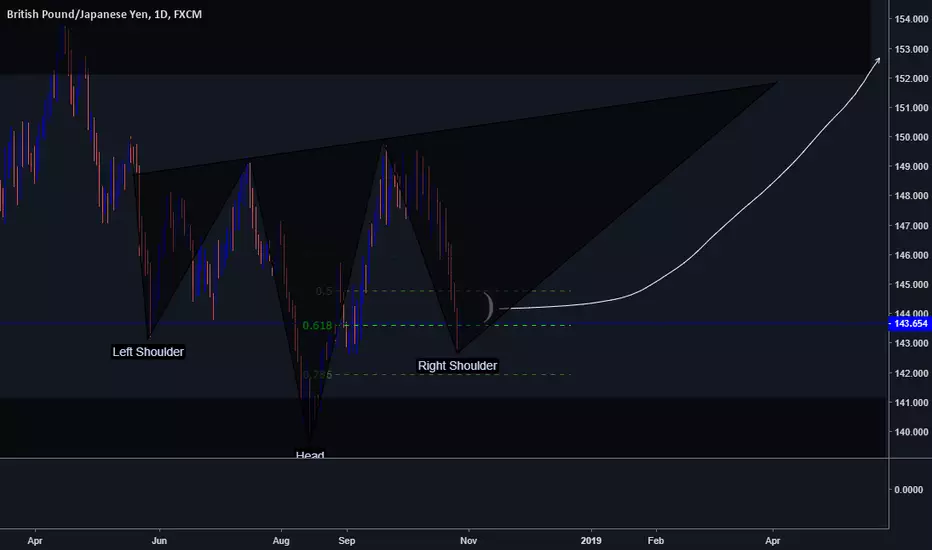
GBPJPY : LONG : DAILY #FREEMONEY #EVERYTIME #LETSRUNITBACKDaddy has been doing this for a while, you can trust me. I haven't completely left forex or anything, I just had to lose my entire life savings in cryptocurrency in order to realize there is no gateway to heaven for an extended amount of time. When crypto opens those legs again I will be there <3 In the meantime GJ is looking too good for me to miss out. If we break this area that we're currently testing we'll be heading to 140 zone, otherwise lets ride this to 150. (Beware of congestion) When you hit profit remember who put you on
AUDUSD - BULLISH CONTINUATION TRADE SETUP (SECOND ENTRY)I'm revisiting the AUDUSD bullish trend continuation trade setup. After the first setup I posted earlier shy few pips from our 1:4.1 TP zone, we had a slight pullback to the broken daily swing level. Since the price has made a decent retracement to our confluence level and gives us an excellent Counter Trend Line placement, we have the potential to see a further leg up after the proper break of our CTL.
Find the link to the previous analysis below.
Thanks for reading.

CHFJPY H4 - TREND REVERSAL TRADE SETUPIn the CHFJPY H4 chart above, the price made a strong down move followed by an inverted Head & Shoulder pattern.
Price reversed from the weekly support level as well as 78.6 Fib ratio to complete the right shoulder of the H&S pattern, and it broke out of Counter Trend Line (CTL).
Price made a double bottom on the support level before the breakout of CTL which indicate that the market has the potential to complete the head and shoulder reversal setup.
Since we have a confirmation entry on this, we just have to be patient and give it time to play out as planned.
Thanks for reading!

AUDUSD possible long 4HR
Awaiting a breakout of my box zone
on daily we got a nice bullish engulfing
MA's are slowly forming a crossover
dollar seems weak lets see how far we can go

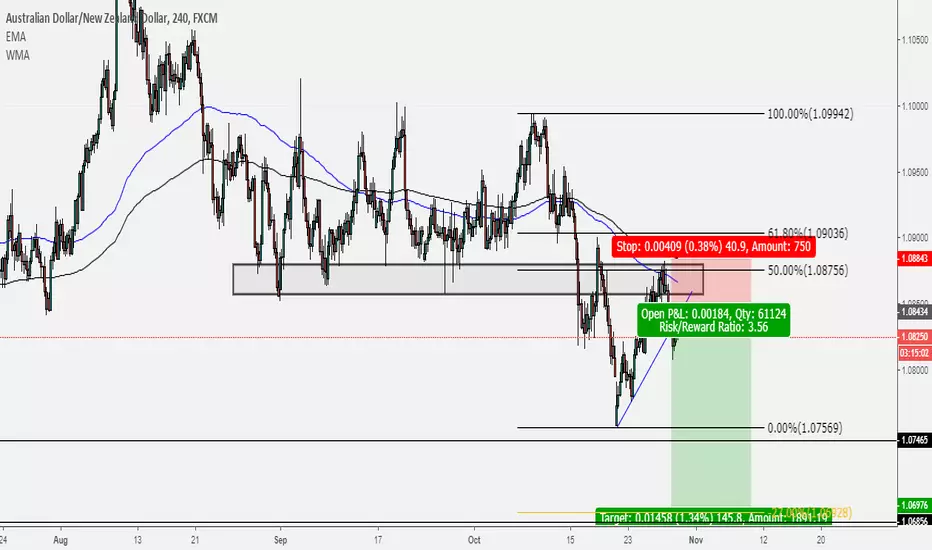
A CLEAR BREAK AND RETEST CONTINUATION TRADE ON AUDNZDAfter the break of range zone, price retraced back and retest the broken level which is also aligned with dynamic resistance (mean value), 50.0 Fib, and weekly resistance. Our goal is to look for continuation trade after the breakout of the counter trend line (CTL). Now we have the break and retest of the bearish CTL, we give a shot for short. Entry, Stop Loss and Target are clearly defined on chart.
Trading levels for 10/18/2018The market is struggling to make HH's in the 2H chart, regardless I would like to see a rally to the structure resistance around 7420 to start some shorts, my sweet spot would be R3, but we will have to see if the bulls have what it takes. In the other hand, i don't think i will be looking to start a long position, i think that a break of the short-term ascending trendline can change things rapidly.
Please keep in mind that these are not trading signals, use your own analysis before taking any trades.
PLAN YOUR TRADE AND TRADE YOUR PLAN
K.R.S.

Bullish on GERN, Possible Double Bottom?Possible Double Bottom at $5.10
Stock looks like its ready to run and run fast
If $5.10 can represent the low going forward, we break above multi-year resistance of $6.50 and hold;
might get a double here!
Time will tell.

Bullish on NKEDespite the political rhetoric, stock has a bullish setup
3-4 years of consolidation, followed by a break out
a few more months of consolidation, followed by another break out
currently in an uptrend
May experience some slight pullbacks but overall, bullish.

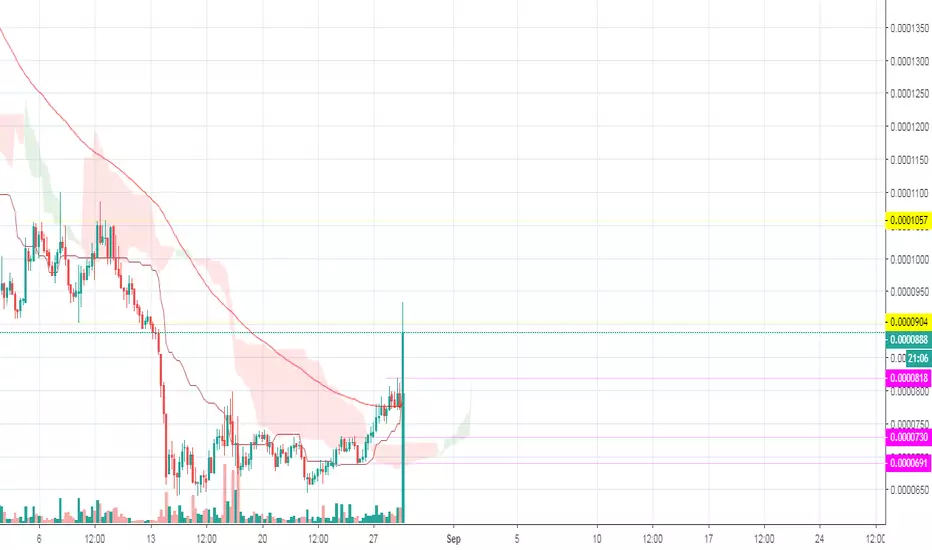
Salt has pumped and you better not chase it yet and waitSalt has pumped that is nice. People will take profit. You need to calm down before you can get in. Looking for entry around 850 sats below and looking to sell around 9xx sats - 1059 sats.
USD/CHF Major Structure + Harmonic + Fib ClusterUSD/CHF has been heavily bearish lately and this week the pair started to make a complex pullback, which I predict that the move could reverse at that zone of confluence.

Bullish on GLW (Corning)8 month rounding bottom completed
gapped up huge on earnings beat
currently consolidating
In my opinion, will retest 52 week highs
and finally another break out.

Long on QQQ The market has been very choppy lately with lots uncertainty. The qqq was unable to make new highs on the previous move up. although this may be true, we can still see a potential trade to the upside with a reasonable stop loss below. The qqq has pulled back to the 61.8 Fibonacci retracement level. also it has some support which was respected twice last week. For this trade, I will go long at the end of the day on a bullish close and strong volume for a risk reward ration of about 1 to 2.
The MACD is also showing signs that there may be a trend reversal in the near future. So I will take a small position in SQQQ to protect against any large moves to the downside.

Bullish on GERN9 year channel
another attempt at breaking resistance
If we can break resistance, price tgt: $10+

EURJPY- Are we going to see a Top? Part 2This is a good zone to get involved in a shorting opportunity as soon as the Daily does not close above 129.50
As I enter on the Violation of the 1H Trend I have a Entry Stop Order below the Higher Low of the last swing.
If the 1H makes a new Higher Swing then my entry will be placed under the next Higher Low.
My first Target will be a re-test of the previous Daily-Low @ 125.209
My Second Target will be an Extension around the 123 levels
Trend Analysis:
1D Trend: Bearish (Underlying Trend)
4H Trend: Bullish
1H Trend: Bullish
Don't follow my trade blindly, follow the rules of your trading plan, if you don't have one: DO NOT TRADE!

EURUSD Rangebound4HR
After EU broke the key level of 1.1640
we bounce again between the 1.1540-1.1640
i will wait for a touch of the support area before i enter a trade
however EU looking bearish

audnzd shortaudnzd is exhausted and we are looking to get a good trend going from the 1 hour chart. if you want to join our free group just head over to wallstreetknows.com and register as a social trader


Looking to short BTC at 200EMA! (Swing trade idea) BITSTAMP:BTCUSD
Bitcoin's price has finally broke through the 7.5k mark after consolidating around the 7.2-7.4 levels, after the initial $600 jump a week ago.
We now take a look at the daily timeframe of the chart to try to predict where BTC will go next.
As you can see from the chart, the bulls have taken back control after the week of consolidation and the price is now moving towards the 200EMA which sits at around 7.8-7.9k mark. The 200EMA has proven to be quite a strong resistance and therefore it is likely to see the price rejected at that level.
ACTION: Look to short at the resistance (200EMA to capture the swing back down)
As RSI creeps into the overbought region at the current price level, taking a long position now will be unwise even though there is quite a good buy volume coming in from the bulls. I for one, will sit this one out and look to short only when price touches the 200EMA to capture the correction swing back down.
Where to take profit? and where will be the stop loss?
We can aim to take profit at TP1: 7.3k and TP2: 7k (marked by the yellow horizontal lines) after entering the short trade at 7.8 or 7.9k. The 7k mark is where the 50EMA sits at, and thus it is likely to serve as quite a strong support for BTC price.
ATR current value sits at 297. Which means we can put our stoploss at 8.1-8.2k mark.
This gives us a Risk-reward ratio of roughly 2.5 is to 1, making this short a highly probable and profitable trade.
Let me know what you think:)
