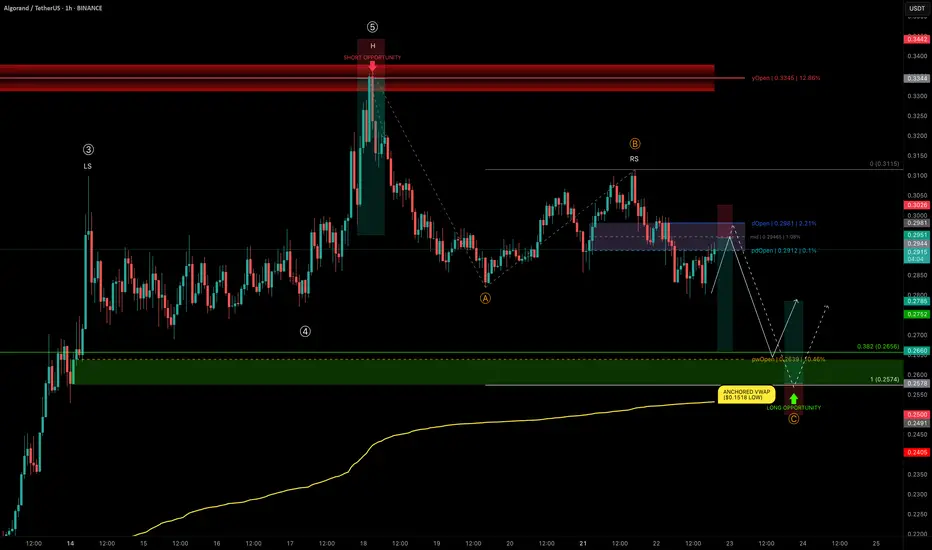
ALGO rejects at yOpen — Mapping High-Conviction Trade ZonesALGO has delivered an impressive +124% rally from $0.1518 to $0.336 in just 25 days, completing a 5-wave Elliott impulse right into the yearly open resistance.
We are now in a correction phase, and the current structure is showing a head and shoulders pattern, with the right shoulder currently forming.
Let’s break down the key levels and setups.
🧩 Technical Breakdown
➡️ ABC Corrective Structure:
Targeting wave C near the trend-based fib extension (TBFE) at $0.2574
➡️ Fib Retracement Confluence:
0.382 retracement of the entire 5-wave move → $0.2656
Previous weekly open (pwOpen) → $0.2639
Liquidity pocket likely to be swept
Anchored VWAP from the $0.1518 low (start of the bullish trend) → currently at $0.2532, acting as a major support layer
Conclusion: Long opportunity zone between $0.2656–$0.2574
Trade Setups
🔴 Short Setup:
Why? ALGO has lost dOpen and pdOpen — a bearish sign for downward continuation.
Entry Zone: Between dOpen and pdOpen
Stop-loss: Above dOpen
Target (TP): 0.382 fib retracement (~$0.2656)
R:R: ≈ 1:3.5
🟢 Long Setup:
Entry Zone: Laddered Entries between $0.2656–$0.2574
Stop-loss: Below anchored VWAP (~$0.2532)
Target (TP): ~$0.2785+
R:R: ≈ 1:2.65
🛠 Indicator Note
I’m using my own indicator called "DriftLine - Pivot Open Zones " for this analysis, which I recently published.
✅ Feel free to use it in your own analysis!
Just head over to my profile → “Scripts” tab → apply it directly to your charts.
💡 Educational Insight: Why Confluence Matters
High-probability trades aren’t based on just one tool or level — they come from confluence, where multiple signals align: fib levels, VWAP, liquidity pools, price structures , and key levels.
For example, in this ALGO setup, it’s not just the fib retracement or just the VWAP — it’s the stacking of all these elements together that creates a precise zone with a better statistical edge.
✍️ Lesson: Don’t chase trades off single signals; stack tools for confirmation.
Patience, confirmation, and confluence — as always, the keys to high-probability setups. 🚀
_________________________________
💬 If you found this helpful, drop a like and comment!
Want breakdowns of other charts? Leave your requests below.
Swingtrading
HBAR Game Plan: Short the Bounce, Long the Liquidity GrabHBAR has been moving strongly and is currently offering both short and long trade opportunities based on a clean potential ABC corrective pattern, key fib levels, volume profile, and anchored VWAP. Let’s break down the setup.
🧩 Technical Breakdown
Higher Timeframe Confluence:
0.618 fib retracement from the macro move
1.618 trend-based fib extension
1.272 VWAP band resistance
Point of Control (POC) from the visible range profile
This is marked as a major take profit/short opportunity zone.
For extra confluence, the negative fib extension golden pocket (-0.618 to -0.666) also aligns right at this resistance zone
Current Structure:
We’re potentially completing wave B of an ABC corrective move
Price has retraced into a high-probability short zone
🔴 Short Setup
Entry Zone:
Between the 0.702 and 0.786 fib retracement levels
Why Here?
0.702–0.786 fib retracement → short zone for reversals
Potential wave B top → setting up for a C leg down
Target (TP):
Around $0.25–$0.24, near the expected wave C completion
🟢 Long Setup
Entry Zone:
~$0.25–$0.24 area.
Why Here?
This zone is a strong confluence area:
➡️ 0.786 fib retracement
➡️ 1.0 trend-based fib extension of ABC
➡️ Anchored VWAP from the entire trend, offering dynamic support
➡️ Liquidity pool
➡️ Previous weekly Open
Plan:
Wait for price to complete wave C into this zone, then look for bullish reaction signs to enter long.
💡 Educational Insight
Why the 0.702–0.786 short zone?
These fib levels are often overlooked but are key “hidden” zones where wave B tops out before C waves.
Why anchored VWAP?
Anchored VWAP gives you dynamic institutional support/resistance, especially when aligned with fibs and liquidity.
Why wait for confirmation?
Blindly longing or shorting levels can trap you. Wait for SFPs, wick rejections, or lower timeframe structure flips to boost trade probability.
Final Thoughts
HBAR is in a highly interesting zone, offering both:
A short setup into the C wave,
And a long setup at the C wave completion, backed by multiple confluence factors.
Let the levels come to you and wait for confirmation!
_________________________________
💬 If you found this helpful, drop a like and comment!
Want breakdowns of other charts? Leave your requests below.

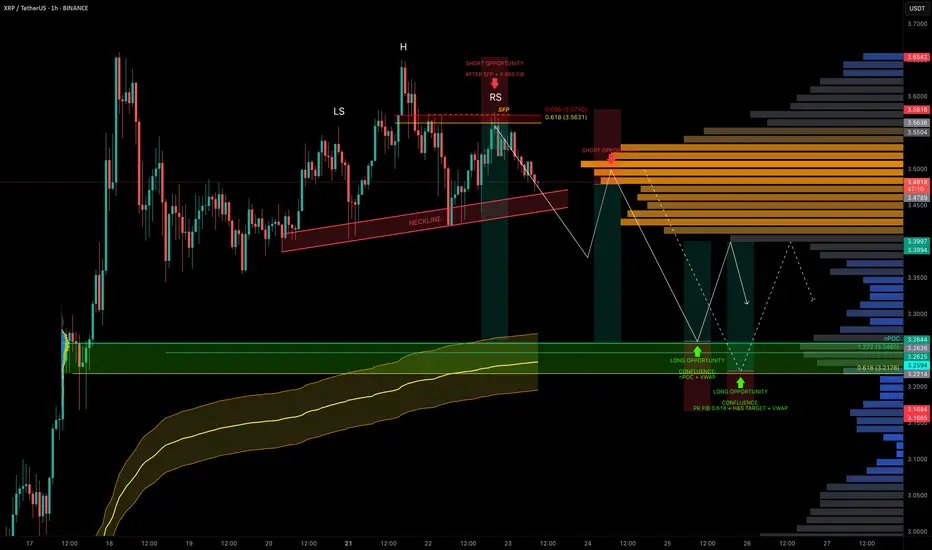
XRP Coiled in Range — Liquidity Below, Trade Setups AheadXRP has been stuck in a trading range around $3.50 for the past 5 days, offering multiple trade opportunities within the chop.
A notable short was triggered after a swing failure pattern (SFP) at the 0.666 fib retracement level near $3.563.
Now, with liquidity building to the downside, we’re watching closely for the next high-conviction setups.
🧩 Current Structure & Short Setup
🔴 Short Opportunity (Triggered):
SFP + 0.666 fib retracement at $3.563 led to rejection.
Market now shows a head & shoulders pattern forming.
Target: $3.2176 (0.618 fib retracement).
Trigger: Watch for a neckline break + retest for short confirmation.
Stop-loss: Above the right shoulder.
🟢 Long Setup:
Watching for a high-probability long around:
$3.26 → nPOC + 1.272 TBFE
$3.23 → anchored VWAP bands
This zone offers strong confluence and could act as the next launchpad.
Long Trade Plan:
Entry Zone: potential entries between $3.26–$3.22, price action needed for confirmation
Stop-loss: Below swing low at $3.1675
Target (TP): ~$3.40
✍️ Plan: Set alerts near the lows and react to price action at the zone — don’t front-run, let structure confirm.
💡 Pro Tip: Trade the Confluence, Not the Emotion
High-probability trades come from confluence, not guessing.
This setup combines nPOC, TBFE, VWAP, fib levels, and classical market structure (H&S) to map precise zones for both longs and shorts.
Let price come to you and wait for confirmation — especially in a rangebound environment where liquidity hunts are frequent.
Final Thoughts
We’re still rangebound, but liquidity is building below.
Keep an eye on the $3.26–$3.22 support zone for long entries and the H&S neckline for short breakdown confirmation.
_________________________________
💬 If you found this helpful, drop a like and comment!
Want breakdowns of other charts? Leave your requests below.
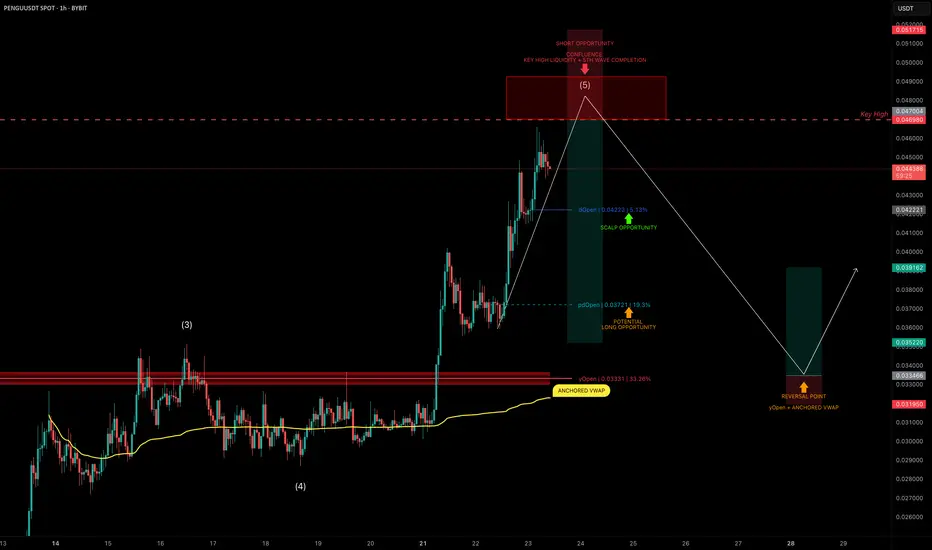
PENGU Topping Out? Targeting 30% Downside After Liquidity SweepPENGU has had an explosive run, but it now looks to be nearing completion of wave 5 of its current Elliott impulse.
We’re approaching a key high at $0.04698, a likely liquidity grab zone — and potentially a great area to position for a short trade.
🧩 Short Setup Overview
➡️ Wave 5 Completion Incoming:
Price is showing signs of exhaustion as it approaches $0.04698, where liquidity is likely stacked above the previous high.
➡️ SFP Trigger Zone:
Watch for a swing failure pattern (SFP) at $0.04698 — confirmation for a potential short entry.
➡️ Psychological Resistance:
The $0.05 level also sits just above — a classic psychological barrier that may get tapped or wicked into.
🔴 Short Trade Setup
Entry: After a confirmed SFP at $0.04698–$0.05
Target (TP): Yearly Open (yOpen) — potential move of ~30%
Stop-loss: Above post-SFP high
R:R: Excellent asymmetry if setup confirms
🛠 Indicator Note
In this analysis I'm using my own indicator called "DriftLine - Pivot Open Zones ", which I recently published.
✅ It helps highlight key open levels, support/resistance zones, and price structure shifts — all critical for confluence-based trade planning.
Feel free to check it out — you can use it for free by heading to my profile under the “Scripts” tab.
💡 Educational Insight: How to Trade Wave 5 Liquidity Sweeps
Wave 5 tops often trap late longs, especially when paired with psychological levels and key highs.
➡️ Patience is key — wait for a rejection pattern or SFP before entering.
➡️ Liquidity sweeps first — then the move.
Final Thoughts
PENGU is pushing toward $0.04698–$0.05, but this may be its final move up before correction.
With the yearly open as a logical target, and clear confluence via DriftLine, this setup offers a clean short opportunity — if confirmation comes.
Stay sharp, let price lead, and trade the reaction — not the prediction.
_________________________________
💬 If you found this helpful, drop a like and comment!
Want breakdowns of other charts? Leave your requests below.
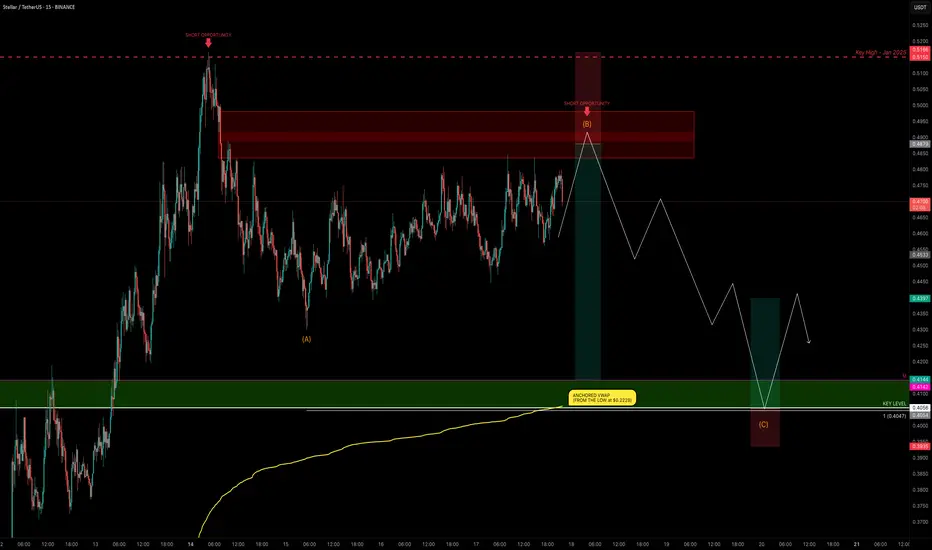
XLM Explodes +132% — Is the Party Over or Just Starting?XLM has been one of the top movers, sweeping the January 2025 swing high at $0.515 before stalling and moving sideways for the past 4 days.
Is XLM gearing up for another push toward the highs, or is a correction imminent?
Let’s dive into the details.
🧩 Market Structure & Fractal Pattern
XLM skyrocketed +132% in just 13 days, mirroring the explosive move seen back in November 2024.
If we apply the November fractal, the current price action suggests we could be setting up for an ABC corrective move.
📉 Key Levels & Confluences
FVG Zone: ~$0.49–$0.50 — likely to be swept before any major move down.
Monthly Support: $0.4142
Key Level / Liquidity Pool: $0.4056 — likely cluster of stop-losses.
Anchored VWAP (from $0.2228 start of trend): currently near $0.4056, adding strong confluence.
1.0 Trend-Based Fib Extension (ABC projection): If price pushes to ~$0.49 to complete wave B, the projected 1.0 TBFE for wave C lands right on the $0.4056 key level + VWAP, creating a perfect confluence zone.
➡️ Conclusion: The $0.4142–$0.4056 zone is a critical support and liquidity area with multiple confluences lining up.
Trade Setups
🔴 Short Setup:
Entry zone: $0.48–$0.50 (ladder in)
Stop-loss: Above $0.5166 (prior high)
Take-profit: $0.4142–$0.4056 zone
R:R ≈ 1:3
🟢 Long Setup:
Entry zone: $0.4142–$0.4056 (preferably near VWAP)
Stop-loss: Below $0.395
Take-profit: $0.44
⚡ Final Thoughts
Watch for a potential final push toward $0.49–$0.50 before a corrective wave unfolds.
The confluence at the $0.4142–$0.4056 zone — including monthly/weekly levels, VWAP, liquidity pool, and the 1.0 TBFE target — makes it a key area for decision-making.
Stay patient and wait for confirmation at these levels. Will post an update as things unfold!
_________________________________
💬 If you found this helpful, drop a like and comment!
Want breakdowns of other charts? Leave your requests below.
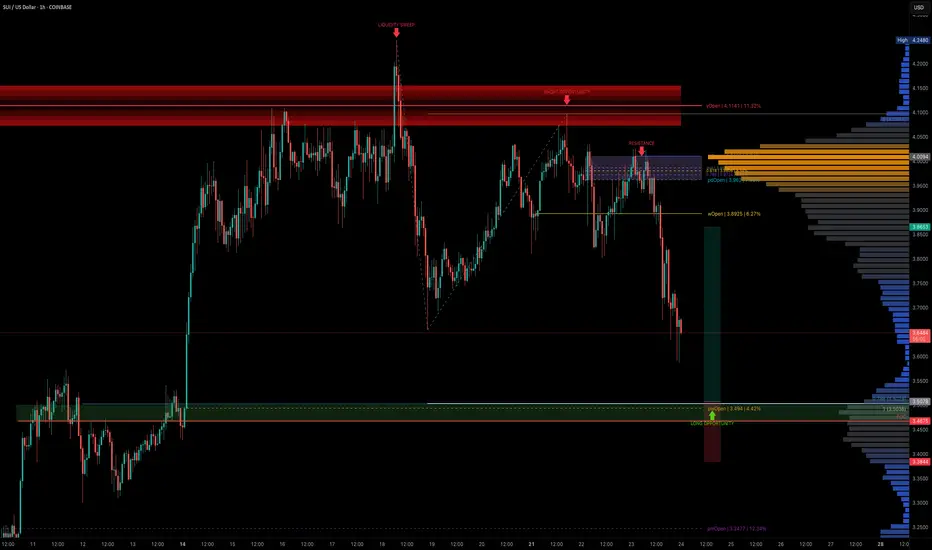
SUI — Structured Dip Buy Zone You Shouldn't IgnoreSUI has been technically clean, with well-respected Elliott Wave counts and fib levels.
As the broader market dips, it's time to look for sniper long entries and SUI is setting up beautifully for one around the $3.50 zone.
🧩 Key Confluence Zone: $3.50
This level offers a high-probability buy zone, backed by multiple layers of technical confluence:
0.786 Fib Retracement: $3.5029
1.0 Trend-Based Fib Extension: $3.5036
Previous Trading Range POC: $3.4675
Previous Weekly Open (pwOpen): $3.494
🟢 Long Trade Setup
Entry: ~$3.500
Stop-loss: $3.4675
Target (TP): $3.85+
R:R: ~1:3
🛠 Indicator Note
In this analysis I'm using my own indicator:
➡️ DriftLine — Pivot Open Zones
It helps identify key market opens (daily, weekly, prior), which often act as magnet levels and reaction zones.
➡️ You can use it for free — just check out my profile under “Scripts” and apply it to your charts.
💡 Pro Insight: Build Trades Where Tools Agree
A single level is just noise. But when fib retracements, extensions, POCs, opens, and price structure all line up — that’s where conviction trades are made.
The more overlap, the more likely the market reacts — this setup shows just that.
Final Thoughts
SUI is approaching a technically rich zone around $3.50, and this could be one of those low-risk, high-reward long entries if confirmed by price action.
With a clean invalidation and 1:3 R:R, this is the kind of setup you want to plan — not chase.
Set your alerts, stay patient, and trade with structure. 🚀✍️
_________________________________
💬 If you found this helpful, drop a like and comment!
Want breakdowns of other charts? Leave your requests below.
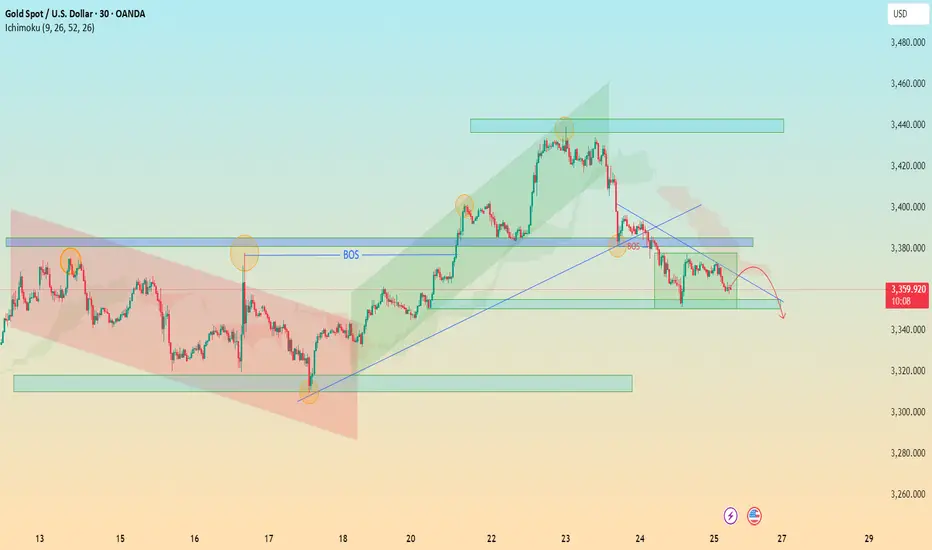
XAU/USD Bearish Retest in Motion – Watch 3340 for Breakout 🔍 XAU/USD (Gold) – Bearish Reversal Outlook
Timeframe: 30-Minute
Date: July 25, 2025
Indicators Used: Ichimoku Cloud, BOS (Break of Structure), Trendlines, Support & Resistance Zones
---
⚙ Technical Breakdown:
1. Previous Market Structure – Accumulation to Expansion:
Descending Channel (Red Box): Market moved within a bearish channel until the breakout occurred.
Key Break of Structure (BOS) around 3365 level signaled the beginning of bullish momentum — a textbook shift from accumulation to expansion phase.
Rally towards 3445 zone: Strong impulsive wave followed by higher highs and higher lows within a green rising channel.
2. Bull Trap and Structural Breakdown:
At the 3445-3460 resistance zone, price failed to maintain momentum and formed a double top / distribution setup.
The second BOS near 3385 confirmed a shift from bullish to bearish market structure.
Ichimoku Cloud also flipped bearish — price is now trading below the cloud, signaling potential continued downside.
3. Current Consolidation and Bearish Retest:
Price is now trapped in a bearish flag / rectangle pattern between 3360 – 3380.
Recent rejections from the descending trendline and overhead supply zone indicate weak bullish attempts and presence of strong selling pressure.
4. Anticipated Move – Bearish Continuation:
The projected red path suggests a retest of the diagonal resistance, followed by a breakdown toward key demand zone at 3340 – 3320.
If that zone fails, we may see a deeper move toward 3280.
---
📌 Key Technical Zones:
Zone Type Price Level (Approx.) Description
Resistance 3445 – 3460 Double Top / Strong Supply
Support 3340 – 3320 Historical Demand Zone
Short-term Resistance 3375 – 3385 BOS Retest + Trendline
---
🎯 Trading Insight:
📉 Bias: Bearish
⚠ Invalidation Level: Break above 3385 with volume
📊 Potential Target: 3340 → 3320
🧠 Trade Idea: Look for short entries on weak retests near descending trendline or cloud rejection.
---
🏆 What Makes This Chart Unique for Editors’ Picks:
✅ Multiple Confluences: Structural shifts (BOS), trendlines, Ichimoku, and classic patterns (channels, flags).
✅ Clear Visual Storytelling: Logical flow from bearish to bullish and back to bearish structure.
✅ Forward Projection: Predictive outlook based on strong technical context — not just reactive analysis.
✅ Educational Value: Useful for beginners and intermediate traders alike to understand structure transitions and key levels.
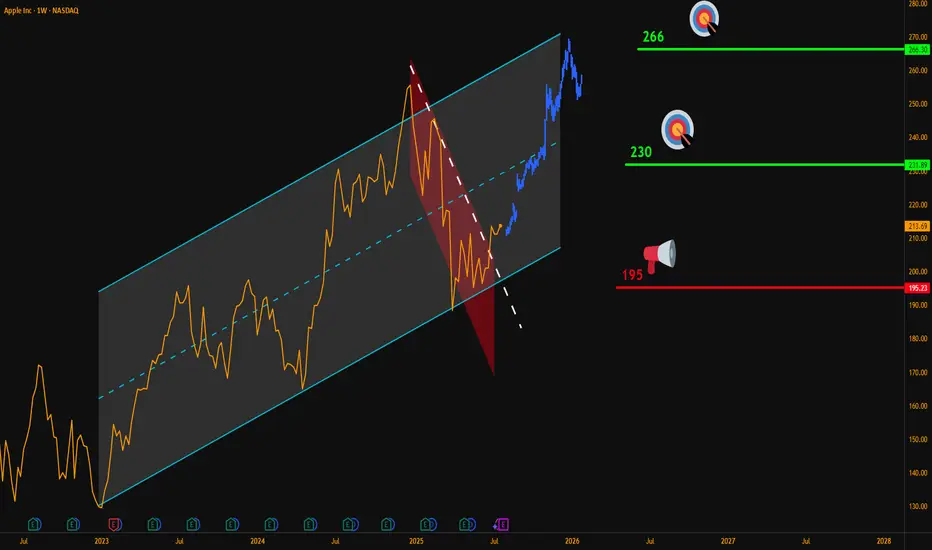
AAPL Weekly Breakout – Targeting $266Hello Traders,
Here’s my latest analysis on Apple (AAPL) based on the weekly chart.
🔍 Chart Breakdown:
Main Uptrend Channel (Blue): Price has respected this channel since 2023.
Red Downtrend Sub-Channel: Recent corrective phase is now broken.
Breakout Signal: Last week, AAPL closed above the sub-channel’s upper line, confirming bullish momentum.
📌 Updated Trade Setup Section:
Entry Zone: Around $215 (current price)
Stop-Loss: Weekly close below $195 (Risk = $20)
Targets:
✅ $230 (Reward = $15 → R:R = 0.75:1)
✅ $266 (Reward = $51 → R:R = 2.55:1)
Always confirm with your own strategy before entering a trade. Position sizing and risk control are key.
💬 Do you think AAPL can reach $266 before Q4 2025? Share your thoughts below!
NASDAQ:AAPL
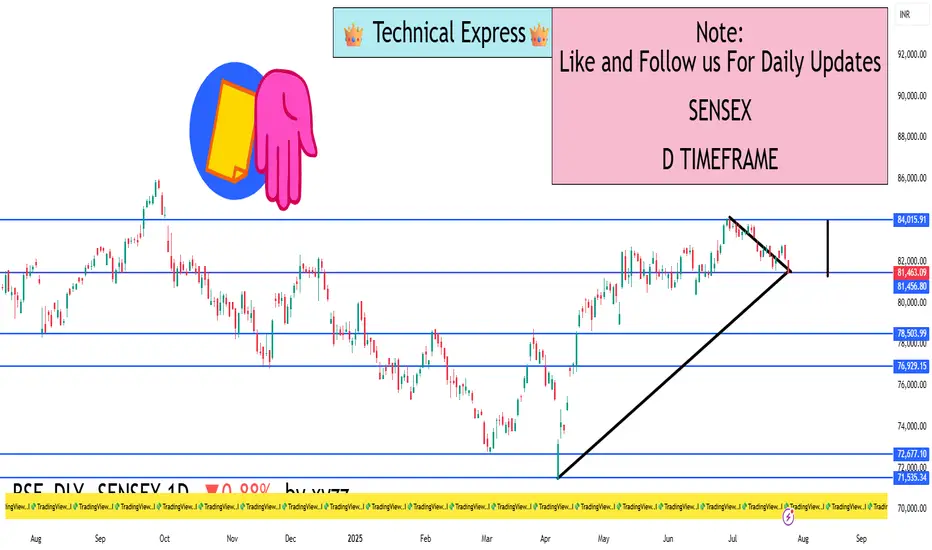
SENSEX 1D Timeframe📉 SENSEX Daily Overview (as of July 25, 2025)
Current Price: Around 81,460
Daily Change: Down by approximately 720 points (–0.9%)
Day’s High: About 82,070
Day’s Low: About 81,400
Previous Close: Around 82,184
📊 1-Day Candlestick Analysis
The candle for today is bearish, indicating strong selling pressure.
The price opened near previous levels but faced resistance at around 82,000.
Sellers dominated most of the day, pushing the index toward the 81,400 support zone.
🔍 Key Support and Resistance Levels
Level Type Price Range
Resistance 82,000 – 82,200
Support 81,400 – 81,000
If Sensex breaks below 81,400, the next target could be around 80,500 or 79,900.
If it holds above support and bounces, it could retest 82,200.
🧠 Technical Trend Analysis
Short-Term Trend: Bearish
Medium-Term Trend: Neutral to mildly bullish (as long as above 80,000)
Market Structure: Lower highs forming, suggesting pressure building on bulls
Indicators (assumed):
RSI may be approaching oversold
MACD likely showing bearish crossover
Volume increasing on red candles—indicating strong sell interest
📌 Sentiment & Market Context
Financial stocks (like banking, NBFCs) are under pressure.
Global cues (such as interest rate uncertainty and geopolitical concerns) are impacting investor confidence.
FII outflows and weak earnings in key sectors are adding to bearish momentum.
The broader trend remains range-bound, but with short-term downside bias.
✅ Strategy Suggestions (For Traders & Investors)
Swing Traders: Wait for a reversal candle (like a bullish engulfing or hammer) before considering long positions.
Breakout Traders: Watch for breakdown below 81,000 for continuation of the fall.
Positional Traders: Can wait to enter near 80,000–79,500 if the market holds that key level.
🔄 Summary
SENSEX is under pressure with a drop of 720+ points.
Technical structure suggests caution, especially if 81,000 breaks.
Support: 81,000 – 80,500
Resistance: 82,000 – 82,200
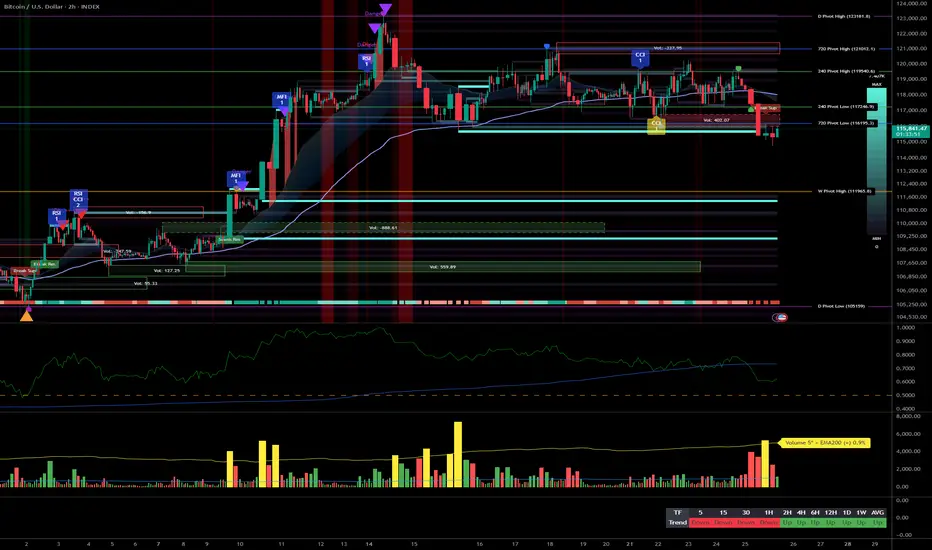
Bitcoin: Strategic Entry Plan on Pullback – 116k Buy Opportunity__________________________________________________________________________________
Technical Overview – Summary Points
➤ Bullish momentum across all higher timeframes (1H to 1W) supported by Risk On / Risk Off Indicator (Strong Buy).
➤ Major supports: 116,128 and 111,980 (multi-timeframe pivots). Key resistance at 123,218.
➤ Very high intraday volumes, pointing towards probable capitulation zones.
➤ Multi-timeframe behaviors: Technical rebound anticipated on the 116,128–115,600 zone, caution if 111,980 breaks.
__________________________________________________________________________________
Strategic Summary
➤ Global Bias: Bullish confirmed mid/long-term.
➤ Accumulation opportunities on key pullbacks near 116,128 and 111,980.
➤ Risk zone: sustained closes below 111,980 = invalidation of bullish outlook (target 105,100).
➤ Macro catalysts: FOMC meeting (July 29-30), heightened event-risk period.
➤ Action plan: favor entries after FOMC volatility resolution, stop-loss adjusted below 111,980.
__________________________________________________________________________________
Multi-Timeframe Analysis
Daily (1D) : Compression under 123,218 resistance, primary bullish trend, no extreme signals.
12H : Healthy consolidation under resistance, no euphoria or panic, normal volumes.
6H : Price squeezed between major supports (116,128–111,980), uptrend confirmed.
4H : Institutional volumes on supports, favors technical rebound.
2H : Speculative rebound underway, confirmation needed for short-term bottom.
1H : Strong capitulation signal, record volumes, immediate retest of 116,128 support.
30min : Local oversold status, extreme sentiment, high technical reversal probability.
15min : Phase of panic likely ending, short-term rebound anticipated.
Key Indicators:
Risk On / Risk Off Indicator: Strong buy on 1D–4H, neutral on 30min and 15min.
ISPD DIV: Neutral to Buy (capitulation signaled on 1H+30min).
Volumes: Very high at lows = capitulation + potential bottom.
MTFTI: Up momentum above 1H, down on lower timeframes (30–5min).
__________________________________________________________________________________
Cross Timeframe Synthesis
High timeframe alignment confirms bullish bias, supported by buyer volumes.
Key zone 116,128–111,980 = multi-timeframe support, tactical focus.
Main risk: break of 111,980.
__________________________________________________________________________________
Operational synthesis & macro context
Bullish bias validated unless breakdown below 111,980.
Tactical accumulation window on pullbacks, 1H confirmation needed.
Volatility risk increases ahead/during FOMC, dynamic stop management essential.
Altcoins fragile: extra caution if BTC triggers Risk Off.
Calendar to watch: FOMC (July 29–30), Durable Goods (July 25).
__________________________________________________________________________________
On-Chain (Glassnode) :
BTC consolidates, no extreme signs; ETH outperforming but caution on alts (elevated leverage).
__________________________________________________________________________________
⏳ *Decision Recap for July 25, 2025, 10:56 CEST:*
— BUY ZONE tactical at 116,128–115,600 (BTC), 1H confirmation required.
— Stop-loss below 111,980 / Swing target >120,000–123,218.
— Risks : Fed announcements, flushes on supports, altcoins at risk.
__________________________________________________________________________________
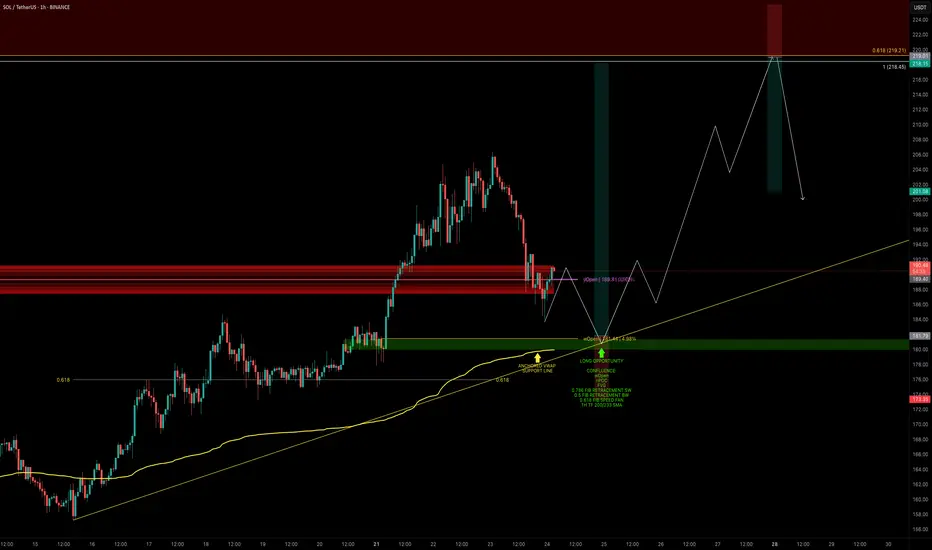
SOL — Bullish Retest in Motion: Time to Strike?SOL has finally broken through the $180 barrier decisively — a key zone it failed to clear back in May.
Now we’re seeing a retest, which may offer one final dip before continuation. Let’s break down the next high-conviction long opportunity.
🧩 Key Retest Zone: $182–$180
➡️ Retesting Prior Resistance as Support
SOL broke above $180 with conviction and is now pulling back.
➡️ First Reaction at $184
A clean bounce occurred at the anchored VWAP, but this might not be the final low.
➡️ Strong Confluence at $180–$182 Zone
This zone is packed with support elements:
Weekly Open (wOpen): $181.44
nPOC: $180.85
Anchored VWAP: ~$179.90
0.5 Fib retracement (of the larger wave)
0.786 Fib retracement (of the smaller wave)
0.618 Fib Speed Fan — projected for tomorrow’s price path
1H 200 & 233 SMAs supporting from below
SOL is currently trading at yOpen — another key pivot level to watch
🟢 Long Trade Setup
Entry: Laddered between $182–$180 (ideal long entry would be at wOpen)
Stop-loss: Invalidation at $173.35
Target (TP): TBFE 1.0: $218.45 / 0.618 Fib retracement: $219.21
R:R: ~1:4.5
Potential Move: ~+20%
🛠 Indicator Used: DriftLine — Pivot Open Zones
For this analysis, I’m using my own published indicator called "DriftLine – Pivot Open Zones " feel free to check it out on my profile.
It helps identify and visualise critical opens (daily, weekly, previous days), providing real-time support/resistance zones.
➡️ You can use it for free — just check my profile under “Scripts” and add it to your chart.
💡 Pro Tip: Support Zones Are Stronger with Confluence
Don’t rely on a single fib or level. When opens, VWAPs, SMAs, and fibs cluster, the probability of a strong reaction increases.
This is how smart traders define clear entries and invalidation.
_________________________________
💬 If you found this helpful, drop a like and comment!
Want breakdowns of other charts? Leave your requests below.
USD/JPY: A Bullish Thesis for Trend ContinuationThis analysis outlines a data-driven, bullish thesis for USD/JPY, identifying a strategic long entry within an established market trend. The setup is supported by a combination of fundamental catalysts and a clear technical structure.
📰 The Fundamental Picture
The primary driver for this trade will be the high-impact US economic data scheduled for release. This release is expected to inject significant volatility into the market. Fundamentally, this trade is a play on the deep policy differences between the US Federal Reserve and the Bank of Japan. While the Fed's future steps are a topic of debate, the Bank of Japan's policy remains one of the most accommodative in the world, creating a long-term headwind for the Japanese Yen. This dynamic provides a strong fundamental basis for relative US Dollar strength against the Yen.
📊 The Technical Structure
Chart analysis reveals that USD/JPY is in a confirmed and healthy uptrend. The current price action indicates a constructive pullback, presenting a strategic opportunity to join the dominant trend at a favorable price. The proposed entry point is positioned at a key technical level that offers a low-risk entry. Technical indicators support the continuation of the trend, suggesting that momentum remains with the bulls.
✅ The Trade Plan
This trade is structured with a clear and favorable risk-to-reward profile, aiming to capitalize on the established trend.
👉 Entry: 146.343
⛔️ Stop Loss: 145.233
🎯 Take Profit: 148.560
⚖️ Risk/Reward Ratio: 1:2

EUR/JPY: Bullish Thesis on Policy DivergenceOur primary thesis is built on a powerful confluence of compelling fundamental drivers and a clear technical structure. We are taking a long position in EUR/JPY with high conviction, anticipating significant upside fueled by a stark monetary policy divergence confirmed by a constructive chart formation.
📰 Fundamental Analysis: The core of this trade is the widening policy gap between the European Central Bank (ECB) and the Bank of Japan (BoJ). While the BoJ is only just beginning to exit its ultra-loose monetary policy, the global environment points toward continued JPY weakness. The upcoming high-impact US news will act as a major catalyst. A "risk-on" reaction to the data would significantly weaken the JPY, providing a strong tailwind for this trade.
📊 Technical Analysis: The chart structure for EUR/JPY is decidedly bullish. The pair has established a clear uptrend, and recent price action indicates a period of healthy consolidation above key support levels. This presents a strategic entry point, as the market appears to be gathering momentum for the next leg higher. The current setup suggests a low-risk entry into a well-defined upward trend.
🧠 The Trade Plan: Based on this synthesis, we are executing a precise trade with a favorable risk profile.
👉 Entry: 172.422
⛔️ Stop Loss: 171.292
🎯 Take Profit: 174.684
⚖️ Risk/Reward: 1:2

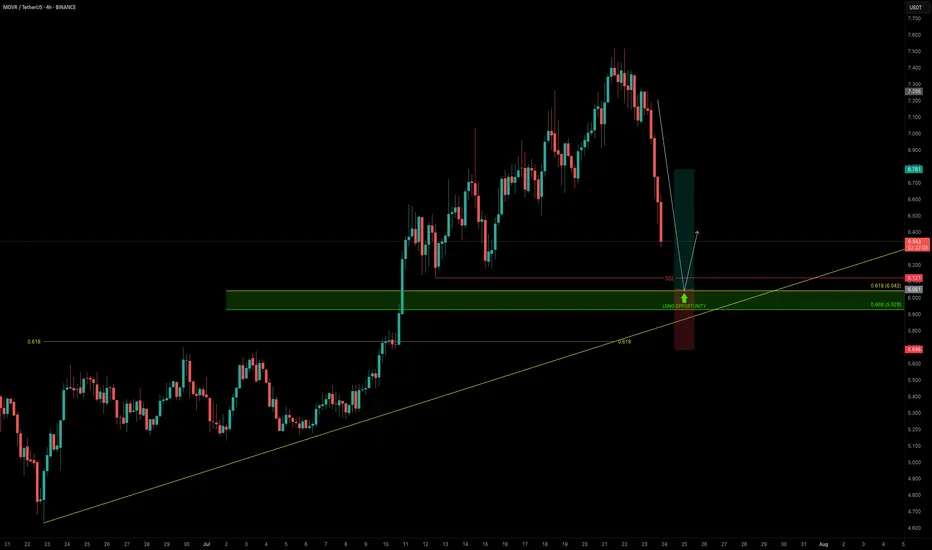
MOVR — Buying the Dip Into Confluence SupportAs the broader market pulls back, it’s the perfect time to scan for high-conviction long setups — and MOVR stands out.
Price is approaching a strong confluence support zone, offering a solid long opportunity.
🧩 Key Technicals
➡️ Liquidity Pool Below the Low:
There’s a visible liquidity pocket just beneath the swing low at $6.121 — an area where stop hunts and reversals are likely.
➡️ Fib & Speed Fan Confluence:
0.618 Fib retracement from the recent move aligns at $6.042
0.618 Speed Fan level also intersects the zone
Together, they form a technical floor right at the $6 psychological level
🟢 Long Trade Setup
Entry: $6.042
Stop-loss: $5.685 (below structure & liquidity sweep)
Target (TP): $6.78
R:R: ≈ 1:2+
Plan: Wait for price to fill into the zone and monitor for a bullish reaction (e.g., SFP, bullish structure reclaim)
💡 Why It Matters: Confluence Builds Confidence
When multiple tools — fib retracement, speed fan, liquidity pools, and psychological round numbers — all line up, it increases the probability of a strong reaction.
This is how smart money builds positions — not by chasing pumps, but by entering where others panic.
Final Thoughts
MOVR is approaching a clean, high-probability buy zone just below $6.00.
If the level holds and confirms with price action, this setup offers a solid R:R and a clear invalidation point.
📌 Mark the zone, set your alert, and let price come to you.
_________________________________
💬 If you found this helpful, drop a like and comment!
Want breakdowns of other charts? Leave your requests below.
XAU/USD – Ranging Market Prepping for Breakout?Gold has been ranging for the next couple months and usually I am out of the market during the months of April Through July because historically these are not my best months trading XAU/USD. However you will see me posting a lot more in the coming months because my best months historically are August - December where the market really cranks up with some bigger moves.
So in a summarized version below you will find what it is that i am looking at with gold.
Gold (XAU/USD) has remained locked in a defined consolidation range between 3,250 (support) and 3,450–3,502 (resistance) since early April. Price has printed multiple internal falling wedge formations within this zone, indicating compression before potential expansion.
🔍 Technical Overview
Range Duration: ~3.5 months
Key Range:
Support: 3,250
Resistance: 3,450–3,502
Compression Patterns: Multiple falling wedges breaking upwards inside the range, hinting at bullish pressure.
Touch Confirmations: Both range boundaries have been tested multiple times, reinforcing validity (per Multi-Touch Confirmation).
Contextual Bias: Seasonally, August–December tends to be a high-volatility trending period for Gold.
🎯 Trade Plan
Inside Range:
Maintain neutral bias.
Execute range-to-range scalps/swing setups with clear invalidation zones.
Avoid trading mid-range.
Breakout Scenario (Bullish):
A clean close above 3,502 triggers breakout watch.
Ideal setup: Retest + 15-min flag → long continuation.
Potential upside target: ~3,700 (range height extension).
Breakdown Scenario (Bearish):
Loss of 3,250 opens door to bearish continuation.
Look for clean liquidity sweep or structure flip before committing.
Initial downside target: 3,100 zone.
🛡️ Risk Notes
Avoid third-touch entries in aggressive momentum unless followed by flag formation.
Remain disciplined with the 80/20 confluence rule — don't let perfectionism delay entries.
Always execute with pre-trade checklist and defined R:R profile.
✅ Summary
Gold is at a pivotal point. The confluence of a tight multi-month range, internal compression patterns, historical breakout timing, and validated levels builds a compelling case for an imminent expansion move. Remain patient, avoid anticipation, and react to confirmed structure and price behavior.

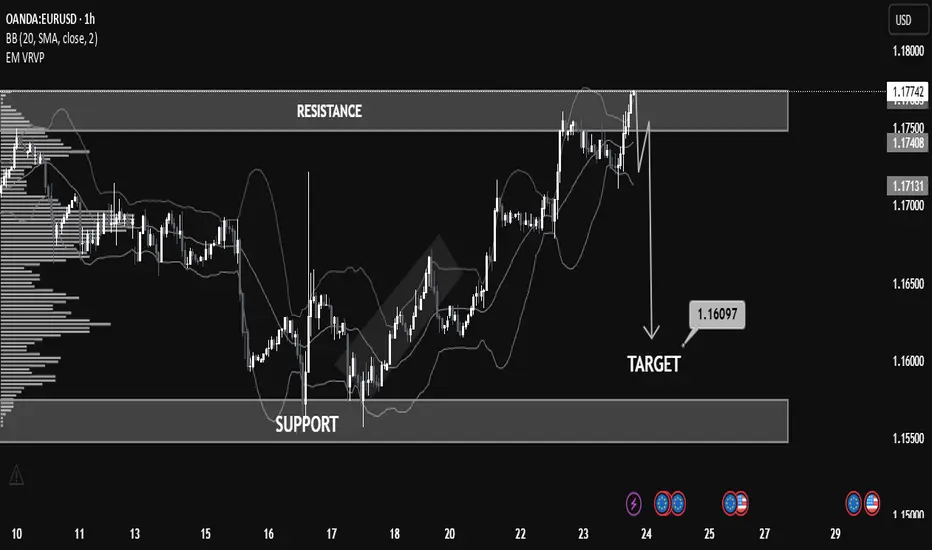
Educational EUR/USD Chart Breakdown – Price Action at Key LevelsEducational EUR/USD Chart Breakdown – Price Action at Key Levels
This EUR/USD (1-hour) chart provides a great example of how support and resistance zones, combined with price action and indicators like Bollinger Bands, can help anticipate market moves.
🔹 Resistance Zone Tested:
The pair recently approached the 1.17500–1.17800 resistance zone. This level had previously acted as a supply zone, and price once again showed rejection here, indicating selling pressure.
🔹 Bollinger Band Overextension:
Notice how the price extended beyond the upper Bollinger Band—this often signals that the market is overbought in the short term, leading to a potential reversal or correction.
🔹 Bearish Reaction & Target:
After rejection from resistance, the chart outlines a bearish move with a target at 1.16097. This level lies just above the next strong support zone (1.15500–1.16100), offering a realistic area for price to stabilize if the downtrend continues.
🔹 What to Learn:
Support & Resistance: Prices often react at key zones; previous resistance can turn into support and vice versa.
Confluence Tools: Use indicators like Bollinger Bands with price structure to increase confidence.
Target Planning: Identify likely reaction zones for risk management and profit-taking.
📚 Summary
This setup is a clean example of trading within a range and using technical confluence to plan entries and exits. If price breaks below 1.17130 with strong momentum, the probability increases for the market to reach the 1.16097 target.
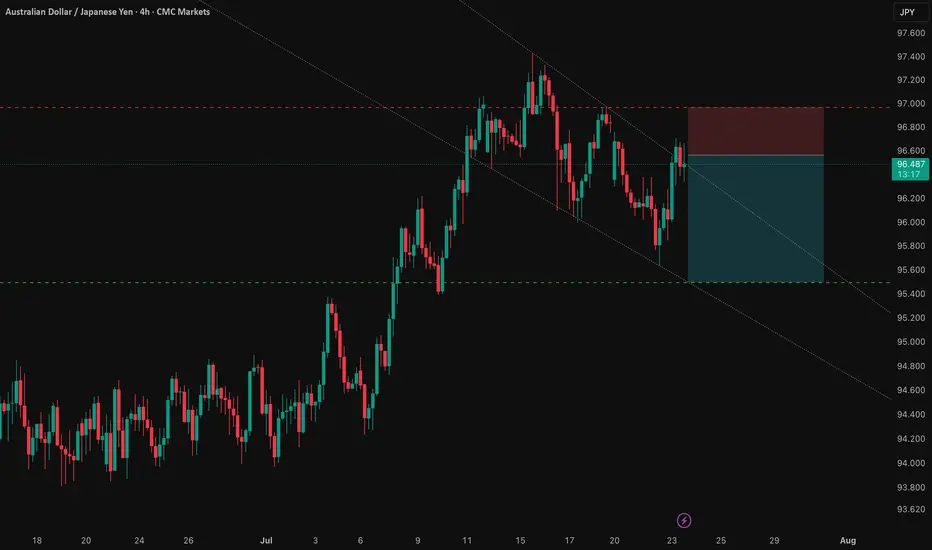
AUD/JPY: Capitalizing on the RBA-BoJ Monetary Policy GapThis analysis outlines a compelling short opportunity in AUD/JPY, driven by a powerful confluence of fundamental and technical factors. The trade is strategically positioned ahead of a key catalyst that could unlock significant downside potential.
1️⃣ The Core Thesis: A Clear Policy Divergence
The primary driver behind this trade is the stark and widening gap in monetary policy between the Reserve Bank of Australia (RBA) and the Bank of Japan (BoJ). The RBA is signaling a clear dovish pivot amid a weakening labor market, making an interest rate cut imminent. Conversely, the BoJ is in a tightening phase, creating a fundamental headwind for the AUD relative to the JPY. This divergence underpins the strategic bearish bias.
2️⃣ The Confirmation: Technical Alignment
This fundamental view is supported by a clear technical picture. The pair is in a well-defined downtrend and is currently testing a critical support level. This alignment of fundamental and technical factors presents a clear short opportunity, with the entry positioned for a breakdown below this key juncture.
3️⃣ The Catalyst: The RBA Bulletin
The immediate catalyst for this trade is the upcoming RBA Bulletin on July 24, 2025. Any dovish language from the RBA concerning Australia's economic outlook will likely reinforce expectations for a rate cut and accelerate the downward move in AUD/JPY.
The Trade Setup ✅
Here is the recommended trade setup:
📉 Trade: SHORT AUD/JPY
👉 Entry: 96.56200
⛔️ Stop Loss: 96.96386
🎯 Take Profit: 95.49900
🧠 Risk/Reward Ratio: 2.65
This setup offers a compelling risk-reward profile, capitalizing on a clear and powerful macroeconomic theme. The trade is designed to perform should the expected catalyst confirm the underlying bearish fundamentals.
SILVER (XAGUSD): Confirmed Break of Structure
Silver updated a year's high yesterday, breaking a strong daily resistance.
With a confirmed Break of Structure BoS, we can expect that
the market will rise even more.
The next strong resistance is 40.
It is a round number based psychological level.
It can be the next goal for the buyers.
❤️Please, support my work with like, thank you!❤️
I am part of Trade Nation's Influencer program and receive a monthly fee for using their TradingView charts in my analysis

Apple (AAPL) — Expected 20% GrowthThe fundamental outlook for Apple stock remains positive: the upcoming fall presentation and anticipated AI-related announcements are driving bullish sentiment.
Technical picture:
The price has broken through a key trendline, signaling a shift in momentum toward growth.
Near-term target: a move toward the 225.0 level.
Next step: a possible pullback to 214.0 for a retest of the support level.
Long-term scenario: after the correction, I expect a rise toward 250.0, which could bring approximately 20% growth within 1–2 months.
This growth potential may coincide with Apple’s upcoming earnings report and further AI news.

Solid setup for $DLTR in 2025 : $95-$105- NASDAQ:DLTR is a nice turn around story for 2025. It is showing great strength when the market is red.
- Any fear around recession will skyrocket this stock. This is by far one of the best risk/reward setup which provide gains when the market is red or is going under correction of some sort.
- It's a better buy than its peer NYSE:DG as headwinds for NASDAQ:DLTR are temporary and can be resolved as compared to NYSE:DG which has headwinds which will take time.

Watching: NFLXKeep an eye on NFLX. It is setting up for a potential bounce if we can get a close above the 5-SMA. Cheers!

New Setup: METAMeta is now setting up for a potential bounce now. If the Markets can be positive tomorrow, we should see Meta also participate.

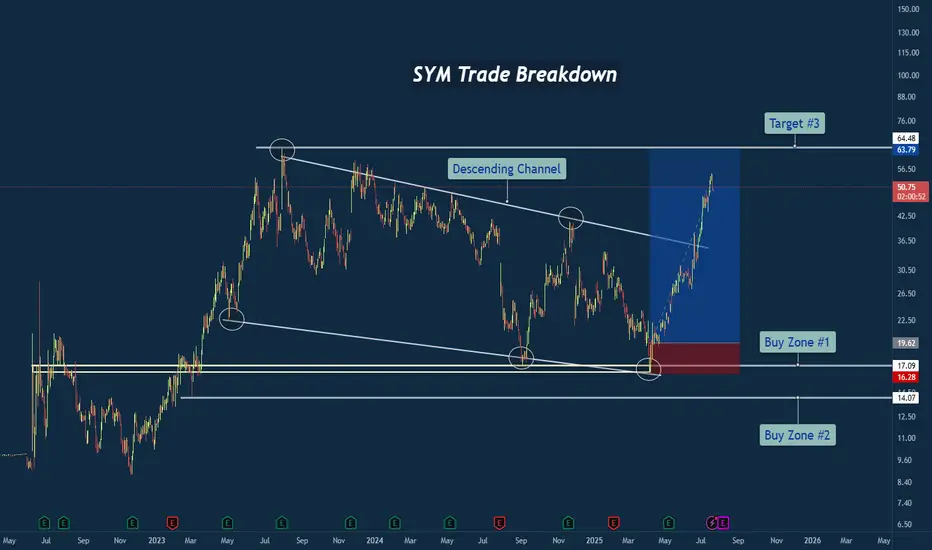
SYM Trade Breakdown – Robotics Meets Smart Technical's🧪 Company: Symbotic Inc. ( NASDAQ:SYM )
🗓️ Entry: April–May 2025
🧠 Trade Type: Swing / Breakout Reversal
🎯 Entry Zone: $16.28–$17.09
⛔ Stop Loss: Below $14.00
🎯 Target Zone: $50–$64+
📈 Status: Strong Rally in Motion
📊 Why This Trade Setup Stood Out
✅ Macro Falling Wedge Reversal
After nearly two years of compression inside a falling wedge, price finally tapped multi-year structural support and fired off with strength. This wasn’t just a bottom — it was a structural inflection point.
✅ Triple Tap at Demand Zone
Symbotic tapped the ~$17 area multiple times, signaling strong accumulation. Volume and momentum picked up with each successive test, showing institutional interest.
✅ Clean Break of Trendline
Price broke through the falling resistance trendline decisively, confirming the bullish reversal and unleashing stored energy from months of sideways structure.
🔍 Company Narrative Backdrop
Symbotic Inc. isn't just any tech stock. It’s at the forefront of automation and AI-powered supply chain solutions, with real-world robotics deployed in major retail warehouses. That kind of secular growth narrative adds rocket fuel to technical setups like this — especially during AI adoption surges.
Founded in 2020, Symbotic has quickly become a rising name in logistics and warehouse automation, serving the U.S. and Canadian markets. With robotics in demand and investors chasing future-ready tech, the price action aligned perfectly with the macro theme.
🧠 Lessons from the Trade
⚡ Compression = Expansion: Wedges like this build pressure. When they break, the moves are violent.
🧱 Structure Never Lies: The $17 zone was no accident — it was respected over and over.
🤖 Tech Narrative Boosts Confidence: Trading is easier when the fundamentals align with the technicals.
💬 What’s Next for SYM?
If price holds above the wedge and clears the $64 resistance, we could be looking at new all-time highs in the next cycle. Watching for consolidation and retests as opportunity zones.
#SYM #Symbotic #Robotics #Automation #AIStocks #BreakoutTrade #FallingWedge #SwingTrade #TechnicalAnalysis #TradingView #TradeRecap #SupplyChainTech